Introduction
Montmorillonite (Mnt) is one of the most important components in soils and clays for the adsorption of cations due to its large cation exchange capacity (CEC). It is often also used as a barrier in disposal sites due to its abundance and low price (Reijonen and Alexander Reference Reijonen and Alexander2015; Milodowski et al. Reference Milodowski, Norris and Alexander2016). Understanding the adsorption mechanism of divalent cations on Mnt helps to explain their transportation and fate in the environment.
Most inorganic soil nutrients and contaminants can dissolve in water and exist as ions. Their adsorption and desorption on the solid phase play a significant role in their availability and fate in the environment, which, in turn, impacts environmental health and safety. Divalent alkaline earth cations are abundant in the earth’s crust, ranging from 0.025% for Ba to 3.63% for Ca (Fleischer Reference Fleischer1953). The divalent Mg2+ and Ca2+ cations are essential plant nutrients (Jones Reference Jones2012). The 90Sr isotope which is radioactive, with a half-life of 28 years (Lagoutine et al. Reference Lagoutine, Legrand and Bac1978), can enter the environment via wastewater from nuclear power plants, from the fallout from nuclear weapons testing, or from nuclear accidents (Libby Reference Libby1956). The Sr2+ cations have similar properties to Ca2+ cations, so Sr2+ will substitute readily for Ca2+ in the food chain and be deposited in the bones of mammals that consume it (Starichenko Reference Starichenko2011). The emission of beta particles from 90Sr can result in tumors (Nilsson and Book Reference Nilsson and Book1987). Although the Ba2+ cation has a wide application in industry, high levels of Ba2+ have caused serious environmental problems from mining (Kravchenko et al. Reference Kravchenko, Darrah, Miller, Lyerly and Vengosh2014). The divalent alkaline earth cations are in the same column in the periodic table of elements and have similar electron configurations (all subshells are filled and end with s2, which are easily lost). These cations should, therefore, follow similar reaction processes when reacting with soil components.
The Cd2+ cation is ubiquitous in nature from weathering of rocks and its anthropogenic source is increasing due to its industrial applications (Pinot et al. Reference Pinot, Kreps, Bachelet, Hainaut, Bakonyi and Polla2000). The Cd2+ cation is a highly soluble and mobile divalent heavy metal in the environment (Cullen and Maldonado Reference Cullen, Maldonado, Sigel, Sigel and Sigel2013). High levels of Cd2+ can accumulate in the human body and cause serious health issues (Nordberg Reference Nordberg2004). The Cd2+ cation is a transition metal and its electron configuration is [Kr]4d105s2, where the s2 subshell is easily lost. In this regard, it is very similar to the alkaline earth metals, and should, therefore, follow reaction processes with soil components which are similar to those of the alkaline earth cations.
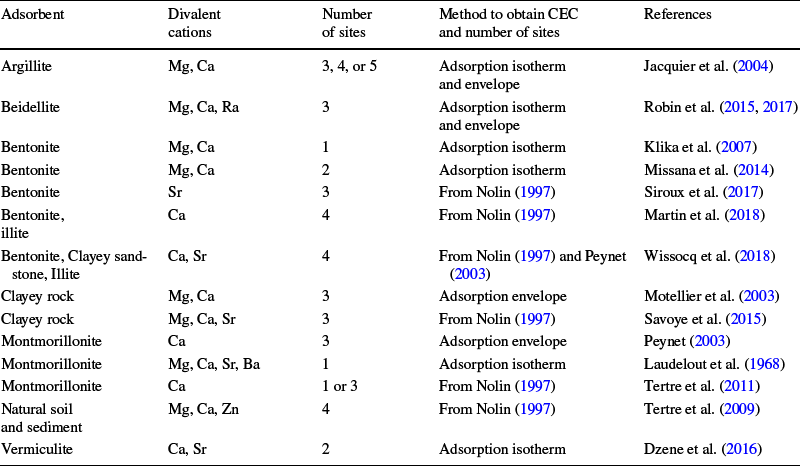
Ion-exchange models have been shown to be useful tools to describe and predict cation adsorption on soil constituents over a wide range of chemical conditions (Table 1). The ion-exchange models are essentially macroscopic models that consider the overall sorption properties of mineral phases based on charge-balance principles, and do not consider any intrinsic assumptions on the nature of the surface interactions. Ion-exchange models can describe and predict the sorption of both major and trace elements in a system.
Literature review of ion-exchange models for divalent cation adsorption on soil minerals

The number of adsorption sites and the CEC of each site are essential parameters of ion-exchange models. The optimization of these two parameters was based normally on the model fitting of cation adsorption data, and thus can vary greatly in the literature for similar minerals (Table 1). Cation adsorption data were collected commonly as a function of pH (adsorption envelopes) or cation concentration (adsorption isotherms). For example, the number of adsorption sites in some studies was taken from the number of edges in the adsorption envelope curve and the CEC of each site from their adsorption maxima (Motellier et al. Reference Motellier, Ly, Gorgeon, Charles, Hainos, Meier and Page2003; Jacquier and Beaucaire Reference Jacquier, Ly and Beaucaire2004; Robin et al. Reference Robin, Tertre, Beaufort, Regnault, Sardini and Descostes2015, Reference Robin, Tertre, Beaucaire, Regnault and Descostes2017). Some other studies obtained directly the number of adsorption sites and the CEC of each site from the Na+ adsorption envelope curve of Nolin’s (Reference Nolin1997) Na+ adsorption envelope curve (Savoye et al. Reference Savoye, Beaucaire, Grenut and Fayette2015; Siroux et al. Reference Siroux, Beaucaire, Tabarant, Benedetti and Reiller2017; Wissocq et al. Reference Wissocq, Beaucaire and Latrille2018).
Reducing the number of unknown parameters in ion-exchange models reduces their dependence on the curve-fitting exercise and increases the certainty of the models. Alkali cation adsorption data on Mnt were described successfully (Li and Schulthess Reference Li and Schulthess2020) using an ion-exchange model that used pre-determined model parameters (i.e. number of adsorption sites and relative CEC percentage on each site) from an independent Density Functional Theory simulation (DFT; Li et al. Reference Li, Schulthess, Co, Sahoo and Alpay2020). Three types of interlayer adsorption sites with distinctive H+ adsorption strengths were found on Mnt based on the Fe–Mg distance in cations in the octahedral sheets. The relative CEC of each of these three types of sites corresponded to the probability of formation of their octahedral Fe–Mg distances. With the independently calculated number of adsorption sites and relative CEC of these three sites, a three-site ion-exchange model was developed to describe successfully monovalent cation adsorption data on Mnt. This model was able to describe Cs+ adsorption isotherm data, as well as the retention of various mixtures of monovalent cations in pH-dependent adsorption envelopes.
The current study aimed to test the validity of the ion-exchange model developed by Li and Schulthess (Reference Li and Schulthess2020) for predicting divalent cation adsorption on Mnt. In other words, it sought to test an ion-exchange model for the retention of divalent cations based on three interlayer sites with the same relative CEC of each site that was developed previously for monovalent ions. The study also sought to investigate the relation between cation adsorption strength and the clay’s interlayer space, which was previously observed with monovalent cations (Li and Schulthess Reference Li and Schulthess2020).
Materials and Methods
Na, Mg, Ca, Sr, Ba, and Cd-saturated Montmorillonite
The same NaMnt sample from Li and Schulthess (Reference Li and Schulthess2020) was used in the present study. The NaMnt was prepared by mixing SWy-3 Mnt (from the Source Clays Repository of The Clay Minerals Society) with 0.01 mol/L HCl for 12 h, centrifuging at 29,900×g and 20°C for 5 min, decanting the supernatant, adding 1 mol/L NaCl solution, and resuspending the clay sediment. This procedure was carried out eight times using 1 mol/L NaCl solutions, followed by washing with deionized water a further eight times to remove the excess NaCl salt and to reach neutral pH conditions. These steps were performed in centrifuge tubes using 2 g of clay with 30 mL of liquid in each tube. Some of the smaller clay particles were lost with decanted supernatants when the clay was washed with deionized water; no loss of clay sample was observed in subsequent steps. The final NaMnt clay suspension was then diluted with deionized water to 4 L and pH 6.7.
The solids concentration in the NaMnt stock suspension was 21.30 g/L. The dry clay samples were analyzed at high temperatures. A supernatant aliquot was first oven-dried at 80°C for 12 h, followed by heating at a rate of 10°C/min up to 800°C under an argon atmosphere and analyzed using thermogravimetric analysis (TGA Q500, TA Instruments, New Castle, Delaware, USA). The 21.30 g/L clay concentration value was based on the dry clay weight at the temperature of 178°C, from which all the interlayer water had been removed (Bala et al. Reference Bala, Samantaray and Srivastava2000; Tajeddine et al. Reference Tajeddine, Gailhanou, Blanc, Lassin, Gaboreau and Vieillard2015).
The Mg-, Ca-, Sr-, Ba-, and Cd-saturated Mnt samples (designated MgMnt, CaMnt, SrMnt, BaMnt, and CdMnt, respectively) were prepared using the same procedure as employed by Li and Schulthess (Reference Li and Schulthess2020) starting with NaMnt. Aliquots of 30 mL of NaMnt clay suspension were centrifuged at 29,900×g and 20°C for 5 min, and the supernatant decanted. The resultant clay sediments were then mixed with 20 mL of corresponding 1 mol/L solutions of MgCl2, CaCl2, SrCl2, BaCl2, or CdCl2 for 12 h, centrifuged at 29,900×g and 20°C for 5 min, the supernatant decanted, new solution added, and the clay sediment resuspended to 30 mL. This procedure was carried out eight times, followed by washing with deionized water a further eight times to remove the excess salt. On the eighth time, the clay suspensions saturated with corresponding cations were centrifuged at 29,900×g and 20°C for 30 min to compact the clay samples more completely, the supernatants were decanted, and no losses of clay samples were observed. The resulting clay sediments were water-saturated and analyzed using X-ray diffractometry, as discussed below.
Cation Adsorption Envelopes
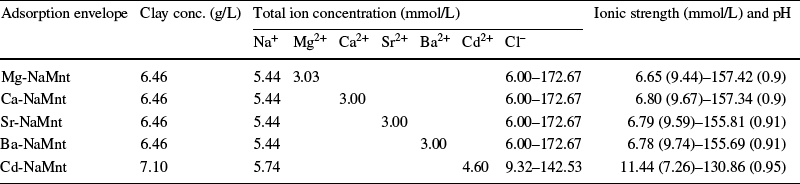
Stock solutions of MgCl2, CaCl2, SrCl2, BaCl2, and CdCl2 (30 mmol/L each) and NaOH (56 mmol/L) were prepared using reagent-grade chemicals. In the adsorption envelope experiments, the clay suspension and solutions were added as follows: into 50-mL nominal Oak Ridge centrifuge tubes (Thermo Fisher Scientific, Boston, Massachusetts), 9.0 mL of clay suspension was mixed with variable amounts of distilled water, and variable amounts of 0.01, 0.05, or 2 mol/L HCl for pH adjustment; 0.5 mL of 56 mmol/L NaOH was then added for fixed competitive Na+ concentrations, followed by 3.0 mL of the corresponding salt solutions (MgCl2, CaCl2, SrCl2, BaCl2). The total volume in each tube was 30 mL. Similar procedures were conducted for CdCl2 adsorption envelopes but using 10.0 mL of clay suspension and 4.6 mL of CdCl2 solution instead. The initial conditions for various cation-adsorption reactions are listed in Table 2
The initial conditions for cation-adsorption reactions. The Cl– concentration varied due to the addition of HCl for pH adjustments. The pH values are shown in parentheses after the minimum and maximum ionic-strength values

All the batch suspensions were mixed for 20 h at 25 ± 2°C, centrifuged at 29,900×g and 20°C for 30 min, and the supernatant solution analyzed for remaining aqueous cation concentrations and pH. The cation concentrations were analyzed using inductively coupled plasma-atomic emission spectroscopy (ICP-AES, Spectro Ciros, Kleve, Germany). Aqueous equilibrium pH was measured using a Thermo Scientific Orion 2-Star Benchtop pH Meter.
The amounts of cations adsorbed were obtained by subtracting the remaining aqueous cation concentration from the total initial cation concentration. A propagation-of-error analysis was performed on all the adsorption data. The ion-exchange model parameters were optimized using IExfit software (version 3.3, www.alfisol.com). Ionic activities of aqueous ions were calculated using the Davies equation (Davies Reference Davies1938). The goodness-of-fit pseudo-R 2 values of the optimization results are Efron’s pseudo-R 2 values (Efron Reference Efron1978), which is used commonly for non-linear regression studies. The stability constants of the aqueous reactions were from the National Institute of Standards and Technology database (NIST 46.8; www.nist.gov/srd/nist46).
X-ray Diffraction Analysis
The d 001 values of wet clay samples from centrifugation containing various cations were measured at room temperature using XRD analysis (D2 Phaser, Bruker Corp., Madison, Wisconsin, USA). The XRD was equipped with a powder diffractometer with CuKα radiation (wavelength = 1.54184 Å), graphite monochromator, and a LynxEye linear detector. The centrifuged wet clay samples from the cation adsorption envelopes and Mg-, Ca-, Sr-, Ba-, Cd-saturated samples were put in a Si low-background sample holder (Bruker Corp.) using a spatula and leveled with a glass slide. Data were collected from 2 or 5–12°2θ with a 0.02°2θ step size and a count time of 0.5 s per step. The weights of these clay pastes were recorded before and after XRD analysis to examine the losses of water from the clay during the analysis process. The water loss was negligible (<0.3%). The influence of clay water content on the XRD d 001 values was tested with a batch analysis of SWy-3 samples with water contents ranging from 70 to 86% equilibrated for 90 h. The XRD peak intensities decreased with increasing water content, and the d 001 values increased by 1 Å. The clay samples from the cation adsorption envelope and isotherm experiments had a water-content range of 70–78% (equivalent to 2.33–3.55 g of water per g of dry clay sample), which corresponds to a variability of 0.2 Å for the d 001 value.
RESULTS AND DISCUSSION
Mineral Stability and Cation Exchange Capacity
The same SWy-3 and NaMnt samples were used in the present study as in that by Li and Schulthess (Reference Li and Schulthess2020). The XRD analysis showed small amounts of feldspar, illite, and quartz impurities in the SWy-3 and NaMnt samples. The CEC values of feldspar (2.8–20 μmol/g, Nash and Marshall Reference Nash and Marshall1956), illite (75–240 μmol/g, Baeyens and Bradbury Reference Baeyens and Bradbury2004), and quartz (0 μmol/g) are much smaller than Mnt (764 μmol/g, The Clay Minerals Society 2020). Accordingly, the primary mineral contributing to the CEC of NaMnt was Mnt, and the model development treated the NaMnt as pure Mnt. Very low concentrations of K+, Ca2+, and Mg2+ cations existed in the NaMnt sample after the Na-saturation procedures, and the equivalent charge of these three types of cations was 1.68% of the total Na+ in the sample (712.8 ± 1.7 µmol/g, Li and Schulthess Reference Li and Schulthess2020). The removal of cations from clay minerals was suggested to be very difficult when working with SWy-1 Mnt (Baeyens and Bradbury Reference Baeyens and Bradbury1997). Na+, K+, and Ca2+ cations were found in Cu-trien- or alkylammonium-saturated smectites (clay sources not provided) by Kaufhold et al. (Reference Kaufhold, Dohrmann, Stucki and Anastácio2011), who suggested that these cations came from undetected traces of feldspar or volcanic glass. The K+, Ca2+, and Mg2+ cations in the NaMnt were not considered in the present study due to the small amounts. Accordingly, Na+ was the only dominant exchangeable cation in NaMnt.
The aqueous Al3+ and Fe3+ concentrations were analyzed to examine the dissolution of clay minerals at low pH. The aqueous Al3+ and Fe3+ concentrations increased as the pH decreased below pH 5 and 4, respectively. If the aqueous Al3+ and Fe3+ cations came from the dissolution of clay minerals, the dissolution and re-adsorption of these autochthonous Al3+ and Fe3+ ions result essentially in a restructuring of clay surface sites. Based on the chemical formula of NaMnt and the aqueous Al3+ and Fe3+ concentrations, the greatest dissolution rates of NaMnt in the presence of various divalent cations were estimated to be 0.05% and 1.03%, respectively (data not shown). If some of the aqueous Al3+ and Fe3+ cations came from the detachment of colloids, as observed by Kaufhold and Dohrmann (Reference Kaufhold and Dohrmann2008) for 38 different types of bentonite samples, then the clay dissolution rates were less than the above-predicted values. Accordingly, clay dissolution was not included in adsorption modeling because of the low aqueous Al3+ and Fe3+ concentrations and the low estimate on clay dissolution.
Ion-Exchange Modeling
The development of an adsorption model for divalent cations should be a consistent and logical continuation of models developed for monovalent cations on the same mineral. Specifically, the number of adsorption sites, the CEC of each site, and cation adsorption strength should be the same for both models. Using DFT simulations, three types of adsorption sites with distinctive H+ adsorption strengths were identified on Mnt based on their octahedral Fe-Mg cation distribution (Li et al. Reference Li, Schulthess, Co, Sahoo and Alpay2020). All three sites were interlayer sites, and their relative CEC can be calculated based on the statistical probabilities of their octahedral Fe-Mg cation distributions. Accordingly, three types of adsorption sites and their relative CECs were identified on NaMnt, and a three-site ion-exchange model was developed successfully to describe the adsorption of monovalent alkali cations on NaMnt (Li and Schulthess Reference Li and Schulthess2020). To maintain consistency of the nature of adsorption sites on NaMnt, a similar three-site ion-exchange model was developed here to predict divalent cation adsorption on NaMnt.
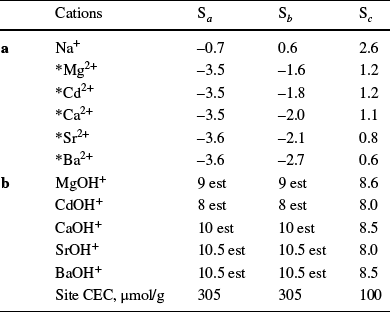
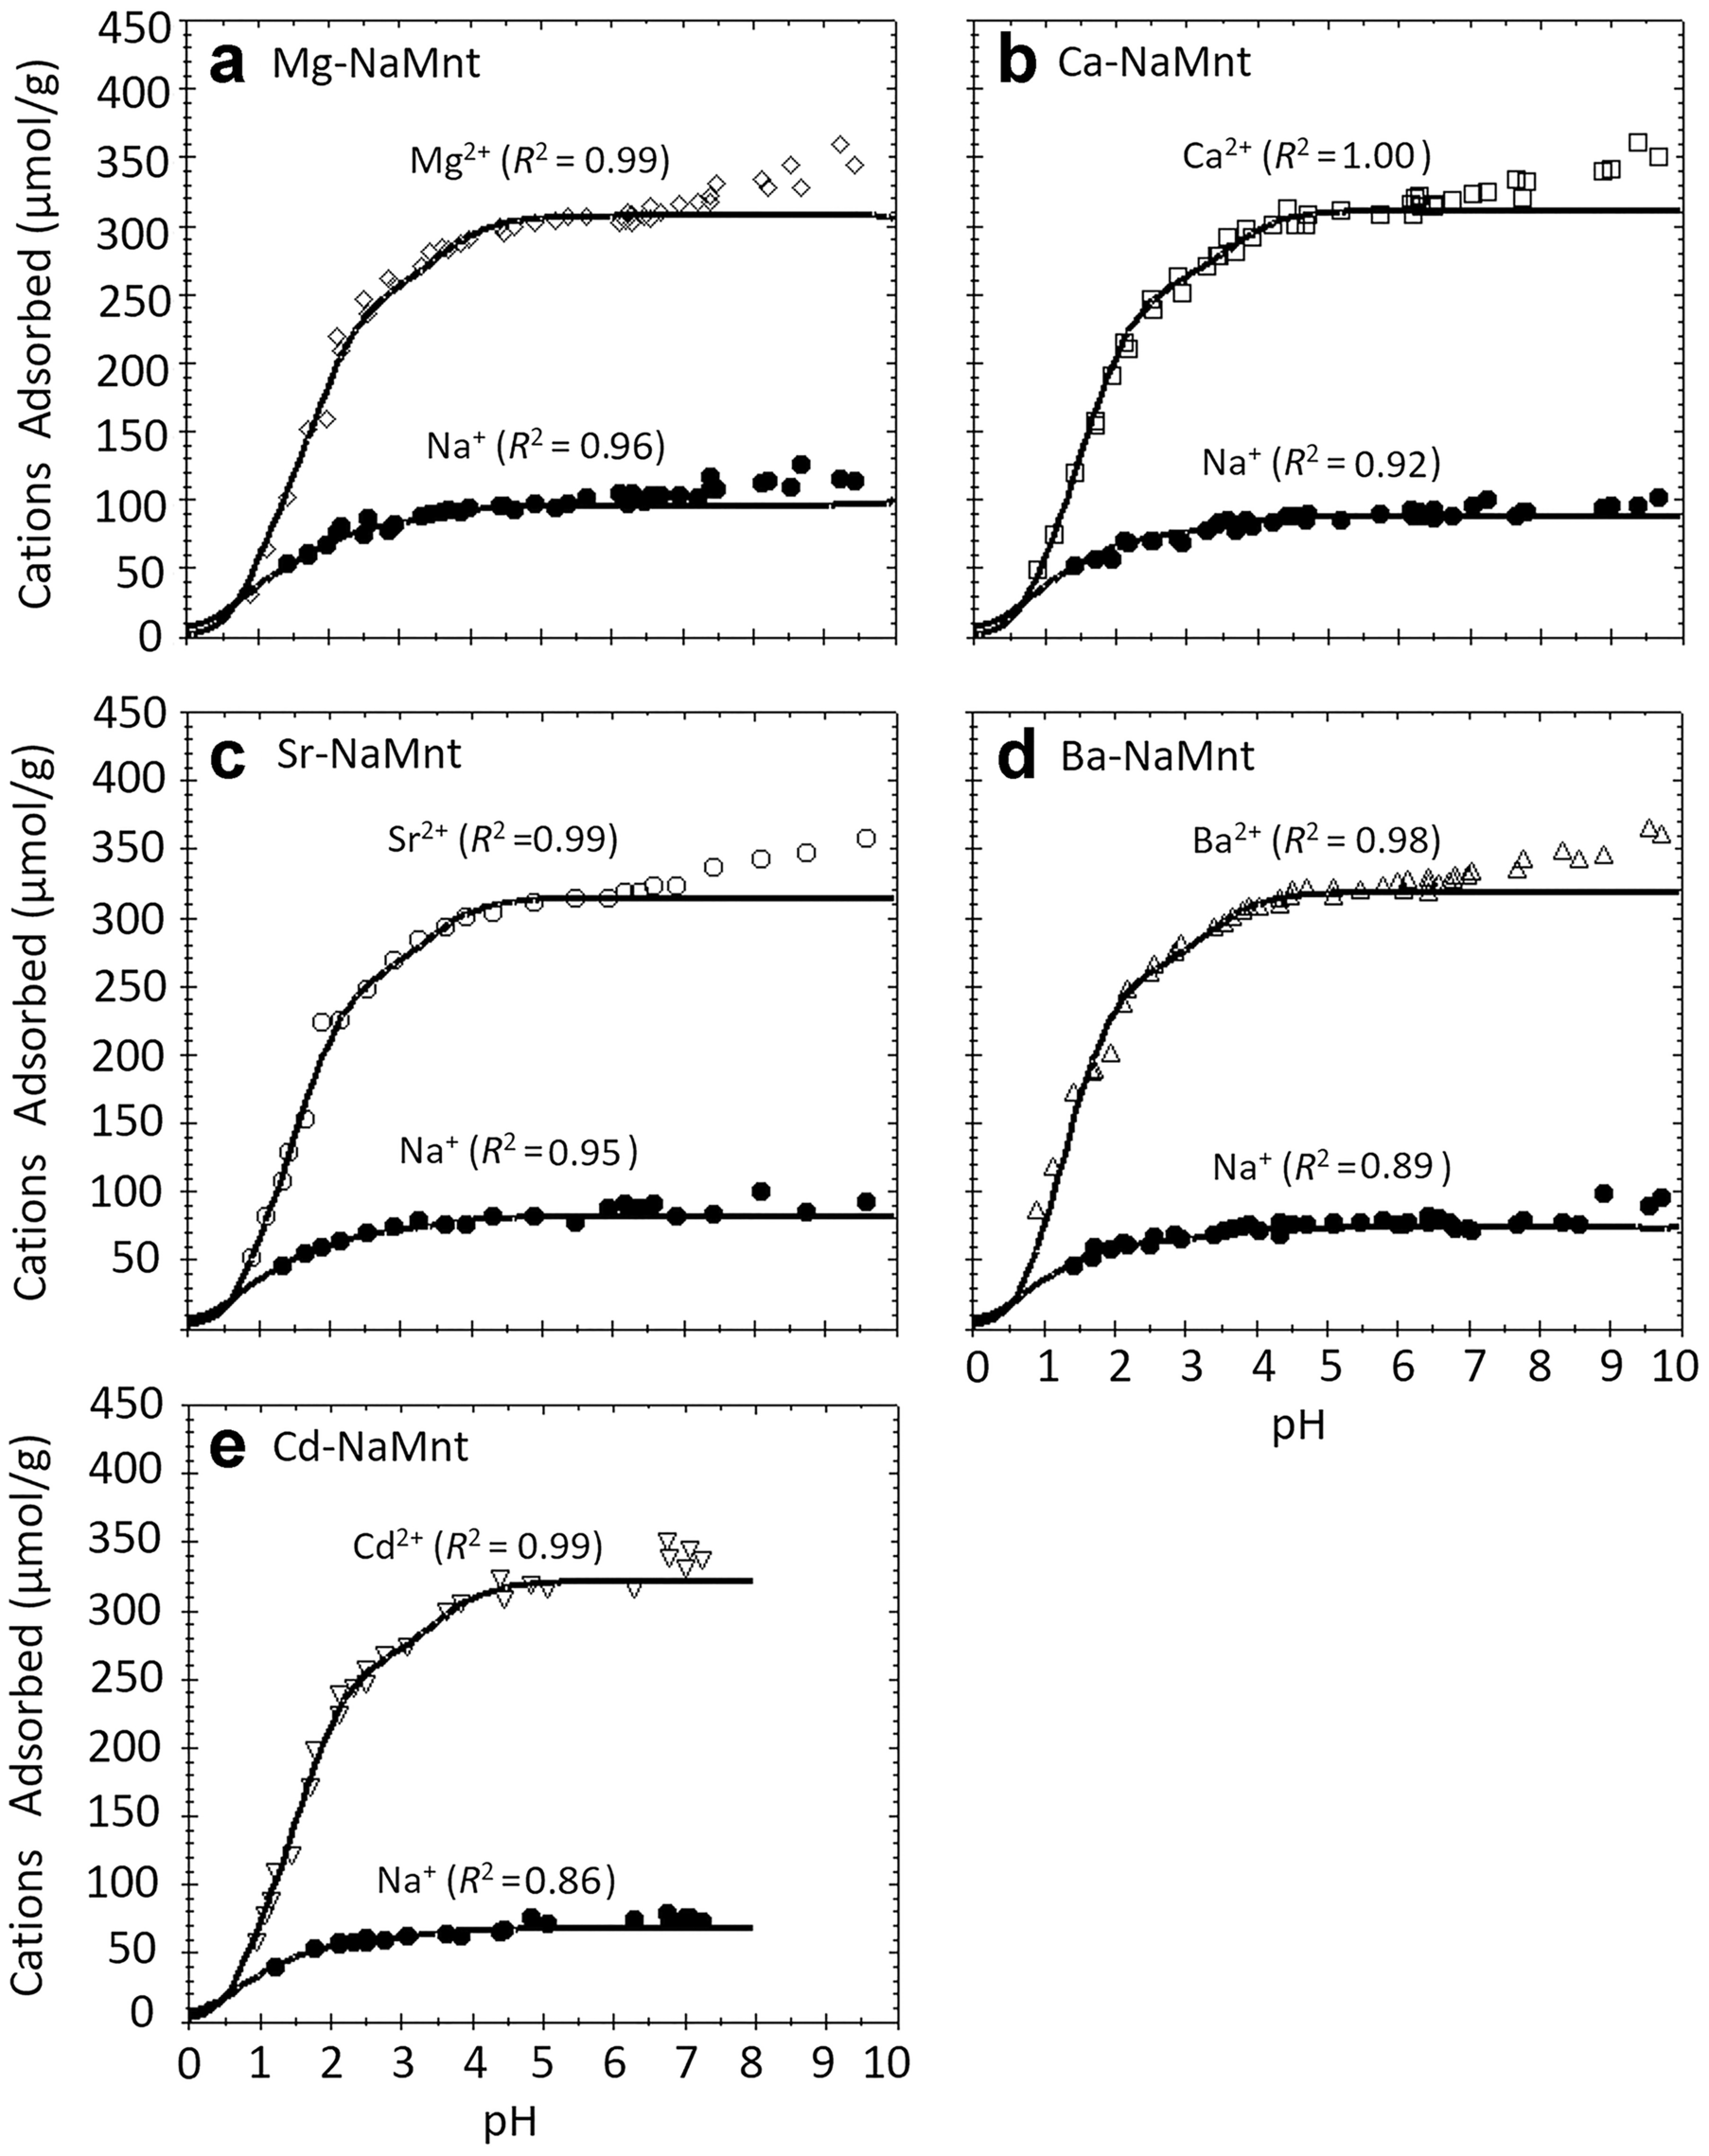
In the adsorption study of monovalent alkali cations, the maximum amount of cations adsorbed on NaMnt was 710 μmol/g (Li and Schulthess Reference Li and Schulthess2020). The same value was observed in the adsorption of divalent cations around pH 6 in the present study (Fig. 1). The amount of cations adsorbed remained constant in the study of monovalent alkali cations when the pH was >6, however, but continued to increase with increasing pH in Fig. 1. The difference in the adsorption behavior at high pH will be discussed further in the next section. For now, this section focuses on cation adsorption at pH < 6 using an ion-exchange model that is similar to that developed by Li and Schulthess (Reference Li and Schulthess2020). The probabilities of different octahedral cation distributions in NaMnt were ~43, ~43, and ~14%. Accordingly, the CEC of three interlayer sites (S a , S b , and S c ) were calculated as 305, 305, and 100 μmol/g with 710 μmol/g as the total CEC of NaMnt. The H+ cation was considered to be the reference cation for the presentation of all cation adsorption equilibrium constants due to its prevalence in aqueous ion-exchange reactions. Accordingly, the M 2+-H+-Na+ competitive ion-exchange reactions on site S i (i=a, b, or c) were:


where M 2+ was the Cd2+, Mg2+, Ca2+, Sr2+, or Ba2+ divalent cation. The corresponding equilibrium constants were defined as products over reactants:


where { } represents the concentration of adsorbed cations on the solid surface, and ( ) represents the aqueous ionic activities. The known adsorption maximum (Γmax) for each site was equal to the sum of adsorbed H+, Na+, and divalent cations:
The sum of equivalent charge of adsorbed cations on NaMnt for various conditions. The largest error was ±6.95 µmol/g


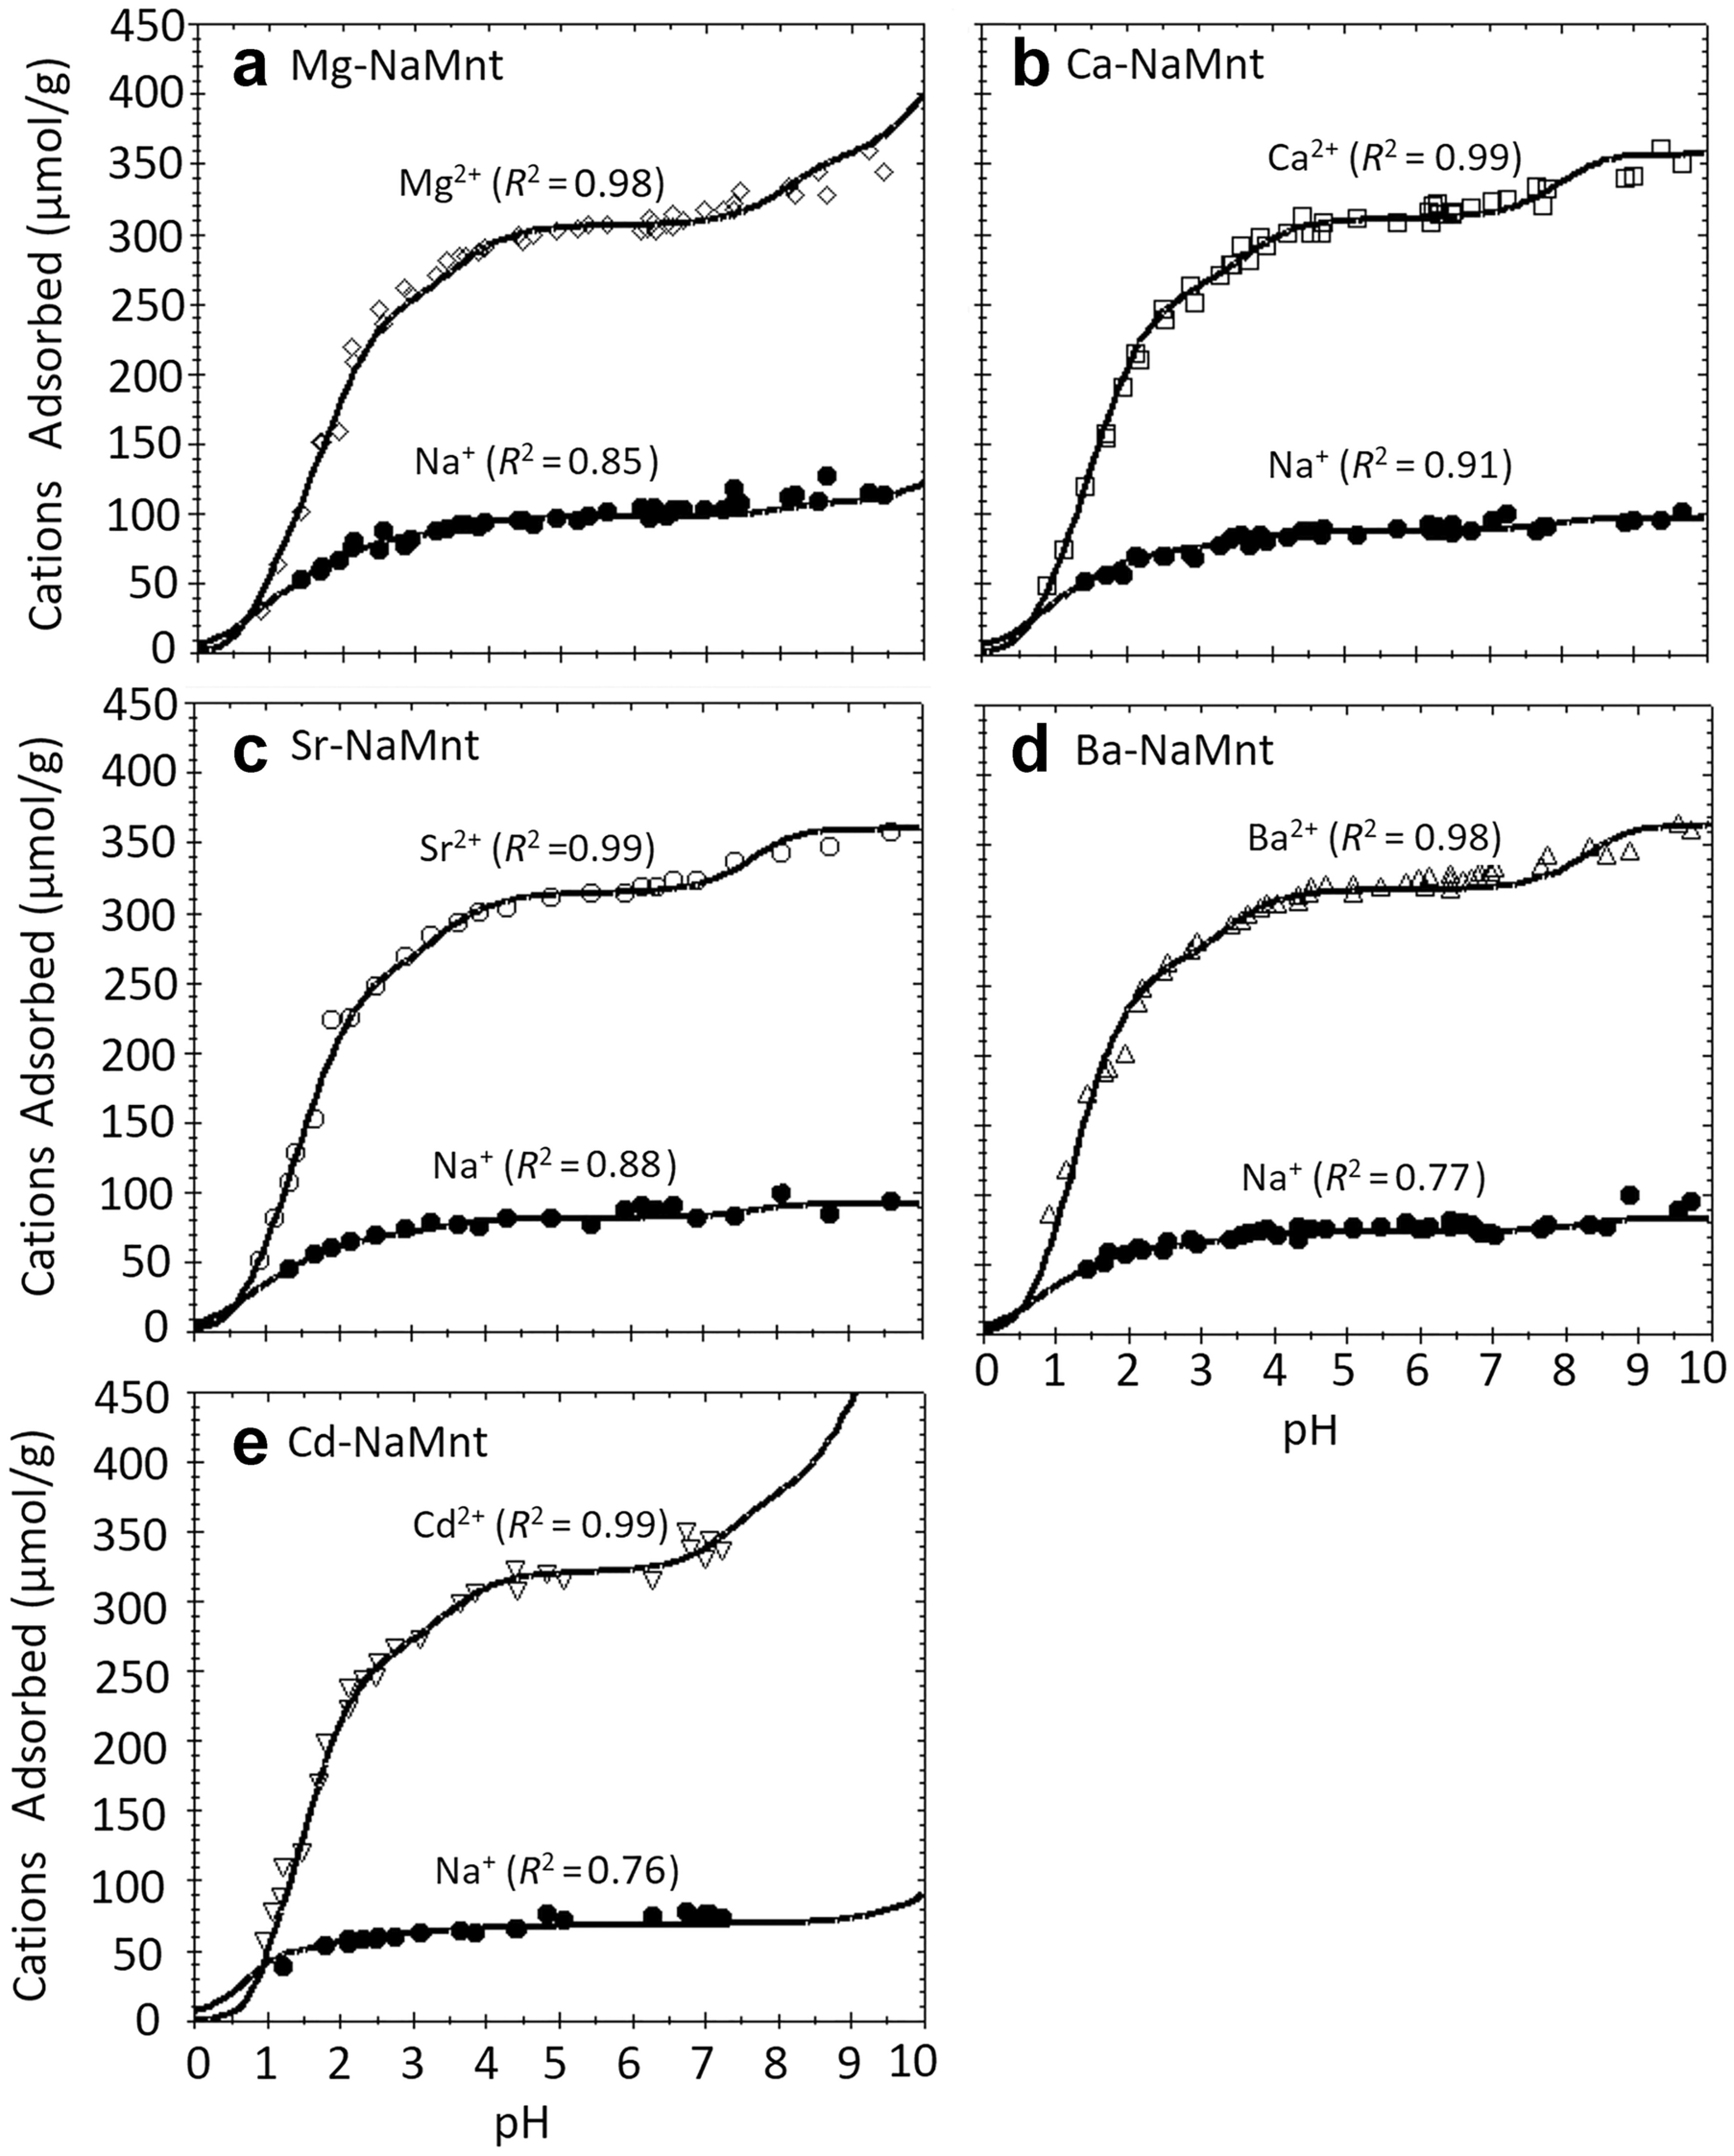
The equilibrium constants for each cation are a result of the chemical energy in two environments: (1) the hydration energy in the liquid phase, which is relatively constant in the bulk solution, but may vary in the interlayer (referred to as the subaqueous interlayer phase by Teppen and Miller Reference Teppen and Miller2006); and (2) the adsorption energy of the surface sites. If all possible ion–ion interactions are relatively constant in the interlayer region, then the cation equilibrium constants (or adsorption strength) should be consistent for each specific mineral and cation. The negative logarithm of adsorption strength (pK) of Na+ on each site of NaMnt was, therefore, kept the same as the values from the previous study of alkali cation adsorption on NaMnt (Li and Schulthess Reference Li and Schulthess2020). This assumption is discussed further in the XRD analysis section below. The only unknown parameters were the K constants for the adsorption of divalent cations (M 2+) on the three interlayer sites (S a , S b , and S c in Table 3a) on NaMnt, which were optimized based on the curve fit of the experimental adsorption envelopes. The optimization results showed that the three-site ion-exchange model was able to simulate the cation adsorption data very well for all cation adsorption envelope data below pH 6 (Fig. 2).
The adsorption maxima (Γmax) and negative logarithm of equilibrium constants (pK) of three sites optimized with the strict ion-exchange model for a non-hydrolyzed and b hydrolyzed cations. The initial conditions of ion-exchange reactions are shown in Table 2. The term “est” indicates that the pK values were estimated. The asterisk (*) denotes that these cations are defined according to Eq. 8

Cation adsorption of a Mg2+, b Ca2+, c Sr2+, d Ba2+, or e Cd2+ on NaMnt as a function of pH. The initial conditions are shown in Table 2. Lines represent predicted adsorption data using the ion-exchange model. The CEC of each site and cation adsorption strength values are shown in Table 3a. The goodness-of-fit is Efron’s pseudo-R 2 for pH < 6 data. The largest error was ±5.03 µmol/g for Na+ and ±3.47 µmol/g for divalent cations

The divalent cations can form MCl+ complexes in a Cl-rich medium. Several studies have confirmed the adsorption of MCl+ ion pairs in the interlayer of Mnt. For example, the coexistence of Cd2+ and CdCl+ in the interlayers of Mnt (Cornwall, UK) equilibrated with high concentrations (>0.2 N) of CdCl2 solutions was revealed by Di Leo and Cuadros (Reference Di Leo and Cuadros2003) using nuclear magnetic resonance. Using XRD and 77 K Mössbauer spectroscopy analysis in cation exchange experiments on MX-80 Mnt, Tournassat et al. (Reference Tournassat, Ferrage, Poinsignon and Charlet2004a, Reference Tournassat, Greneche, Tisserand and Charlet2004b) concluded that CaCl+ participated in ion-exchange reactions when the CaCl2 concentrations were 6.8 and 50 mM, and the clay contents were 3.03 and 1.53 g/L, respectively. Using an XRD profile modeling approach, the existence of MgCl+, CaCl+, or SrCl+ ion pairs in the interlayer of divalent cation-saturated SWy-2 Mnt with large metal-Cl+ concentrations of 1 M was suggested by Ferrage et al. (Reference Ferrage, Tournassat, Rinnert, Charlet and Lanson2005b). Cation adsorption isotherm data on MX-80 Mnt were predicted, including FeCl+, CaCl+, and MgCl+ cations by Charlet and Tournassat (Reference Charlet and Tournassat2005) in their ion-exchange model using a total Cl– concentration of 49–132 mM and a pH range of 2.17–3.59. Accordingly, surface adsorption reactions for these Cl-complexes are expressed here as:

and the corresponding equilibrium constants were defined as products over reactants:

The retention data of Cl– ions or MCl+, which are needed to obtain their corresponding adsorption pK values, are missing. In the absence of data for optimizing the
 values, the
 values were combined with the
 values, where the cation concentrations are expressed as:

and the
 values were redefined in Eq. 4 in terms of *M
2+ rather than M
2+; therefore, MCl+ was not considered explicitly in the present study. The pK values in Table 3 are a composite of the adsorption of complexed MCl+ and non-complexed M
2+ species. Simulations that optimized the
 values while keeping the
 fixed at low values (equivalent to the K values of Na+) resulted in slightly improved predictions. Simulations which optimized the
 values while keeping the
 fixed at high values (about half of the
 values of M
2+) resulted in very poor retention predictions, however (data not shown). Thus, the retention strength of monovalent MCl+ cations can be assumed to be much weaker than that of divalent M
2+, and the amount retained was very small at pH > 2 where the concentrations of Cl– anions were lower.
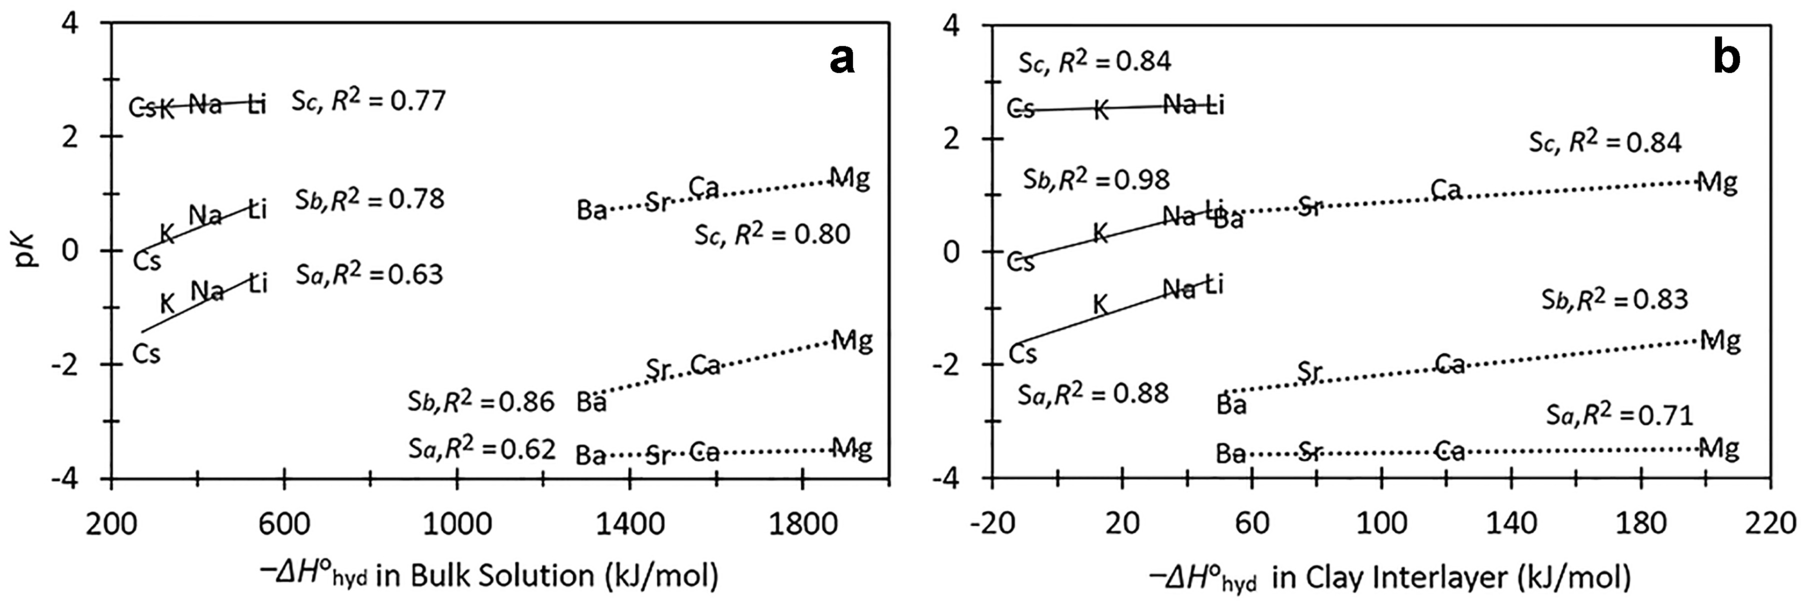
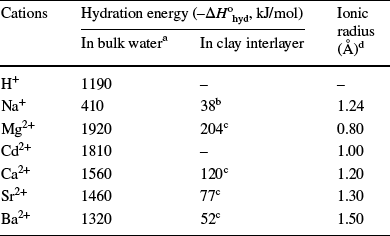
The equilibrium constant pK values increased with sites S a < S b < S c (Table 3a), which suggested that the cation adsorption strength relative to H+ decreased in the order S a > S b > S c . The same cation-adsorption strength sequence of these three interlayer sites was also obtained from the adsorption studies of alkali cations on NaMnt (Li and Schulthess Reference Li and Schulthess2020). The pK values of divalent cations were smaller (or more negative) than those for the Na+ cation, which meant that the cation adsorption strengths of divalent cations were stronger than for the Na+ cation on Mnt. Greater cation-adsorption strength of divalent cations was also observed by Laudelout et al. (Reference Laudelout, Van Bladel, Bolt and Page1968) and Berghout et al. (Reference Berghout, Tunega and Zaoui2010), who attributed the difference to the stronger Coulombic attraction of divalent cations on the clay minerals. The pK values of divalent cations decreased roughly in the order Mg2+ > Cd2+ > Ca2+ > Sr2+ > Ba2+, particularly for sites S b and S c , which meant that the adsorption strength increased in the opposite order. A calorimetric adsorption enthalpy study of NH4 +-M 2+ exchange reactions on Mnt showed the same cation adsorption strength sequence: Mg2+ > Ca2+ > Sr2+ > Ba2+ (Laudelout et al. Reference Laudelout, Van Bladel, Bolt and Page1968). The pK values reflect the affinity of cations toward the clay surface sites relative to their affinity for forming hydrated species in the interlayer liquid phase. Moderate to strong linear correlation between pK values and the hydration energy were found for both monovalent alkali and divalent alkaline earth cations (Fig. 3). Using computational molecular mechanics, the adsorption selectivity of isovalent cations was found by Teppen and Miller (20006) to be controlled by their hydration energy. The weaker the hydration energy (lower –ΔH ohyd in Table 4), the easier it is for the cations to dehydrate in the interlayer space and adsorb strongly on the clay surface.
The relation between negative logarithm of adsorption strength (pK) for monovalent alkali M + and divalent alkaline M 2+ cations with their hydration energies (–ΔH ohyd) in the a bulk solution and b clay interlayer. The pK values of monovalent alkali cations were from Li and Schulthess (Reference Li and Schulthess2020). The hydration energy of cations in the bulk solution come from Smith (Reference Smith1977). The hydration energy of cations in the interlayer come from Salles et al. (Reference Salles, Bildstein, Douillard, Jullien and Van Damme2007, Reference Salles, Douillard, Bildstein, Gaudin, Prelot, Zajac and Van Damme2013)

Hydration energy and ionic radii of cations in this study

a Smith (Reference Smith1977), b Salles et al. (Reference Salles, Bildstein, Douillard, Jullien and Van Damme2007), c Salles et al. (Reference Salles, Douillard, Bildstein, Gaudin, Prelot, Zajac and Van Damme2013), d Schulthess (Reference Schulthess2005)
Very few studies compared directly the adsorption strength of Cd2+ with alkaline earth cations, and discrepancies exist in the published studies on their adsorption strengths. Following a comprehensive literature review of published ion-exchange data on smectite, the equilibrium constants of divalent cations on Camp Berteau Mnt were compared by Benson (Reference Benson1980) using a one-site ion-exchange model, and showed that the cation adsorption strength relative to H+ decreased in the order Cd2+ > Ba2+ > Ca2+ > Sr2+ > Mg2+, but in the order Cd2+ > Ba2+ > Mg2+ > Ca2+ > Sr2+ relative to Na+, both of which were different from what was observed in the current study. The discrepancies proposed by Benson (Reference Benson1980) in the cation adsorption equilibrium constants were due to the differences in laboratory procedures and composition of the clay samples. The models proposed here, however, will also influence heavily the resultant selectivity constants. For example, the cation adsorption affinity to the Na-Mnt surface was shown by Farrah et al. (Reference Farrah, Hatton and Pickering1980) to follow the order Cd2+ > Mg2+ > Ca2+ based on the Langmuir constants, but in the order Ca2+ > Mg2+ > Cd2+ using the competitive Langmuir equation. In the present study, the adsorption strength of Cd2+ was found to be between those of Mg2+ and Ca2+, and this sequence is consistent with the hydration energies of these cations.
Modeling High-pH Data
The predicted cation adsorption stayed constant above pH 6, but the experimental cation adsorption data continued to increase (Figs 1 and 2). Blank runs indicated significant precipitation above the pH range of the data shown in the figures, but very little precipitation of these cations in the pH range shown (<2.3% for Cd; <1.7% for Sr; <1.4% for Ba, Ca, and Mg). Adsorption modeling of cations at high pH generally includes metal hydroxide complexes in surface complexation reactions on the edge sites of clay minerals (Bradbury and Baeyens Reference Bradbury and Baeyens2005; Fernandes and Baeyens Reference Fernandes and Baeyens2019). These metal hydroxide complexation models indicate that the MOH+ species exist at high pH and should be able to adsorb strongly, although Ferrage et al. (Reference Ferrage, Tournassat, Rinnert and Lanson2005c) were unable to confirm the presence of these species using XRD profile modeling and near infrared spectroscopy. In the literature, the relative percentage of edge sites varied for different types of Mnt. Using potentiometric titration data curve fitting, the edge sites were estimated by Bradbury and Baeyens (Reference Bradbury and Baeyens2005) and Fernandes and Baeyens (Reference Fernandes and Baeyens2019) to be 8.6% of the total adsorption capacity of SWy-1 Mnt, by Missana and García-Gutiérrez (Reference Missana and García-Gutiérrez2007) to be 6% for FEBEX bentonite (Spain), and by Gu et al. (Reference Gu, Evans and Barabash2010) to be 22.3% for Mnt (Upton, Wyoming, USA). Based on curve fitting of adsorption data and an assumed adsorption model, edge sites were estimated by Barbier et al. (Reference Barbier, Duc and Petit-Ramel2000) to account for 12.4% of total adsorption capacity for SWy-2 Mnt, and by Yu et al. (Reference Yu, Mei, Chen, Tan, Ahmad, Alsaedi, Hayat and Wang2015) for 5.6% for Mnt (Zhejiang, China). In general, the estimation of edge sites depends on curve fitting and their corresponding model assumptions. Accurate model fitting does not necessarily verify that the proposed model is correct and truthful. The near coincidence of the percentage of the edge sites on Mnt with the percentage of site S c gives one pause to reconsider the proposed model assumptions.
Much smaller values for the edge sites are obtained with more direct measurement techniques. Using the Brunauer-Emmett-Teller method for external surface area and the ethylene glycol monoethyl ether method for total surface area analysis of SWy-1 Mnt clay, the edge sites were estimated by Schulthess and Huang (Reference Schulthess and Huang1990) to account for <3% of the total surface area. Using low-pressure gas adsorption and atomic force microscopy, the edge sites were estimated by Tournassat et al. (Reference Tournassat, Neaman, Villiéras, Bosbach and Charlet2003) to account for 1.1% of the total surface area of MX-80 Mnt. The measured edge site density was close to 10–15% from curve-fitting exercises after adjusting the measured value with a perimeter-to-area ratio of the clay according to Tournassat et al. (Reference Tournassat, Neaman, Villiéras, Bosbach and Charlet2003). Unclear, however, is whether this correction ratio is needed or whether the curve-fitted values are correct because that 14% of the adsorption site density can be modeled perfectly well without any contribution from the edge sites, as described below.
Some retention of cations on edge sites is likely, and its relative significance may be influenced by the particle size (Dzene et al. Reference Dzene, Ferrage, Hubert, Delville and Tertre2016). The tactoid size resulting from various interlayer cations is also believed to influence the relative retention of cations on external basal sites and interlayer sites (Tournassat et al. Reference Tournassat, Bizi, Braibant and Crouzet2011). The particle size of SWy-1 smectite showed a bimodal distribution of diameters with maxima at 300 and 1260 nm (Poli et al. Reference Poli, Batista, Schmitt, Gessner and Neumann2008), and this size range suggests a significant role of the edge sites according to Dzene et al. (Reference Dzene, Ferrage, Hubert, Delville and Tertre2016). When comparing two similar adsorption sites that reside in two environments, the adsorption strength will be much greater in the constrained environment than the non-constrained environment. This was illustrated with the retention of various cations in zeolite minerals of various pore sizes, and the phenomenon was described as the Nanopore Inner Sphere Enhancement (NISE) Effect (Schulthess et al. Reference Schulthess, Taylor and Ferreira2011). The Cs+ cation was adsorbed more strongly in the interlayer sites of vermiculite than in the external (edge and basal) sites based on cation adsorption and desorption experiments (Dzene et al. Reference Dzene, Ferrage, Hubert, Delville and Tertre2016). Accordingly, the edge sites and external basal sites were not considered in the present study due to their lower CEC and weaker cation adsorption strength.
In the present study, the metal hydroxides (MOH+) at high pH were proposed to adsorb on the clay interlayer sites via ion-exchange reactions rather than on the edge sites. Two pathways are possible for the retention of MOH+: (1) the cations first hydrolyze in the liquid phase and then adsorb on the clay surface; or (2) the cations first adsorb on the clay surface and then hydrolyze while adsorbed.
For the first pathway, the sum of Eqs. 9 and 10 results in Eq. 11


Under this pathway, the MOH+ should be able to adsorb onto the strongest sites, namely S a , followed by S b , and lastly S c . Significant formation of MOH+ in the liquid phase did not occur until much higher pH values (~pH 11), which means that the presence of MOH+ ions near the clay surface were too few and too short lived for their adsorption to occur at lower pH values (~pH 7).
For the second pathway, the sum of Eqs 12 and 13 results in the same Eq. 14:


Under this pathway, the hydrolysis of adsorbed M 2+ on surface sites is favored at lower pH (~pH 7) because the change in the total Gibbs free energy for hydrolysis is favored when the mobility of the ions is reduced. That is, the mobility of the M 2+ cation is reduced while adsorbed (Salles et al. Reference Salles, Douillard, Bildstein, Gaudin, Prelot, Zajac and Van Damme2013). This pathway is similar to pathways in surface catalysis. Reactions in surface catalysis are increased because: (1) concentrations of reagents increase in the surface phase; and (2) the activation energy barrier of one or more of the reagents is reduced because of the presence of the surface active sites (Fripiat and Van Damme Reference Fripiat and Van Damme1983). The M 2+ cation was strongly adsorbed onto sites S a and S b , and weakly adsorbed on site S c (Table 3a). While significantly immobilized, the weaker adsorption of M 2+ on S c allows it to interact more easily and hydrolyze with the nearby H2O molecules. Borrowing from gas-phase catalysis studies, the reactivity between species appears to be controlled primarily by adsorption energies (Montemore et al. Reference Montemore, van Spronsen, Madix and Friend2017). For example, in Pt surface catalysis of O atoms with CO to form CO2, the O atoms that were more reactive with the other substances present were those that were held loosely compared to the tightly held O atoms (Van Spronsen et al. Reference Van Spronsen, Frenken and Groot2017). Similarly, this proposed second pathway is preferred for S c over S b or S a , and it is the assumed pathway in our model described below.
Equation 11 was added to the previous three-site ion-exchange model, where the equilibrium constants were defined as products over reactants:

The adsorption maximum (Γmax) for each site was the same as Table 3, which equals the sum of adsorbed H+, Na+, and divalent cations:

All the model parameters were kept the same. The only unknown parameters were the K constants for Eq. 15, which were optimized based on the least squares of error using IExFit software. The optimization of the pK values showed that the three-site ion-exchange model was able to describe all the cation adsorption envelope data very well (Fig. 4). The model fit in Fig. 4 supported the hypothesis that adsorption occurred on sites S c via the proposed second pathway, while a model based on the first pathway on sites S a and S b greatly overestimated the amount adsorbed at ~pH 7–8 (simulation not shown). Due to the lack of adsorption data at very high pH values, the pK values for the adsorption of MOH+ on site S a and S b were estimated.

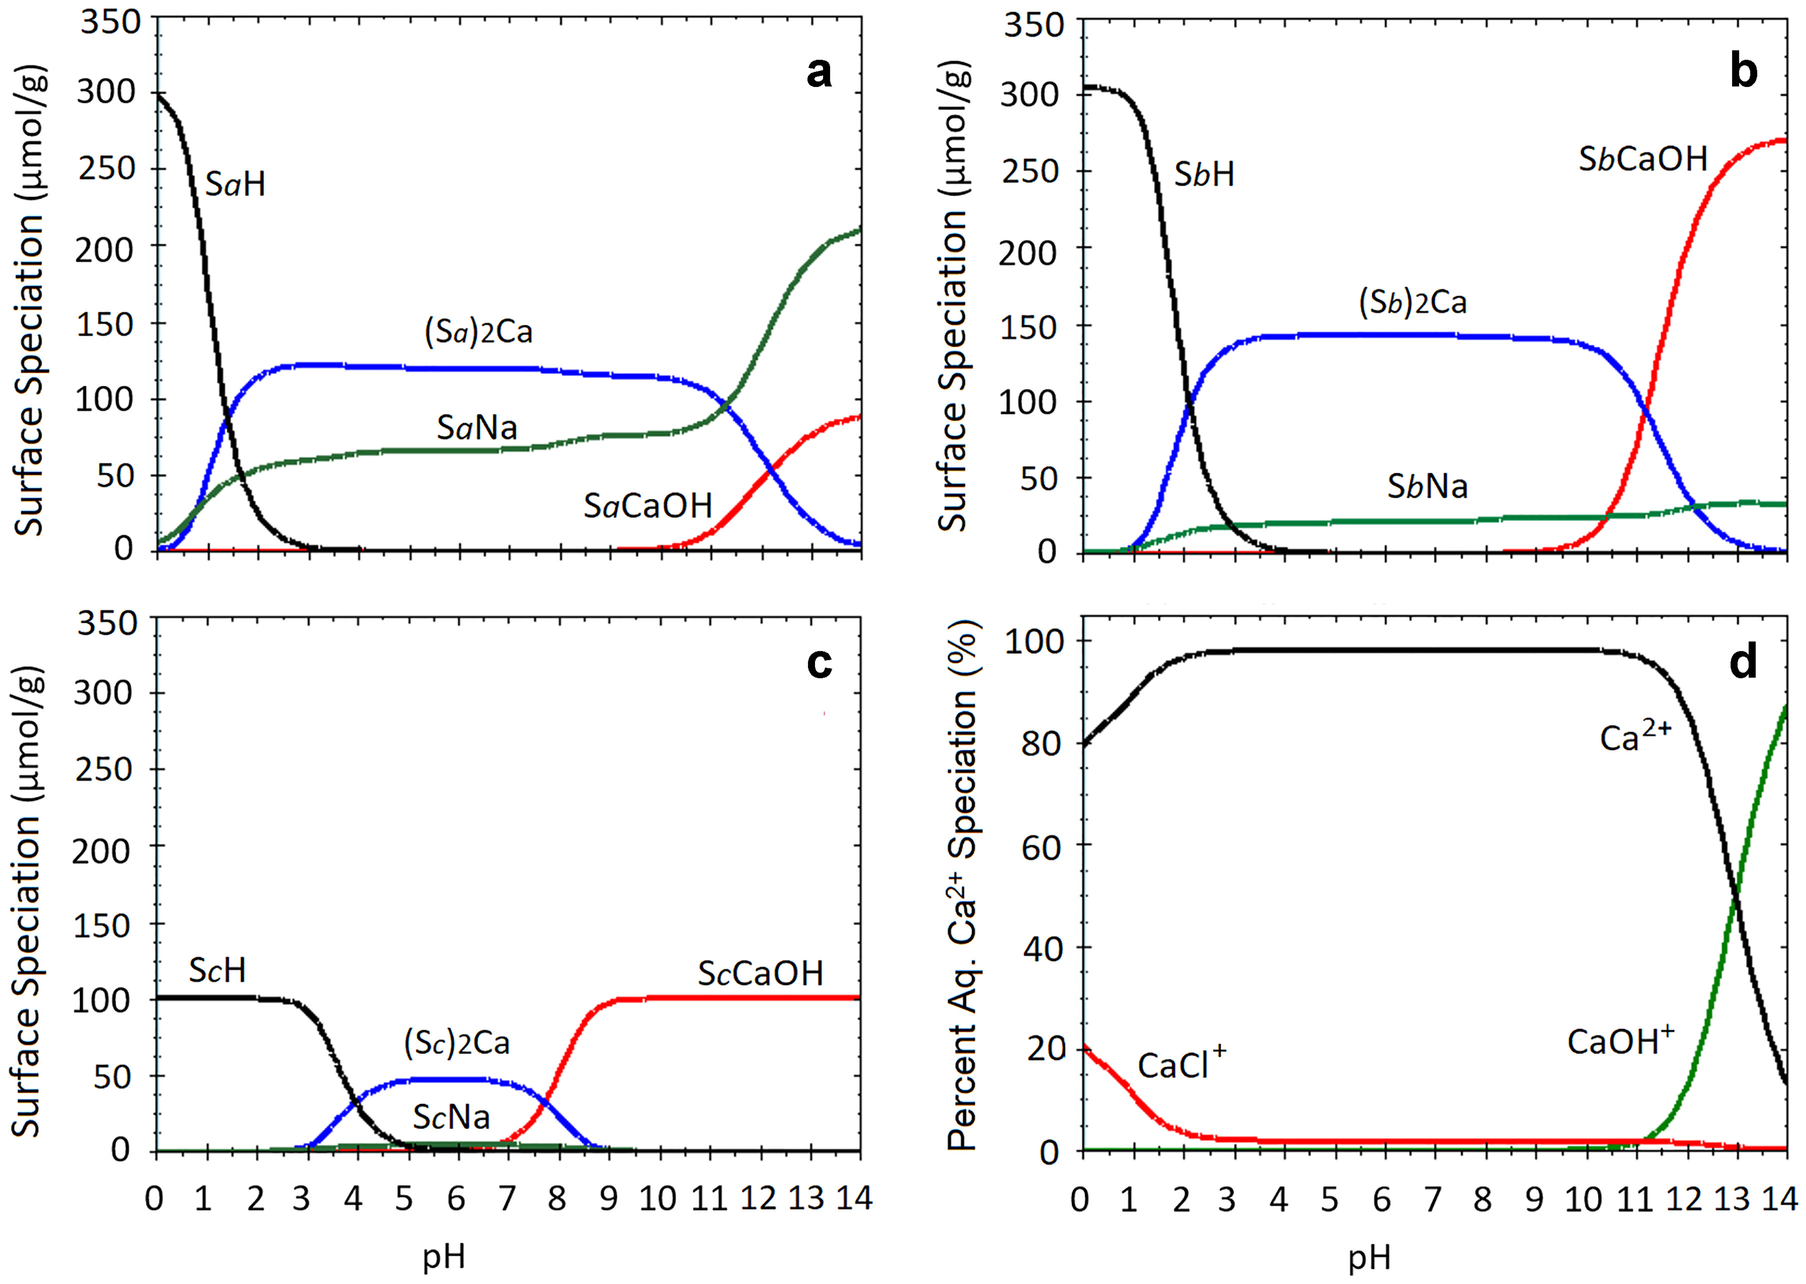
Using Ca2+ as an example, the surface cation speciation on Mnt is shown in Fig. 5. The Na+ (S i Na) adsorbed on sites S a and S b continued to increase with pH. On site S c , S c Na decreased at pH 6.5, and dropped to almost zero at ~pH 9. The amount of Na+ adsorbed on three sites followed the order: S a > S b > S c . The amount of divalent Ca2+ cation adsorbed increased with pH at low pH (<3), decreased slowly as pH increased, and finally, decreased rapidly at high pH (>9). The site S a had a larger pH range for Ca2+ adsorption than S b and S c . When the monovalent CaOH+ cation adsorbed increased at ~pH 11, 10, and 7 on sites S a , S b , and S c , respectively, the amount of divalent Ca2+ cation adsorbed started to decrease. The CaOH+ was predominantly adsorbed on site S c when the pH was <10.
Model simulation of surface cation speciation on sites a S a , b S b , and c S c on NaMnt, and d Ca2+ aqueous speciation on NaMnt from Fig. 4b

Implication and Confirmation of the Ion-Exchange Model
Note that this new approach of describing adsorption data at high pH also predicted an increase in Na+ retention at ~pH 9 (Figs 4 and 5). Published Na+ adsorption envelope data typically show increased Na+ adsorption at high pH (Nolin, Reference Nolin1997; Motellier et al. Reference Motellier, Ly, Gorgeon, Charles, Hainos, Meier and Page2003; Jacquier et al. Reference Jacquier, Ly and Beaucaire2004). Whereas models can be proposed that describe the retention of Na+ cations at high pH using new adsorption sites, the alternative model proposed here suggested the retention of Na+ cations on existing interlayer sites with hydrolyzed divalent cations. The predicted increase in Na+ adsorption at pH 8–10 is due to the retention of CaOH+ species on site S c , which resulted in a net reduction of Ca2+ competition on Na+ adsorption. Very few published articles have explored the inclusion of CaOH+ in their models as a viable adsorbing species, and they generally involve both interlayer and edge sites. A surface complexation model involving an ion-exchange reaction between SrOH+ and H+ to predict the cation adsorption data on MX-80 Wyoming bentonite was developed by Molera et al. (Reference Molera, Eriksen and Wold2002). The ion-exchange reaction between CaOH+ and Na+ in two different types of models were used by Tournassat et al. (Reference Tournassat, Ferrage, Poinsignon and Charlet2004a) to predict the cation adsorption data on the MX-80 Mnt. The model proposed in Table 3 here is a significant alternative to the introduction of a new adsorption edge site.
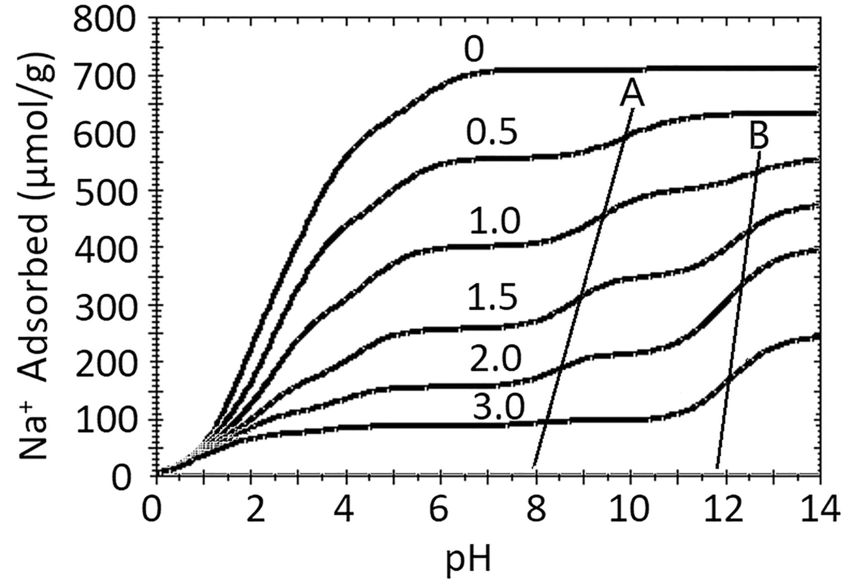
When there was no Ca2+ present, the predicted Na+ adsorption remained almost constant at high pH (Fig. 6), which was confirmed by Li and Schulthess (Reference Li and Schulthess2020). With 0.5 mmol/L Ca2+ added, the predicted Na+ adsorption curve showed a new edge at ~pH 10 (labeled ‘A’ in Fig. 6). With 1 mmol/L Ca2+ added, another new adsorption edge appeared at ~pH 13 (labeled ‘B’). As the Ca2+ concentration increased, the two new adsorption edges shifted to lower pH ranges, and were most prominent at Ca2+ concentrations of 1–2 mmol/L for these initial Na+ concentrations. The predicted increase in Na+ retention at high pH almost disappeared when the Ca2+ concentration reached 3 mmol/L (Fig. 6), confirmed in Fig. 4b.
Predicted Na+ adsorption on Mnt with various levels of Ca impurities (mmol/L) using the ion-exchange model and model parameters shown in Table 3. The total Na+ was 5.44 mmol/L, and the clay concentration was 6.46 g/L. Lines A and B show the positions of the new adsorption edges on the Na+ adsorption curves

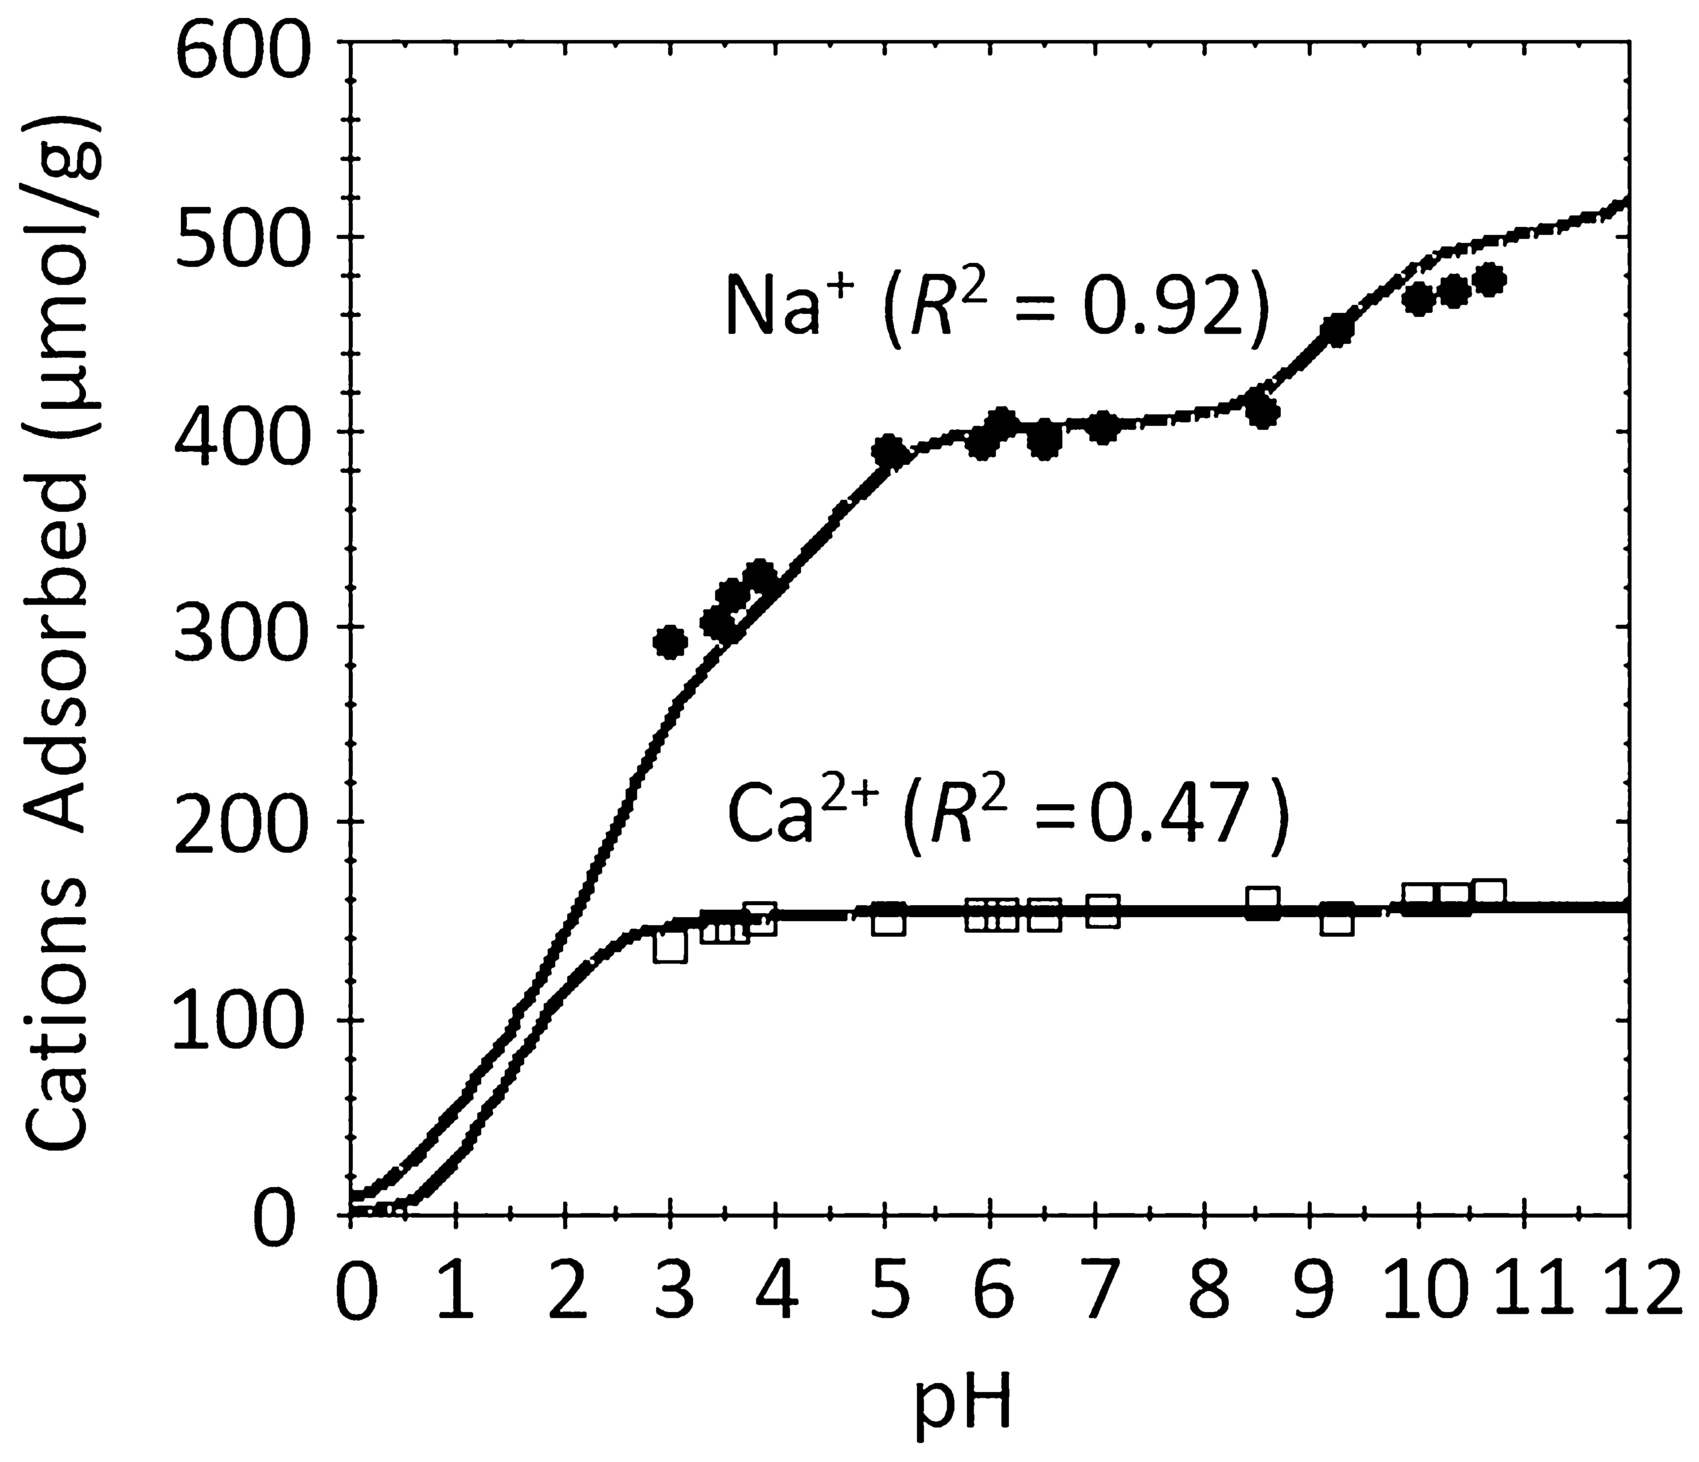
In order to examine better the influence of Ca2+ on Na+ adsorption using this model, a cation adsorption experiment on NaMnt was conducted as a function of pH with 1 mmol/L Ca2+ added (Fig. 7). The ion-exchange model and model parameters in Table 3 predicted the Na+ and Ca2+ adsorption very well. A new edge appeared at ~pH 9 in the Na+ adsorption curve which was not readily apparent at higher Ca2+ concentrations or in the absence of Ca2+ cations, but was consistent with the predictions in Fig. 6.
Predicted Ca2+ and Na+ adsorption on Mnt using ion-exchange model. Model parameters are shown in Table 3. The total Ca2+ and Na+ were 1.00 and 6.44 mmol/L, respectively. The clay concentration was 6.46 g/L. The largest error was ±5.98 µmol/g for Na+ and ±1.32 µmol/g for Ca2+

Whereas site S c plays a significant role in the retention of MOH+ cations (Figs 5 and 6), no clear proof of the role of sites S a and S b was shown in the present study. The estimated pK values of CaOH+ adsorption on sites S a and S b were 10 (Table 3b), but these values were quite arbitrary. A reasonable assumption is that if aqueous CaOH+ is naturally present at high pH values (Fig. 5d), then a strong possibility exists that this species will remain stable long enough to react with sites S a and S b . That is, the reaction would follow pathway 1 described above with Eqs. 9 and 10. Accordingly, setting the pK values to 10 for the CaOH+ adsorption on sites S a and S b resulted in the formation of S a CaOH and S b CaOH species at nearly the same pH range (Fig. 5a, b) as the formation of CaOH+ species in the liquid phase (Fig. 5d). Similar reasoning was applied for estimating the pK values of the other divalent cations on sites S a and S b .
In the pH-dependent Na+ adsorption data as a function of Ca2+ concentrations, a 4- or 5-site model (including interlayer sites and edge site) could be proposed easily based on the multiple adsorption edges in the adsorption envelope curves (Fig. 7). This confirmed that the model assumptions can have many consequences for understanding how and why the clay behaves the way it does. Traditionally, proposed models have been supported predominantly by curve-fitting adsorption data, where the number of sites is based on the number of edges in adsorption envelopes or the number of linear regression curves of adsorption isotherms (Nolin Reference Nolin1997; Motellier et al. Reference Motellier, Ly, Gorgeon, Charles, Hainos, Meier and Page2003; Missana et al. Reference Missana, Benedicto, García-Gutiérrez and Alonso2014; Robin et al. Reference Robin, Tertre, Beaufort, Regnault, Sardini and Descostes2015). The present study, however, showed that new edges in the adsorption envelope curve do not necessarily correspond to reactions on new adsorption sites on the clay surface. Instead, the new edges indicate possible new reactions on the existing adsorption sites. Specifically, the adsorption of metal hydroxide does not necessarily need to be on the clay’s edge sites, but instead could be a competitive ion-exchange reaction on the interlayer sites.
In the current study, the number of adsorption sites and relative percentage of each site were based on probabilities of the distances between octahedral Fe3+ and Mg2+ cations in a presumed Mnt with chemical formula H[Al6MgFe]Si16O40(OH)8, the composition of which is similar to the natural SWy-3 Mnt (Li et al. Reference Li, Schulthess, Co, Sahoo and Alpay2020). These pre-determined parameters help increase the certainty of ion-exchange models. The identification of a number of adsorption sites using DFT simulations can be applied potentially to other 2:1 expansive clay minerals. For example, if the ratio of octahedral Al3+ decreases and the Fe3+:Mg2+ ratio increases, the percentage of octahedral Fe3+ and Mg2+ with shorter distance will increase, the number of sites with weaker adsorption strength (i.e. S c ) will decrease, and the number of sites with stronger adsorption strength (i.e. S a and S b ) will increase. Other substitutions in the clay structure (such as Ti4+ or Mn2+, or tetrahedral substitutions) will also influence the proportion of adsorption sites and resultant cation adsorption strength.
Relationship Between Interlayer Spacing and pK Values
The interlayer cations were retained on Mnt clay surfaces with variable adsorption strength (Table 3). Accordingly, the interlayer cation composition on Mnt changed as a function of pH and total cation concentrations (Fig. 4). The interlayer cation species also impact the interlayer spacing of SWy-1 samples under controlled relative humidity (Ferrage et al. Reference Ferrage, Lanson, Sakharov and Drits2005a, Reference Ferrage, Tournassat, Rinnert and Lanson2005c) and water-saturated Wyoming Mnt samples (Norrish and Quirk Reference Norrish and Quirk1954). Thus, the interlayer spacing of Mnt was analyzed to investigate its relationship with the cation adsorption strength.
A key feature of the model proposed in the current study is the constant pK values for the Na+ cation in the presence of various competing cations. This is justified if ion–ion interactions among different types of cations in the interlayer space are minimal. One way to minimize these effects in the interlayer sites is to segregate the adsorbed cations. Using XRD analysis and adsorption isotherm data of Ca-NaMnt (Camp-Berteaux, France), the concept of ‘demixing’ was proposed by Glaeser and Méring (Reference Glaeser and Méring1954), where some interlayer spaces are occupied mainly by Ca2+ ions and others mainly by Na+. Two distinct XRD peaks from bi-ionic Na-Ca Mnt samples (Clay Spur, Wyoming, USA) were observed by Levy and Francis (Reference Levy and Francis1975) when the adsorbed Na+ was 40% and 60%, and those authors suggested that segregation of cations in different layers occurred. After treating a bi-ionic K-Ca Mnt (Camp-Berteaux, France) with alternating wetting and drying cycles, a progressive separation of two phases was observed by Mamy and Gaultier (Reference Mamy and Gaultier1979): an organized phase saturated with K+ cations, and a disorganized phase containing K+-Ca2+ mixtures. After comparing measured and calculated XRD patterns of 11 different types of dioctahedral smectites and two interstratified mica/smectite clays containing various ratios of Ca2+ and Na+ cations (Japan), the Na+ and Ca2+ cations tend to segregate and form Ca-dominant and Na-dominant interlayer structures according to Iwasaki and Watanabe (Reference Iwasaki and Watanabe1988). The demixing of Ca2+ and monovalent ions (Na+, K+, NH4 +) on smectite colloids (extracted from Zook soil, Story County, Iowa, USA) was also suggested by Pils et al. (Reference Pils, Laird and Evangelou2007), based on observed shifts and the presence of multiple XRD peaks. The segregation of ions observed in the present studies suggested that ion–ion interactions are minimal among different types of ions inside the interlayers. This is consistent with Pauling’s rule #5, where the number of different kinds of constituents in a crystal environment tends to be small. This also supports the use of constant pK values in the proposed adsorption model discussed earlier.
X-ray diffraction patterns of the centrifuged Mnt samples from cation adsorption envelopes were analyzed to explore whether the present clay samples also showed signs of cation segregation. The clay samples were analyzed immediately after centrifugation to ensure in situ hydration of the interlayer cations. The water contents of all samples were within a range of 70–78% (equivalent to 2.33–3.55 g of water per g of dry clay sample), which resulted in a variability of 0.2 Å in d 001 values. Note that water retention by clay samples is sensitive to centrifugation speeds (Fehervari et al. Reference Fehervari, Gates, Bouazza and Shackelford2019). Accordingly, the XRD results in the present study are specific to the centrifuge treatments applied.
The Mnt saturated with alkaline earth cations had the same d 001 value of 19.6 Å (Fig. 8). The Mnt saturated with Cd2+, Na+, and H+ showed d 001 values of 22.1, 15.6, and 15.2 Å, respectively. The relative intensity of the d 001 peaks in the XRD patterns of Mnt saturated with divalent cations was ~7 times greater than that of NaMnt and HMnt, and this may be because the NaMnt and HMnt particles do not stack as well as the Mnt saturated with divalent cations. The decrease in the XRD intensities as a function of decrease in clay particle stackings was reported in the literature. The stability of soil smectite colloids by mixing clay-humic complexes (Zook soil from the surface 0–40 cm of a pedon in Story County, Iowa, USA) with various ratios of monovalent cations (Na+, K+, NH4 +) to Ca2+ was suggested by Pils et al. (Reference Pils, Laird and Evangelou2007), who further suggested that the broadening and decrease in the intensity of XRD patterns were consistent with the breakup of large quasicrystals to medium and small quasicrystals and the increased dispersion of quasicrystals. Decreases in XRD peak intensities when SWy-2 Mnt was acid-activated with 0.25 M H2SO4 was observed by Bhattacharyya and Gupta (Reference Bhattacharyya and Gupta2008) who suggested that the decrease in XRD peak intensity implied the dispersion and amorphization of the acid-treated clay compared to the original one. The effect of wet grinding on the mesoporous properties of Mnt (Jilin, China) was studied by Xia et al. (Reference Xia, Jiang, Zhao, Li, Xue, Sun, Liu and Zhang2010) who attributed the decrease in XRD d 001 peak intensities to the disrupted and lost stacking of clay layers due to the wet grinding. Decreases in the XRD d 001 peak intensities of Mnt (Zhejiang, China) after several cycles of freezing/thawing-ultrasonic exfoliation process were observed by Chen et al. (Reference Chen, Yuan, Zhao, Rao and Song2019) who suggested that the degree of order of the lamellar structure of Mnt decreased.
XRD patterns of wet Mnt saturated with Mg2+ (MgMnt), Cd2+ (CdMnt), Ca2+ (CaMnt), Sr2+ (SrMnt), Ba2+ (BaMnt), and Na+ (NaMnt) cations at ~pH 7, and H+ (HMnt) cation at pH < 1. The d 001 values (Å) are also shown

The d 001 values of 15.6 Å for NaMnt are similar to the values in the literature, e.g. a value of 15.2 Å when the Na-saturated SWy-1 Mnt was water-saturated was noted by Chiou and Rutherford (Reference Chiou and Rutherford1997). A value of 15.6 Å was observed by Oueslati et al. (Reference Oueslati, Rhaiem and Amara2012) for Na-saturated SWy-2 Mnt at 95% RH after 5 or 10 cycles of hydration–dehydration. The d 001 values of 15.6 Å for NaMnt (Fig. 8) were also similar to the values obtained by Li and Schulthess (Reference Li and Schulthess2020) for water-saturated HMnt (15.2 Å) and LiMnt (15.9 Å), but greater than the values for KMnt (13.6 Å) and CsMnt (12.5 Å). Larger d 001 values for Na-saturated Mnt are also to be found in the literature. A value of 18.73 Å was obtained by Dazas et al. (Reference Dazas, Ferrage, Delville and Lanson2014) for Na-saturated SWy-2 Mnt at 98% RH. d 001 values of between 17.51 and 18.72 Å were observed by Oueslati et al. (Reference Oueslati, Chorfi and Abdelwahed2017) for the Na-saturated SWy-2 Mnt at 90% RH. The difference in d 001 values of Na-saturated Mnt may be due to the sample pretreatments (e.g. methods to control sample water content, centrifugation). The larger d 001 values of ~19.6 Å for divalent cation-saturated Mnt are also similar to reported values in the literature. Values of 19.23, 18.93, and 18.90 Å were observed by Dazas et al. (Reference Dazas, Ferrage, Delville and Lanson2014) for Mg-, Ca-, and Ba-saturated SWy-2 Mnt at 98% RH.
The Mnt saturated with monovalent alkali cations showed a strong linear correlation between d 001 and pK values, and between d 001 and hydration energy (Fig. 9). However, the d 001 values of Mnt saturated with different divalent alkaline earth cations remained the same regardless of the hydration energy and pK values of these cations. Similar efforts have been made to correlate d 001 values with the cation’s ionic potential (valence/radius ratio) (Dazas et al. Reference Dazas, Ferrage, Delville and Lanson2014), where the ionic potential was related to hydration energies (Smith Reference Smith1977). A good correlation was observed by Dazas et al. (Reference Dazas, Ferrage, Delville and Lanson2014) of the ionic potential with layer-cation mean distance using profile modeling of 001 reflections of 3-hydrated SWy Mnt at 98% RH based on observed d 001 values of Mg-SWy (19.23 Å), Ca-SWy (18.93 Å), and Ba-SWy (18.90 Å). The lack of any correlations observed for divalent ions in Fig. 9 suggested that these correlations are observed easily with weakly held monovalent cations, but not with strongly held divalent cations. The correlations observed in Fig. 3 for both monovalent and divalent cations support strongly the relation between hydration energies and retention strength. The relation of retention strength and hydration energies to interlayer dimensions was not substantiated with divalent cations in the current study, however (Fig. 9). The same d 001 values of Mnt saturated with various divalent alkaline earth cations may be due to the strong hydration energy of these cations (Fig. 9a,b), which stabilized more water molecules in the interlayer sites and kept a constant d 001 value for the clay. That is, although variations in the hydration energy did correlate well with the pK values (Fig. 3), the weakest hydration energy of divalent cations (namely, Ba2+) was still too strong to collapse the interlayer space. Consequently, no d 001-pK or d 001-hydration energy correlations were observed with divalent cations.
The relation of d 001 values of cation-saturated Mnt with hydration energies (–ΔH ohyd) of monovalent alkali M + and divalent alkaline earth M 2+ cations in a bulk solution and b clay interlayer, and c their negative logarithm of adsorption strength (pK). The pK values of monovalent alkali cations were from Li and Schulthess (Reference Li and Schulthess2020). The position of the letters without symbols indicates the location of the data points for corresponding elements

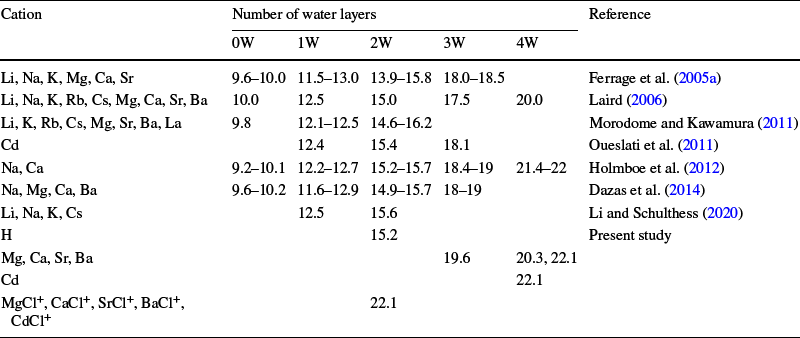
The layers of water molecules surrounding interlayer cations was calculated roughly by dividing the interlayer hydration thickness by the diameter of water molecules (2.74 Å; Schatzberg Reference Schatzberg1967). The hydration thickness was obtained by subtracting the layer thickness (9.6 Å; Schoonheydt et al. Reference Schoonheydt, Johnston, Brigatti, Mottana, Brigatti and Mottana2011) and diameter of interlayer cations (Table 4) from the measured d 001 values. Accordingly, the calculated layers of water molecules correspond to 3W or 4W for alkaline earth cations, 4W for Cd2+, 2W for Na+, and 2W for H+. These numbers agreed with the general values reported in XRD profile modeling in the literature for the degree of hydration as a function of measured d 001 values (Table 5). Note that the interlayer divalent cations had more interlayer water (2–4 layers of water) than the interlayer monovalent cations in Mnt (1–2 layers of water). Whether the interlayer divalent cations were inner sphere adsorbed or outer sphere adsorbed is unclear, but they did, at least, stabilize the presence of water molecules in the interlayer much more than the monovalent cations. This is consistent with the stronger hydration energy of divalent cations relative to monovalent cations.
Number of interlayer water layers for various d 001 values (Å) of Wyoming Mnt used in XRD profile modeling in the literature

The Mnt saturated with various cations had different interlayer spacing (Fig. 8). These homoionic clay samples were end members of a progressive mixing of competitive cations. The XRD pattern of Mnt samples can reveal if these mixed cation ratios exist as mixed or segregated species in the clay interlayers. Accordingly, the Mnt samples with various percentages of adsorbed Mg2+ and Na+ were analyzed with XRD (Fig. 10a). The percentages of adsorbed Mg2+ and Na+ on Mnt were predicted using the ion-exchange model and parameters proposed in this study (Table 3). Note that the XRD patterns shown in Fig. 10a started at 5°2θ, and thus captured only the weaker d 002 peaks. The peak corresponding to 15.6 Å in the XRD patterns became smaller when the equivalent fractions of adsorbed Mg2+ was 6% of the total CEC, still existed when the equivalent fractions of adsorbed Mg2+ was 86% of the total CEC, and disappeared when the clay was saturated with Mg2+. A broad d 002 peak at 8.0°2θ corresponding to 22.1 Å appeared gradually and was discernible when the equivalent fraction of adsorbed Mg2+ was 86% of the total CEC. This 22.1 Å peak was also observed at low pH conditions (see Fig. 11), and tentatively may be the result of an intermediate interstratification structure. It might also be due to MgCl+ retention in the interlayer. The presence of metal-Cl+ ion pairs in the interlayer of SWy-2 Mnt clays was also noted by Ferrage et al. (Reference Ferrage, Tournassat, Rinnert, Charlet and Lanson2005b). At 86% MgMnt retention, MgCl+ accounted for ~1.7% of the total Mg species in solution.
XRD pattern of wet NaMnt with various equivalent fractions of adsorbed a Mg2+ at pH 7.5 and b Ba2+ at pH 8. The d 001 reflections of the peaks for 22.1 and 19.6 Å are at 4.0 and 4.6o2θ, respectively, as noted in Fig. 8

Conversely, the XRD pattern of Mnt samples with various percentages of adsorbed Ba2+ did not show a peak at 22.1 Å. This XRD set only reached a maximum of 60% BaMnt, with ~0.2% as BaCl+ of the total Ba species in solution. The BaMnt characteristic d 001 peak at 4.5°2θ and d 002 peak at 9.0°2θ corresponding to 19.6 Å appeared when the equivalent fraction of adsorbed Ba2+ was >11% of the total CEC, which suggested the formation of interlayers dominated with Ba2+ cations. The XRD peak of NaMnt at 15.6 Å became significantly smaller when the equivalent fraction of adsorbed Ba2+ was 11% of the total CEC, and disappeared when the fraction of adsorbed Ba2+ was >60%, which suggested that the interlayer Na+ was gradually replaced by the Ba2+ cations.
The adsorbed cations on Mnt increased with pH (Figs. 4 and 5). The corresponding relative percentage of adsorbed interlayer cations also increased with pH (Fig. 11). The d 001 of Mnt adsorbed with alkaline earth cations (Mg2+, Ca2+, Sr2+, and Ba2+) decreased from 22.1 to 20.3 and 19.6 Å when pH increased (Fig. 11), which suggested that the interlayer alkaline earth cations on Mnt were predominantly hydrated with four layers of water at low pH, but changed gradually to predominantly three layers of water (Table 5). The Mnt adsorbed with Cd2+ kept constant at 22.1 Å, which suggested that the Cd2+ on Mnt were predominantly hydrated with four layers of water regardless of the pH. Alternatively, the number of water layers is reduced to 2W for d 001 peaks at 22.1 Å if the interlayer cations are MCl+ species, which, from aqueous speciation calculations, are particularly likely to occur with CdCl+ at pH < 10 and with the alkaline earth cations at pH < 2. Unlike the alkaline earth cations, the Cd2+ cations can form strong CdCl+ complexes over a wide pH range.
XRD patterns of wet Mnt samples from a Mg2+, b Ca2+, c Sr2+, d Ba2+, and e Cd2+ adsorption envelopes at various pH values. The d 001 values (Å) and the model predicted ratios of adsorption sites occupied by different cations are also shown

Most of the broad peaks around 4°2θ in Fig. 11 appear to be the result of several overlaid peaks, corresponding to 22.1, 20.3, and 19.6 Å. The presence of multiple d 001 peaks for Mnt samples with various percentages of interlayer cations (Figs. 10 and 11) suggested the formation of different interlayers containing dominantly one type of cation, which were described as segregated layers or a demixing process by Glaeser and Méring (Reference Glaeser and Méring1954), Levy and Francis (Reference Levy and Francis1975), Mamy and Gaultier (Reference Mamy and Gaultier1979), Iwasaki and Watanabe (Reference Iwasaki and Watanabe1988), and Pils et al. (Reference Pils, Laird and Evangelou2007).
An alternative explanation for the presence of multiple peaks can be the heterogeneity of the interlayer hydration state of clay minerals. The shift and presence of coexisting XRD peaks on Ca-saturated SWy-2 Mnt from 15.2 Å at near-neutral pH to 12.6 Å at pH 0.14 were observed by Ferrage et al. (Reference Ferrage, Tournassat, Rinnert and Lanson2005c) who suggested a modification of the smectite interlayer composition in the presence of interlayer protons at low pH. Extremely heterogeneous structures including interstratification of 2W and 1W at intermediate pH were also observed in their study. The shift and presence of coexisting XRD d 001 peaks from a mainly mono-hydrated structure for the Na-saturated SWy-2 Mnt to a bi-hydrated structure for the Ca-saturated Mnt as a function of the equivalent fractions of Na+ in solution were observed by Tertre et al. (Reference Tertre, Ferrage, Bihannic, Michot and Prêt2011) and noted to adsorb on the solid. Those authors suggested that this change in XRD peaks resulted from a modification of the Mnt hydration state. A third possible explanation is the presence of impurities (e.g. feldspar, illite, quartz) in NaMnt samples. Thirty six bentonite samples were studied by Kaufhold et al. (Reference Kaufhold, Dohrmann, Stucki and Anastácio2011) who observed that the presence of impurities changed the XRD peak shape and position.
The XRD peak at 22.1 Å was observed in all samples at low pH and in Cd-NaMnt at all pH values (Fig. 11). This may be due to the formation of intermediate interlayer structures or the presence of other ions in the interlayer, resulting in modification of the interlayer dimensions, potentially MCl+ cations. The estimated aqueous MCl+ percentages of total alkaline earth metal concentrations in solution were ~1% or higher for all samples that showed an XRD peak at 22.1 Å. The estimated percentages of aqueous CdCl+ of the total Cd in solution ranged from 27% at high pH to 63% at low pH.
Conclusions
The adsorption of divalent cations was described very well using an extension of an ion-exchange model developed for monovalent cations. Confidence in the model is enhanced when some of its parameters are obtained independently. Specifically, the number of adsorption sites and relative percentage of CEC for each site were taken from a previous DFT study (Li et al. Reference Li, Schulthess, Co, Sahoo and Alpay2020).
At low pH (< 6), an ion-exchange model involving H+, Na+, and M 2+ described the cation adsorption envelope data very well. The adsorption strength of divalent cations increased in the order Mg2+ < Cd2+ < Ca2+ < Sr2+ < Ba2+ on all three sites, which was in the opposite order of their hydration energies.
At higher pH (> 6), the cation adsorption continued to increase with pH. Accordingly, the metal hydroxide species, MOH+, was added to the previous ion-exchange model and the new model was able to describe cation adsorptions very well on NaMnt. Although the aqueous MOH+ started to form at ~pH 10, the adsorption of MOH+ at ~pH 7 on site S c suggested that M 2+ was first adsorbed on the clay surface and then hydrolyzed while adsorbed.
The presence of M 2+ cations resulted in the formation of new adsorption edges in the Na+ adsorption envelope curve. The present study showed that these new adsorption edges are not necessarily adsorption reactions on new adsorption sites, but could instead be new adsorption reactions on the existing sites. To be clear, adsorption on clay edges can exist, but their contribution to the total CEC of the SWy-3 Mnt is probably much lower than traditionally asserted; possibly as low as 1% of the total CEC, consistent with their surface area and site density contribution for MX-80 (Tournassat et al. Reference Tournassat, Neaman, Villiéras, Bosbach and Charlet2003) or 3% for SWy-1 (Schulthess and Huang Reference Schulthess and Huang1990).
The d 001 values of Mnt can be influenced by sample pretreatments. The Mnt saturated with divalent cations showed larger d 001 values than monovalent cations, as expected, because the divalent cations have stronger hydration energies (Morodome and Kawamura Reference Morodome and Kawamura2011). The Mnt showed a consistent d 001 value of 19.6 Å when saturated with alkaline earth cations (Mg2+, Ca2+, Sr2+, Ba2+), and 22.1 Å with Cd2+. The interlayer divalent cations were hydrated with 3 or 4 water layers, whereas interlayer monovalent cations were hydrated with 1 or 2 water layers. The amount of interlayer water was consistent with their hydration energies. Unlike monovalent cations, no relation was found between the measured d 001 values and the negative logarithm of adsorption strength for divalent cations. The presence of multiple d 001 peaks in the XRD patterns suggested that the interlayer cations were segregated and that the interlayer ion–ion interactions among various types of ions were minimized. Minimizing ion–ion interactions among various types of ions in the interlayer is an important criterion for maintaining a constant pK value for Na+ in the ion-exchange model of mixed-cation systems.
ACKNOWLEDGMENTS
The authors acknowledge the assistance of Dawn Pettinelli, Joseph Croze, and Patrick McIntosh of the University of Connecticut Soil & Nutrient Analysis Laboratory. They also thank the journal reviewers for their constructive comments. This work was supported by the USDA National Institute of Food and Agriculture, Hatch project accession number 1013470. Funding support also came from the 2018 Student Research Grant Award from The Clay Minerals Society.
Funding
Funding sources are as stated in the Acknowledgments.
Declarations
Conflict of Interest
The authors declare that they have no conflict of interest.