INTRODUCTION
A number of hypotheses have been invoked for deglaciations, such as the gradual buildup of “excessive” Northern Hemisphere (NH) ice potentially beyond an intrinsic stability threshold (e.g., Raymo, Reference Raymo1997; Clark et al., Reference Clark, Dyke, Shakun, Carlson, Clark, Wohlfarth, Mitrovica, Hostetler and McCabe2009; Tzedakis et al., Reference Tzedakis, Crucifix, Mitsui and Wolff2017) and the global influence of this excess ice when it melts (Denton et al., Reference Denton, Anderson, Toggweiler, Edwards, Schaefer and Putnam2010). Others have focused on the importance of CO2 in glacial terminations (e.g., Toggweiler et al., Reference Toggweiler, Russell and Carson2006; Shakun et al., Reference Shakun, Clark, Feng, Marcott, Mix, Liu, Otto-Bliesner, Schmittner and Bard2012) and how reinforcing interactions between northern and southern influences could trigger increased CO2 rise and deglaciation (e.g., Wolff et al., Reference Wolff, Fischer and Röthlisberger2009; Denton et al., Reference Denton, Anderson, Toggweiler, Edwards, Schaefer and Putnam2010). In order to trigger the observed deglacial rise in CO2, studies have frequently invoked changes in the Southern Hemisphere westerly winds (SWW) to explain the observed increases in upwelling (Anderson et al., Reference Anderson, Ali, Bradtmiller, Nielsen, Fleisher, Anderson and Burckle2009), Southern Ocean ventilation (Toggweiler et al., Reference Toggweiler, Russell and Carson2006; Denton et al., Reference Denton, Anderson, Toggweiler, Edwards, Schaefer and Putnam2010; Menviel et al., Reference Menviel, Spence, Yu, Chamberlain, Matear, Meissner and England2018; Gottschalk et al., Reference Gottschalk, Skinner, Jaccard, Menviel, Nehrbass-Ahles and Waelbroeck2020), and buoyancy gain (Watson et al., Reference Watson, Vallis and Nikurashin2015). Further complicating this picture, it is now clear that the deglacial CO2 rise was divided (Marcott et al., Reference Marcott, Bauska, Buizert, Steig, Rosen, Cuffey and McConnell2014) into two modes: (1) a slow millennial-scale mode that is closely linked to Antarctica temperature and possibly of oceanic origin, and (2) a fast centennial-scale mode that is closely linked to methane (CH4) release and NH climate. A slow oceanic and a fast atmospheric teleconnection with the NH is also reported for glacial climate variability in Antarctica (Buizert et al., Reference Buizert, Sigl, Severi, Markle, Wettstein, McConnell and Pedro2018).
Evaluating these hypotheses requires empirical constraints on past changes in the SWW. Unfortunately, too few of such records exist, and the reconstruction remains challenging (Kohfeld et al., Reference Kohfeld, Graham, de Boer, Sime, Wolff, Le Quéré and Bopp2013). One often-used approach for gaining potential insights into past changes in SWW/CO2 upwelling is to reconstruct positions of the northern oceanic fronts of the Antarctic Circumpolar Current (ACC) (e.g., Barker et al., Reference Barker, Diz, Vautravers, Pike, Knorr, Hall and Broecker2009; Kohfeld et al., Reference Kohfeld, Graham, de Boer, Sime, Wolff, Le Quéré and Bopp2013; Bostock et al., Reference Bostock, Hayward, Neil, Sabaa and Scott2015; Gottschalk et al., Reference Gottschalk, Skinner, Misra, Waelbroeck, Menviel and Timmermann2015). We apply a similar approach here, developing a high-resolution reconstruction of latitudinal oceanic conditions (faunal changes), which are sensitive to frontal shifts in offshore southern Australia, reproduced in two distant (separated by ~600 km; Fig. 1) cores. These reconstructions document millennial-scale faunal changes that closely match synchronous changes of atmospheric temperature and CO2/CH4 in Antarctic ice cores (Parrenin et al., Reference Parrenin, Masson-Delmotte, Köhler, Raynaud, Paillard, Schwander, Barbante, Landais, Wegner and Jouzel2013) and appear to be linked with both NH and Southern Hemisphere (SH) climate signals. Our results may point to and support the view (e.g., Toggweiler et al., Reference Toggweiler, Russell and Carson2006; Denton et al., Reference Denton, Anderson, Toggweiler, Edwards, Schaefer and Putnam2010) of a critical atmospheric see-saw role during the last deglaciation.
(color online) Map showing the location of cores MD03-2611 and SS0206-GC15, the Leeuwin Current (LC), and today's position of the Subtropical Tront (STF) and Subantarctic/Polar Front (SAF/PF). Inset: Satellite-derived sea surface temperature (SST) in degrees Celsius in offshore Australia showing that site SS0206-GC15 is less influenced by the LC and lies closer to the STF.

OCEANOGRAPHIC SETTING
The coast of southern Australia is bathed by waters from the eastern Indian Ocean that extend as far as western Tasmania. South of the continent, subtropical waters today are overlain by the Leeuwin Current (LC) that originates in the tropics. This current is an offshoot of the Indonesian Throughflow (ITF), which sees the outflow of western Pacific Ocean waters pass through the Indonesian Archipelago and eventually enter the eastern Indian Ocean (Fig. 1). The LC, an arm of the ITF once in the eastern Indian Ocean, is characteristically warm and of low salinity. Because of steric height differences (Godfrey and Ridgway, Reference Godfrey and Ridgway1985), it flows along the coast of Western Australia as far as Cape Leeuwin at its westernmost tip (Fig. 1). The warm LC therefore exports heat from the tropics. It is also quite shallow (avg. <200 m deep), and its important characteristic is that it transports tropical organisms and their larvae (such as planktic foraminifera) that otherwise would not be found in latitudes as high as 35°S (Pearce and Phillips, Reference Pearce and Phillips1988; Pearce and Hutchins, Reference Pearce and Hutchins2009; Perner et al., Reference Perner, Moros, De Deckker, Blanz, Wacker, Telford, Siegel, Schneider and Jansen2018). The LC continues along the entire southern Australian coast (Fig. 1) and overrides the westward-flowing Flinders Current, which is strongest near the 600-m isobath, where current speeds can reach 20 cm/s (Middleton and Bye, Reference Middleton and Bye2007). In winter, especially, the LC and local winds drive currents averaging up to 20–30 cm/s, but the LC always remains shallow (<200 m deep). It is known to flow especially strongly in winter during La Niña years (see the seasonal sea-surface temperature [SST] maps assembled by Wijffels et al. [Reference Wijffels, Beggs, Griffin, Middleton, Cahill, King, Feng, Benthuysen, Steinberg and Sutton2018]; additional notes on the modern Leeuwin Current properties are presented in the Supplementary Material). The El Niño-Southern Oscillation (ENSO) strongly influenced the oceanic conditions in offshore southern Australia during the past decades as well as during the mid- to late Holocene (e.g., Perner et al. Reference Perner, Moros, De Deckker, Blanz, Wacker, Telford, Siegel, Schneider and Jansen2018).
Today, the significant Subtropical Front (STF) is located close to 45°S (10°S of our core sites, see Fig. 1) but waxes and wanes latitudinally relative to the southern coast of Australia. It is closer to the Australian coast during the austral winter (at ~45°S), and, consequently, low-pressure systems embedded in the westerly circulation that tracks the STF bring rain to the southeastern portion of the country. The STF is located farther from the coast during the austral summer (at ~47°S).
Latitudinally, the STF extends to the southern tip of South Africa and is traditionally considered the northern extent of the Southern Ocean, thus forming a major frontal zone and water mass boundary that separates the warm, salty surface waters of the subtropical gyre from the cold, fresh subantarctic surface waters associated with the ACC. The latter marks the latitudinal position of the westerlies in the Southern Ocean (Belkin and Gordon, Reference Belkin and Gordon1996; Rintoul et al, Reference Rintoul, Donguy and Roemmich1997; Sikes et al., Reference Sikes, Howard, Samson, Mahan, Robertson and Volkman2009). De Boer et al. (Reference De Boer, Graham, Thomas and Kohfeld2013) have already pointed out that the latitudinal position of the STF is a key player in global climatology. Nevertheless, based on instrumental data obtained over climatically very short periods in a warm climate state, the STF was renamed the Dynamical Subtropical Front by Graham and De Boer (Reference Graham and De Boer2013) as the eastward extension of the western boundary and characterized by obvious changes in SSTs and sea surface heights (SSHs). Thus, Graham and De Boer (Reference Graham and De Boer2013) challenged the traditional relationship between the STF and the SWW. As there is no readily available proxy for SSH, we continue to use the definition of the traditional STF, as the frontal shifts seen during the transition from a glacial to an interglacial period are likely to have been much more pronounced. It can also be expected that the characteristics of oceanic fronts were different during the last glacial and deglaciation as mean temperatures cooled. Nevertheless, reconstructing the latitudinal position of oceanic fronts is one way of identifying changes in past SWW, although caution is required (Kohfeld et al., Reference Kohfeld, Graham, de Boer, Sime, Wolff, Le Quéré and Bopp2013).
The Subantarctic Front (SAF) is the northern limit of the ACC. Belkin and Gordon (Reference Belkin and Gordon1996) were the first to define the SAF in the southeast Indian Ocean and concluded that it is almost parallel to, and approximately 10° south of, the STF south of Australia. More recently, Shao et al. (Reference Shao, Gille, Mecking and Thompson2015) reassessed the position of the SAF south of Australia and showed that it is located close to 45°S south of Western Australia and 50°S south of Tasmania. Morrow et al. (Reference Morrow, Donguy, Chaigneau and Rintoul2004) identified that over nine years, the SAF boundary meandered and is the site of large core eddies formation where deep, cold cores yielded less saline water. This further confirms that the SAF boundary is not fixed. These eddies originate from the polar frontal zone. Finally, Simon and Rodrigues (Reference Simon and Rodrigues2019) recognized that, since 2000, the SAF has migrated poleward in all three oceans in the SH, and this is consistent with the increase in anthropogenic greenhouse gas emissions. In the Pacific Ocean, the SAF moved poleward during El Niño phases and equatorward during La Niña phases (Simon and Rodrigues Reference Simon and Rodrigues2019). This demonstrates the migratory nature of this oceanic boundary, even over short periods; it is thus possible to conceive of similar shifts over more extensive periods (at millennial scale) and when oceanic temperatures and winds would have been very different. Recently, Perren et al. (Reference Perren, Hodgson, Roberts, Sime, Van Nieuwenhuyze, Verleye and Vyverman2020) examined a 700-yr record of changes in SWW intensity based on proxies from a core taken on subantarctic Marion Island, which they compared with paleoclimate records and recent instrumental data. They noted that during cool periods, such as the Little Ice Age, the winds weakened and shifted equatorward, but during warm periods, they intensified and migrated in the other direction. Perren et al. (Reference Perren, Hodgson, Roberts, Sime, Van Nieuwenhuyze, Verleye and Vyverman2020) concluded that it is changes in the latitudinal temperature gradient that drive century-scale SWW migrations.
METHODS
Two deep-sea cores south of Australia
Marine-sediment core MD03-2611 (36°43.8′S, 136°32.9′E) was collected by the RV Marion Dufresne in 2003 from a small plateau south of Kangaroo Island at 2420 m water depth in the Murray Canyons Group (Hill and De Deckker, Reference Hill and De Deckker2004). Only the interval spanning 1.50–6.15 m of this core was examined for the present study (~23–6 ka). Samples taken at close intervals from the working half of the core were processed for planktic foraminiferal faunal analyses, radiocarbon dating of selected planktic foraminifera, and alkenone analyses.
Core SS0206-GC15 (38°11.26′S, 142°24.62′E was collected by the RV Southern Surveyor ~600 km southeast of MD03-2611, downstream along the flow path of the LC and offshore from southwestern Victoria, at 907 m water depth (Fig. 1). The entire core consists of uniform dark gray clay and is 5.55 m long. Only the interval spanning 0.79–4.70 m was examined for the present study. As with core MD03-2611, samples taken at close intervals were processed for planktic foraminifera faunal analyses, radiocarbon dating of selected planktic foraminifera, and alkenone analyses.
Core chronology/age-depth relationship
Within the frame of this study (~23–6 ka), 33 radiocarbon dates were obtained from each of the two cores. Most of the 66 samples represent a mix of the planktonic foraminifera Globigerinoides ruber and Globigerina bulloides (see supplementary tables 3 and 4 in De Deckker et al., Reference De Deckker, Moros, Perner, Blanz, Wacker, Schneider and Barrows2020). The reader is referred to the Supplementary Material attached to the present study for more details on the radiocarbon dating.
All AMS 14C dates were calibrated with the Marine13 calibration curve in Calib version 7.0.2 (Reimer et al., Reference Reimer, Bard, Bayliss, Beck, Blackwell, Bronk Ramsey and Buck2013), using a marine reservoir age of 440 ± 50 yr. Since there is so little information on the last glacial maximum reservoir age for the Australian region, we took into account the work of Sikes and Guilderson (Reference Sikes and Guiderson2016) from the western Pacific. Following Sikes and Guilderson (Reference Sikes and Guiderson2016), we calibrated the AMS 14C dates using a reservoir age of 700 yr for samples ranging from 21 to 18 cal ka BP and then decreased this value to 600 yr for the period spaning 18–14 cal ka BP and 440 yr for younger samples. The calibrated results are shown in Supplementary Table 1 and Supplementary Figure 1. We note that the range of (1σ) errors obtained during calibration is overall lower than the values to be added, which provides confidence in our age model.
The age-depth models (Supplementary Fig. 1) were fitted to the AMS 14C dates with OxCal's p-sequence model (Bronk Ramsey, Reference Bronk Ramsey2008), with a priori for the stiffness parameter k set with log(k/k0) drawn from a uniform distribution between −2 and 2 with k0 set to 1. The outlier probability is set to 0.1 using the general outlier model with default settings (Bronk Ramsey, Reference Bronk Ramsey2009).
Analyses and interpretation of planktic foraminifera
Analyses
For the planktic foraminiferal analyses, ~10 g of dry sediment was wet-sieved through a 150-μm sieve and the residue dried at 45°C. Identification to species level using a stereomicroscope followed the taxonomy of Parker (Reference Parker1962). An average of 400 individual planktic foraminifera were counted from the dry residue per sample. For the interval ~23–6 ka, 219 samples from core MD03-2611 (avg. 80-yr sample resolution) and 210 from core SS02-GC15 (avg. 80-yr sample resolution) were counted. Within the frame of this study, we increased the sample number (with regard to De Deckker et al., Reference De Deckker, Moros, Perner and Jansen2012) in MD03-2611 for the interval ~23–10 ka by 52 samples. Weights were not recorded, thus additional calculation of fauna per gram of sediment is not provided.
Foraminiferal assemblage and paleoecological interpretation
In the earlier studies from the region listed below, 14 planktic foraminiferal species have been identified in offshore southern Australia in Holocene (e.g., Perner et al., Reference Perner, Moros, De Deckker, Blanz, Wacker, Telford, Siegel, Schneider and Jansen2018) and glacial/deglacial (e.g., De Deckker et al., Reference De Deckker, Moros, Perner and Jansen2012) sediments. A detailed discussion on the paleoecological interpretation of the foraminiferal assemblages is given in Perner et al. (Reference Perner, Moros, De Deckker, Blanz, Wacker, Telford, Siegel, Schneider and Jansen2018) and De Deckker et al. (Reference De Deckker, Moros, Perner and Jansen2012, Reference De Deckker, Moros, Perner, Blanz, Wacker, Schneider and Barrows2020). Here, we briefly summarize the taxa used for reconstructing (1) the presence of the LC; (2) the oceanic frontal influence (STF, SAF, and Polar Front [PF]) south of Australia; and (3) the LC presence and strength. The subtropical species G. ruber a highly productive surface dweller, is known to flourish in the upper 50 m of the water column. In the study area, the abundance of the “tropical fauna,” particularly G. ruber, is linked to the presence of the LC transporting warm tropical waters (Indo Pacific Warm Pool (IPWP) and ITF area) as far as south of Australia. The occurrence of G. ruber is therefore used here to indicate the presence of lower-latitude waters advecting into the study area via the LC (for more information, refer to Perner et al., Reference Perner, Moros, De Deckker, Blanz, Wacker, Telford, Siegel, Schneider and Jansen2018). During the middle to late Holocene, variations in the strength of the LC are linked to ENSO (Supplementary Fig. 3; Perner et al., Reference Perner, Moros, De Deckker, Blanz, Wacker, Telford, Siegel, Schneider and Jansen2018), but during glacial times, the LC presence/absence reflects frontal displacements (Supplementary Fig. 3; De Deckker et al., Reference De Deckker, Moros, Perner and Jansen2012). The thermocline-dwelling species Globorotalia inflata flourishes just below the mixed layer, and the high abundance of this species suggests a well-stratified water column (Hemleben et al., Reference Hemleben, Spindler and Anderson1989); that is, when the LC flow is strong.
Concerning oceanic frontal influence, Turborotalita quinqueloba and Neogloboquadrina pachyderma (sin.) are reported from both hemispheres as subpolar to polar and are therefore cold-water species. The highest abundance of these species is in the SH, south of the PF. N. pachyderma is predominantly found in subantarctic waters south of 50°S (see references in De Deckker et al., Reference De Deckker, Moros, Perner, Blanz, Wacker, Schneider and Barrows2020) and notably decreases close to the STF. Here, we group these taxa as “subpolar species,” which can therefore be used to identify major shifts in the position of the SAF/PF south of Australia (see references in De Deckker et al., Reference De Deckker, Moros, Perner, Blanz, Wacker, Schneider and Barrows2020). Neogloboquadrina incompta and G. bulloides typically occur in transitional water masses characteristic of the STF zone (Fraile et al., Reference Fraile, Schulz, Mulitza and Kucera2008; Bostock et al., Reference Bostock, Hayward, Neil, Sabaa and Scott2015). Core-top samples taken along a transect south of Tasmania, a distance of some 1600 km from the core sites, show a high abundance of N. incompta close to the STF (Supplementary Fig. 2; King and Howard, Reference King and Howard2003). Interestingly, the modern maximum relative abundance of N. incompta close to the STF is also observed south of Africa (Peeters et al., Reference Peeters, Acheson, Brummer, de Ruijter, Schneider, Ganssen, Ufkes and Kroon2004). The subsurface dweller (intermediate water depths; ~50–100 m) G. bulloides is often related to colder and deeper subsurface, nutrient-rich waters (e.g., Bé and Tolderlund, Reference Bé, Tolderlund, Funnel and Riedel1971; Bé, Reference Bé and Ramsay1977; Bé and Hutson, Reference Bé and Hutson1977; Hemleben et al., Reference Hemleben, Spindler and Anderson1989) as well as increased productivity along a front (Crundwell et al., Reference Crundwell, Scott, Naish and Carter2008; Scott, Reference Scott2013). The same characteristics are found in the oceanic fronts linked to the Agulhas leakage off South Africa (Peeters et al., Reference Peeters, Acheson, Brummer, de Ruijter, Schneider, Ganssen, Ufkes and Kroon2004).
In summary, critical foraminiferal taxa can thus be used to identify the following: (1) the presence of the SAF/PF by the foraminiferal subpolar species group (N. pachyderma and T. quinqueloba), in addition to the biomarker %C37:4 (see below); and (2) a strong STF is influenced by a high percentage of N. incompta, and a weak but notable (upwelling) STF is influenced by an increased G. bulloides abundance.
We acknowledge that our approach allows a reconstruction of temporal influences of specific oceanic fronts over our study sites south of Australia but cannot strictly be used to estimate how far the fronts moved (e.g., poleward) based on the faunal front indicators. However, the strength of the LC (G. ruber percentage and biomarker SSTs) over the deglacial time interval provides a sound relative estimate of the extent of the frontal shift.
Preparation and analyses of alkenones (Uk´37, %C37:4)
The new biomarker alkenone Uk’37 and %C37:4 analyses (i.e., reconstruction of SST and fresh/polar water influence, respectively) were performed at the biomarker laboratory at the Institute of Geosciences, Kiel University, at sample intervals of 3–5 cm (MD03-2611) and 1–2 cm (SS02-GC15), providing a temporal resolution of ~200 yr for the former and <100 yr per sample for the latter.
Long-chained alkenones (C37) were extracted from a homogenized 2–3 g of bulk sediment using an accelerated solvent extractor (Dionex ASE-200) with a mixture of 9:1 (v/v) of dichloromethane:methanol (DCM:MeOH) at 100°C and 100 bar N2 (g) pressure for 20 min. Extracts were cooled at about −20°C and subsequently taken to near dryness by vacuum rotary evaporation at 20°C and 65 mbar. We used a multidimensional double-gas column chromatography (MD-GC) set up with two Agilent 6890 gas chromatographs for identification and quantification of C37:2 and C37:3 ketones (Etourneau et al., Reference Etourneau, Schneider, Blanz and Martinez2010).
Quantification of the individual compounds was achieved with the addition of an internal standard prior to extraction (cholestane [C37H48] and hexatriacontane [C36H74]). The relative proportions were obtained using the peak areas of the two different compounds. The Uk'37 index was calculated using the equation (Prahl et al., Reference Prahl and Wakeham1987): Uk'37 = (C37:2)/(C37:2+C37:3), which was subsequently translated into SST (error bar 1°C) following a global calibration (Müller et al., Reference Müller, Kirst, Ruhland, von Storch and Rosell-Mele1998): SST (°C) = (Uk'37 – 0.044)/0.033. We prefer to use this calibration as it was previously used in other studies on Australian cores (Pelejero et al., Reference Pelejero, Calvo, Logan and De Deckker2003; Calvo et al., Reference Calvo, Pelejero, De Deckker and Logan2007; Perner et al., Reference Perner, Moros, De Deckker, Blanz, Wacker, Telford, Siegel, Schneider and Jansen2018; De Deckker et al., Reference De Deckker, Moros, Perner, Blanz, Wacker, Schneider and Barrows2020). We also present the proportion of tetra-unsaturated C37 ketones relative to the sum of alkenones (%C37:4) in Figure 2F. This ratio serves as an indicator of the presence of lower-surface salinities in polar and subpolar waters (Rosell-Melé, Reference Rosell-Melé1998; Rosell-Melé et al., Reference Rosell-Melé, Jansen and Weinelt2002; Sicre et al., Reference Sicre, Bard, Ezat and Rostek2002; Harada et al., Reference Harada, Shin, Murata, Uchida and Nakatani2003; Bendle et al., Reference Bendle, Rosell-Melé and Ziveri2005).
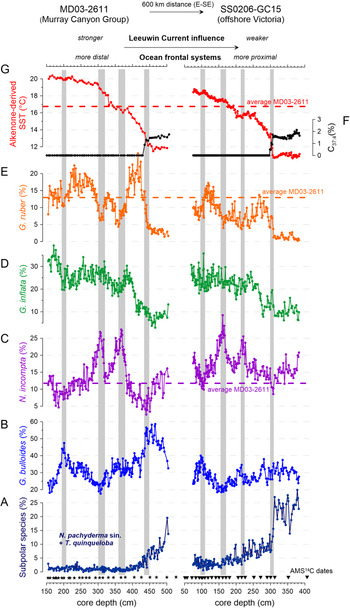
(color online) Downcore foraminiferal assemblage changes of key taxa in MD03-2611 and SS0206-GC15: Turborotalita quinqueloba and Neogloboquadrina pachyderma (sin.) comprising the subpolar species group (A), Globigerina bulloides (B), Neogloboquadrina incompta (C), thermocline-dweller Globorotalia inflata (D), and tropical Globigerinoides ruber (E). The general differences in taxa abundance reflect the different oceanic conditions at both sites with a weaker influence of the LC and the more proximal oceanic fronts at SS0206-GC15. However, marked maxima/minima are clearly seen at both sites (vertical gray bars). Biomarker alkenone-based SSTs and %C37:4 are shown in (G) and (F). Depth positions of AMS 14C dates are shown for MD03-2611 (asterisks) and SS0206-GC15 (triangles).

RESULTS
Sediment depth/age relationships
The depth/age relationships for both cores are presented in the Supplementary Material with a discussion on possible influences of reservoir age changes.
SSTs and tetra-unsaturated C37 ketones
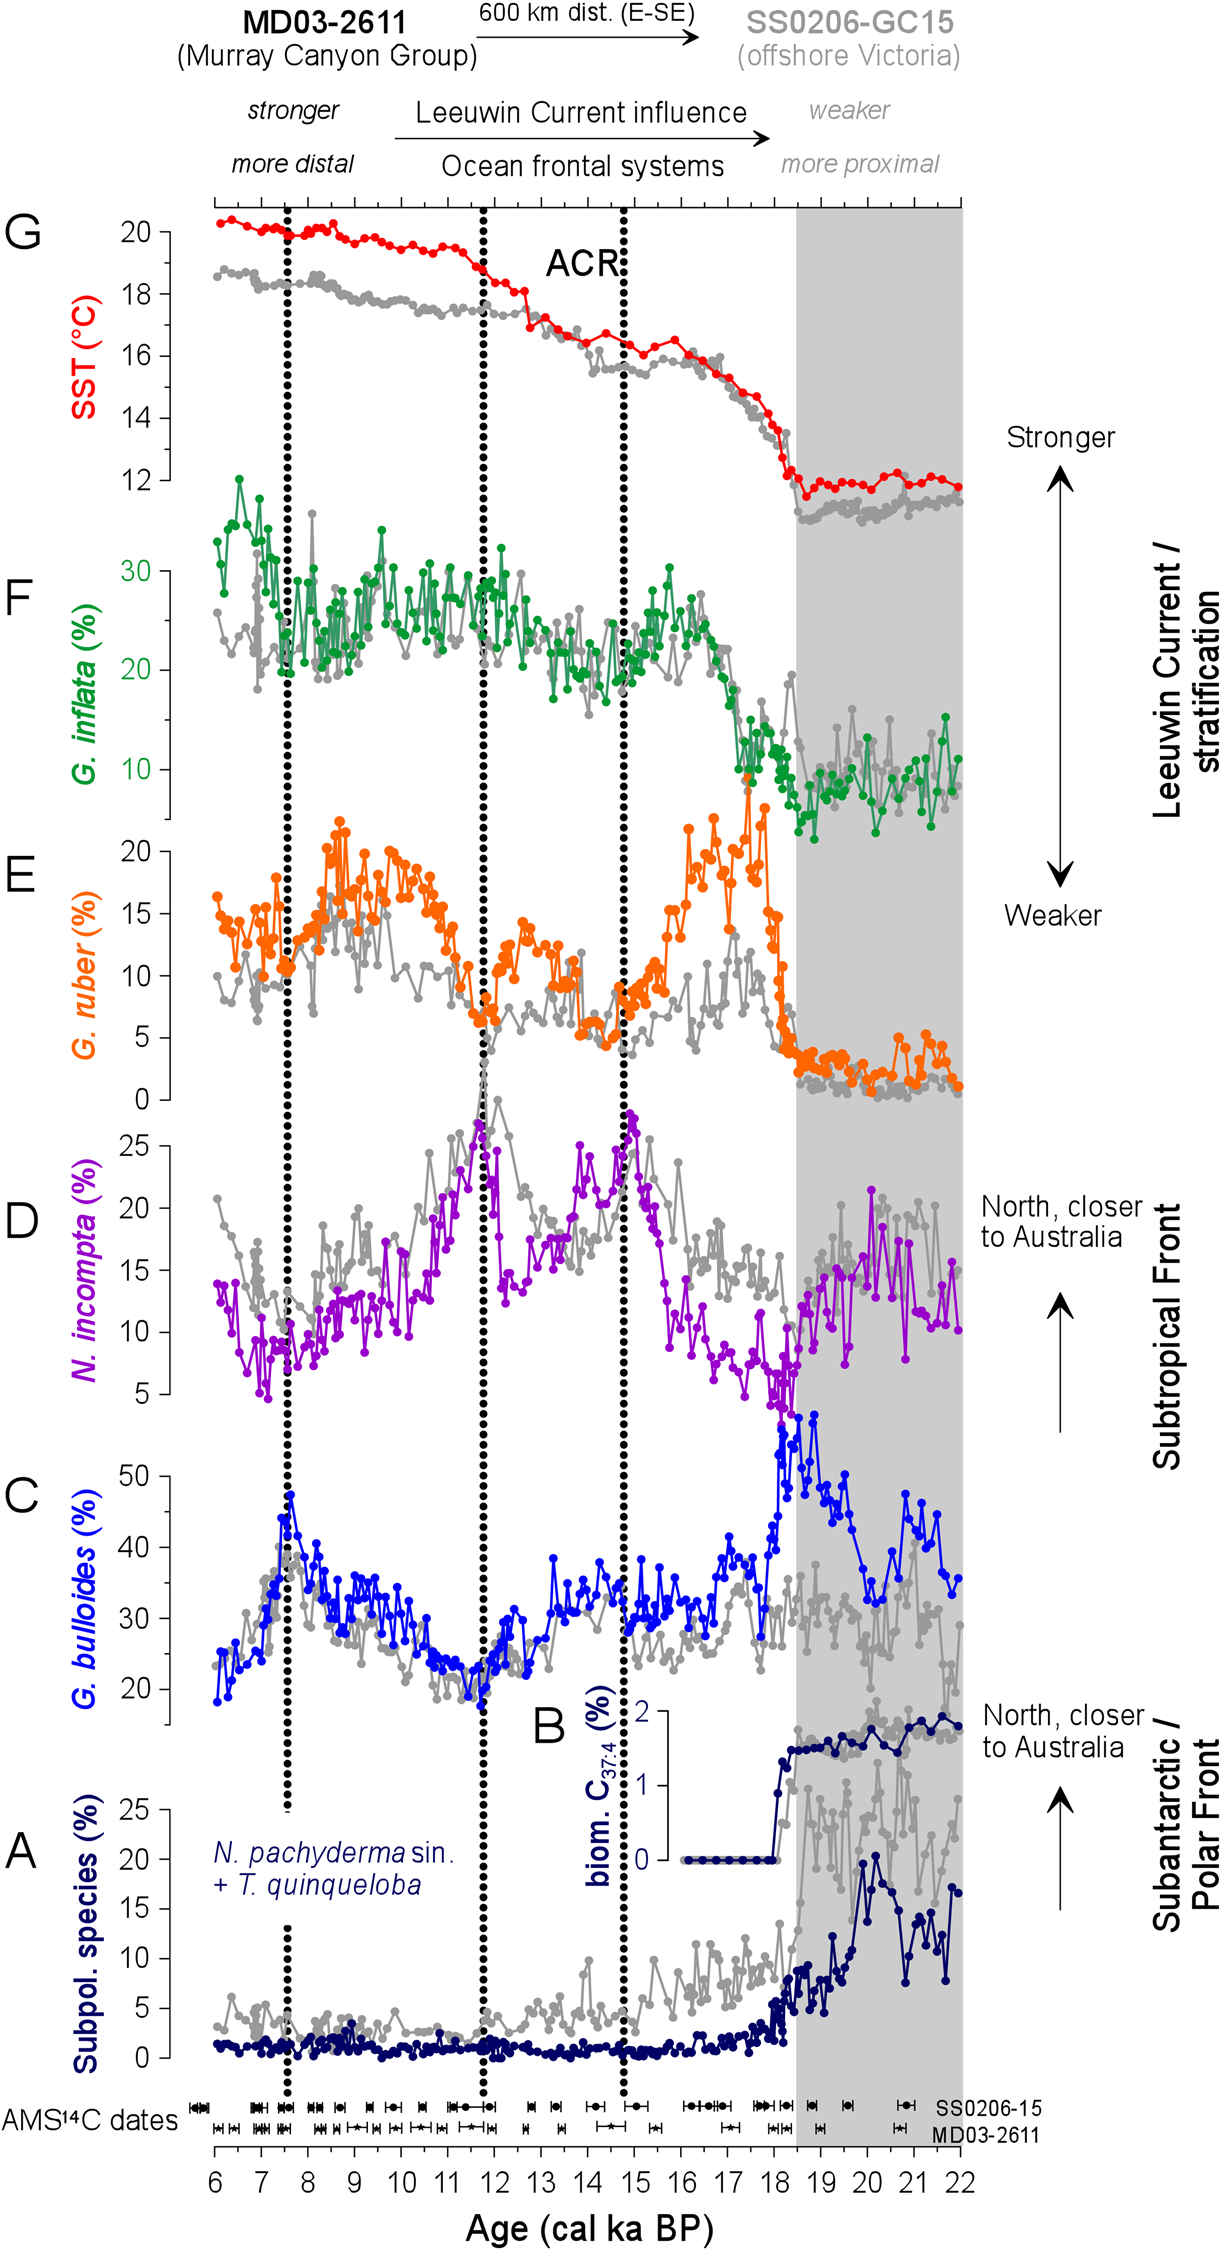
The biomarker SSTs are generally lower at core site SS02-GC15, which reflects the cooler oceanic conditions at the two sites (Fig. 2). Note the similar relative changes at both coring sites (Figs. 2F and G, 3B, and G). South of Australia, high %C37:4 values indicate the presence of polar waters at the coring site; the %C37:4 downcore variation (Fig. 3B) fits nicely to the trend seen in the foraminiferal subpolar species group (Fig. 3A). A marked SST increase (Fig. 3G) and a %C37:4 drop (Fig. 3B) are initiated at ~18.5 ka at both coring sites. A flattening of the general deglacial SST increase occurs during the Antarctic Cold Reversal (ACR; Fig. 3G). Despite its high resolution, our new data document no SST reversal during the ACR as has previously been found by Calvo et al. (Reference Calvo, Pelejero, De Deckker and Logan2007). From a long-term perspective (35–0 ka), biomarker SSTs reached maximum values at both study sites during a strong La Niña–like phase at ~6 ka (Supplementary Fig. 3G; Perner et al., Reference Perner, Moros, De Deckker, Blanz, Wacker, Telford, Siegel, Schneider and Jansen2018).
(color online) Foraminiferal assemblages (A, C–F), alkenone-derived SSTs (G), and %C37:4 (B) vs. age records of core MD03-2611 (in color) and SS0206-GC15 (gray). Foraminiferal subpolar species group (N. pachyderma and T. quinqueloba) (A) and freshwater-related alkenone %C37:4 (B) indicate proximity of our cores to the SAF/PF. Subtropical Front taxa G. bulloides and N. incompta are shown in (C) and (D). Warm Leeuwin Current taxa G. ruber and stratification-related thermocline-dweller G. inflata are shown in (E) and (F). The gray area marks the time span (~22–18.5 ka) of maximum SAF/PF and minimum LC influence. The different oceanographic conditions at the two sites explain the different assemblage levels. After ~18.5 ka, the increasing LC influence and southward-shifted oceanic fronts are marked by higher SSTs (G), increased G. ruber percentages (E), and lower N. incompta percentages (D). Marked northward displacements of the STF (vertical stippled lines) occur at ~14.8 and 11.7 ka and correspond to centennial pulses in CO2 and CH4 levels (Marcott et al., Reference Marcott, Bauska, Buizert, Steig, Rosen, Cuffey and McConnell2014), with a final event at ~7.6 ka.

Foraminifera faunal changes and links to oceanographic changes
Site-specific differences in the oceanographic setting are clearly reflected in the foraminifera faunal assemblage (Fig. 2A–G). The salient changes in percentages of the LC-indicator G. ruber (Fig. 3E) are such that from ~22–18.5 ka it was almost absent at both core sites. In contrast, the subpolar species foraminiferal group (N. pachyderma sin. and T. quinqueloba) registered high percentages in both cores, although these species were much higher in SS02-GC15, consistent with its more southerly location. These values indicate that at least the SAF (and likely, as a corollary, the PF) was closer to the Australian coast at that time. This configuration, with the STF (the boundary between subtropical and subantarctic waters) tight against Australia, pinched off the LC influence south of Australia. The high percentage of the subpolar species group starts to decrease earlier in MD03-2611 than in SS02-GC15, reflecting a progressive southward retreat of the SAF/PF and gradual eastward incursion of the LC. From ~18 ka until the present, the subpolar species percentages remain low (Supplementary Fig. 3A). G. bulloides is high in MD03-2611 from ~19 to 18.5 ka (Fig. 3C), just before the warm subtropical water species G. ruber (Fig. 3E) and thermocline/stratification taxa G. inflata (Fig. 3F) markedly increase. This indicates a prevailing weak influence (and potentially upwelling of the Flinders Current) of the already southward-shifted STF in the area of MD03-2611 from ~19 to 18.5 ka. From ~18.5 ka to the present, an overall high level of fluctuating G. ruber and G. inflata percentages suggest a persistent LC presence with varying strength (Supplementary Fig. 3D and E).
Soon after 18.5 ka, a marked, exceptional increase is noted in G. ruber (Fig. 3E) that indicates a clear presence of the LC, although percentages in SS02-GC15 are lower, as it is located ~600 km downstream, along the present-day flow path of the LC. The peak of G. ruber at MD03-2611 spans ~17.8–16.3 ka. This coincides with a low percentage of STF-indicator species N. incompta and G. bulloides (Fig. 3C and D), signifying little influence of the STF, which was likely located far south of the southern Australian coast. After ~16 ka, G. ruber percentages progressively diminished, but the high numbers of N. incompta imply that the STF was more proximal to the study area by migrating north, and the timing and percentage of that species is identical in both cores. This is indicative of a rapid frontal shift. During the ACR (Fig. 3) that spans ~14.7–13 ka (Pedro et al., Reference Pedro, Bostock, Bitz, He, Vandergoes, Steig and Chase2015), the STF once again shifted slowly south (Figs. 3D and 4J), and the influence of the LC at both core sites was significantly reduced (Fig. 3E); stratification had also weakened (G. inflata; Fig. 3F). In addition, the general deglacial SST increase flattened temporarily (Fig. 3G). Finally, a second rapid northward shift of the STF was accomplished by ~11.7 ka, as indicated by maxima in N. incompta (Fig. 3D) and minima in G. ruber (Fig. 3E). Nevertheless, the two N. incompta percentage peaks are exceptional from a long-term perspective (Supplementary Fig. 3C).
After ~11.5 ka, conditions returned to what they were before the ACR (Fig. 3C–G), with the STF continuing to shift south, SSTs increasing further (Fig. 3G), and the LC showing a strong presence over both core sites (Fig. 3E), with conditions peaking between ~9.6 and 8.5 ka. There is a clear indication (G. bulloides, Fig. 3C) of a slight northward STF displacement, which culminates at ~7.6 ka and which affected both study sites. However, this G. bulloides percentage peak is exceptional from a Holocene perspective (Supplementary Fig. 3B) and therefore deserves further attention. At MD03-2611, this interval is similar to the phase witnessed after the general SAF/PF retreat from ~19 to 18.3 ka, when only a weak STF influence was observed (see G. bulloides record in Fig. 4C) and before the LC influence rapidly intensified. When zooming in on this particular interval, a weak warming is recorded ~8.2 ka with a cooling afterward when G. bulloides numbers peak (Supplementary Fig. 5).
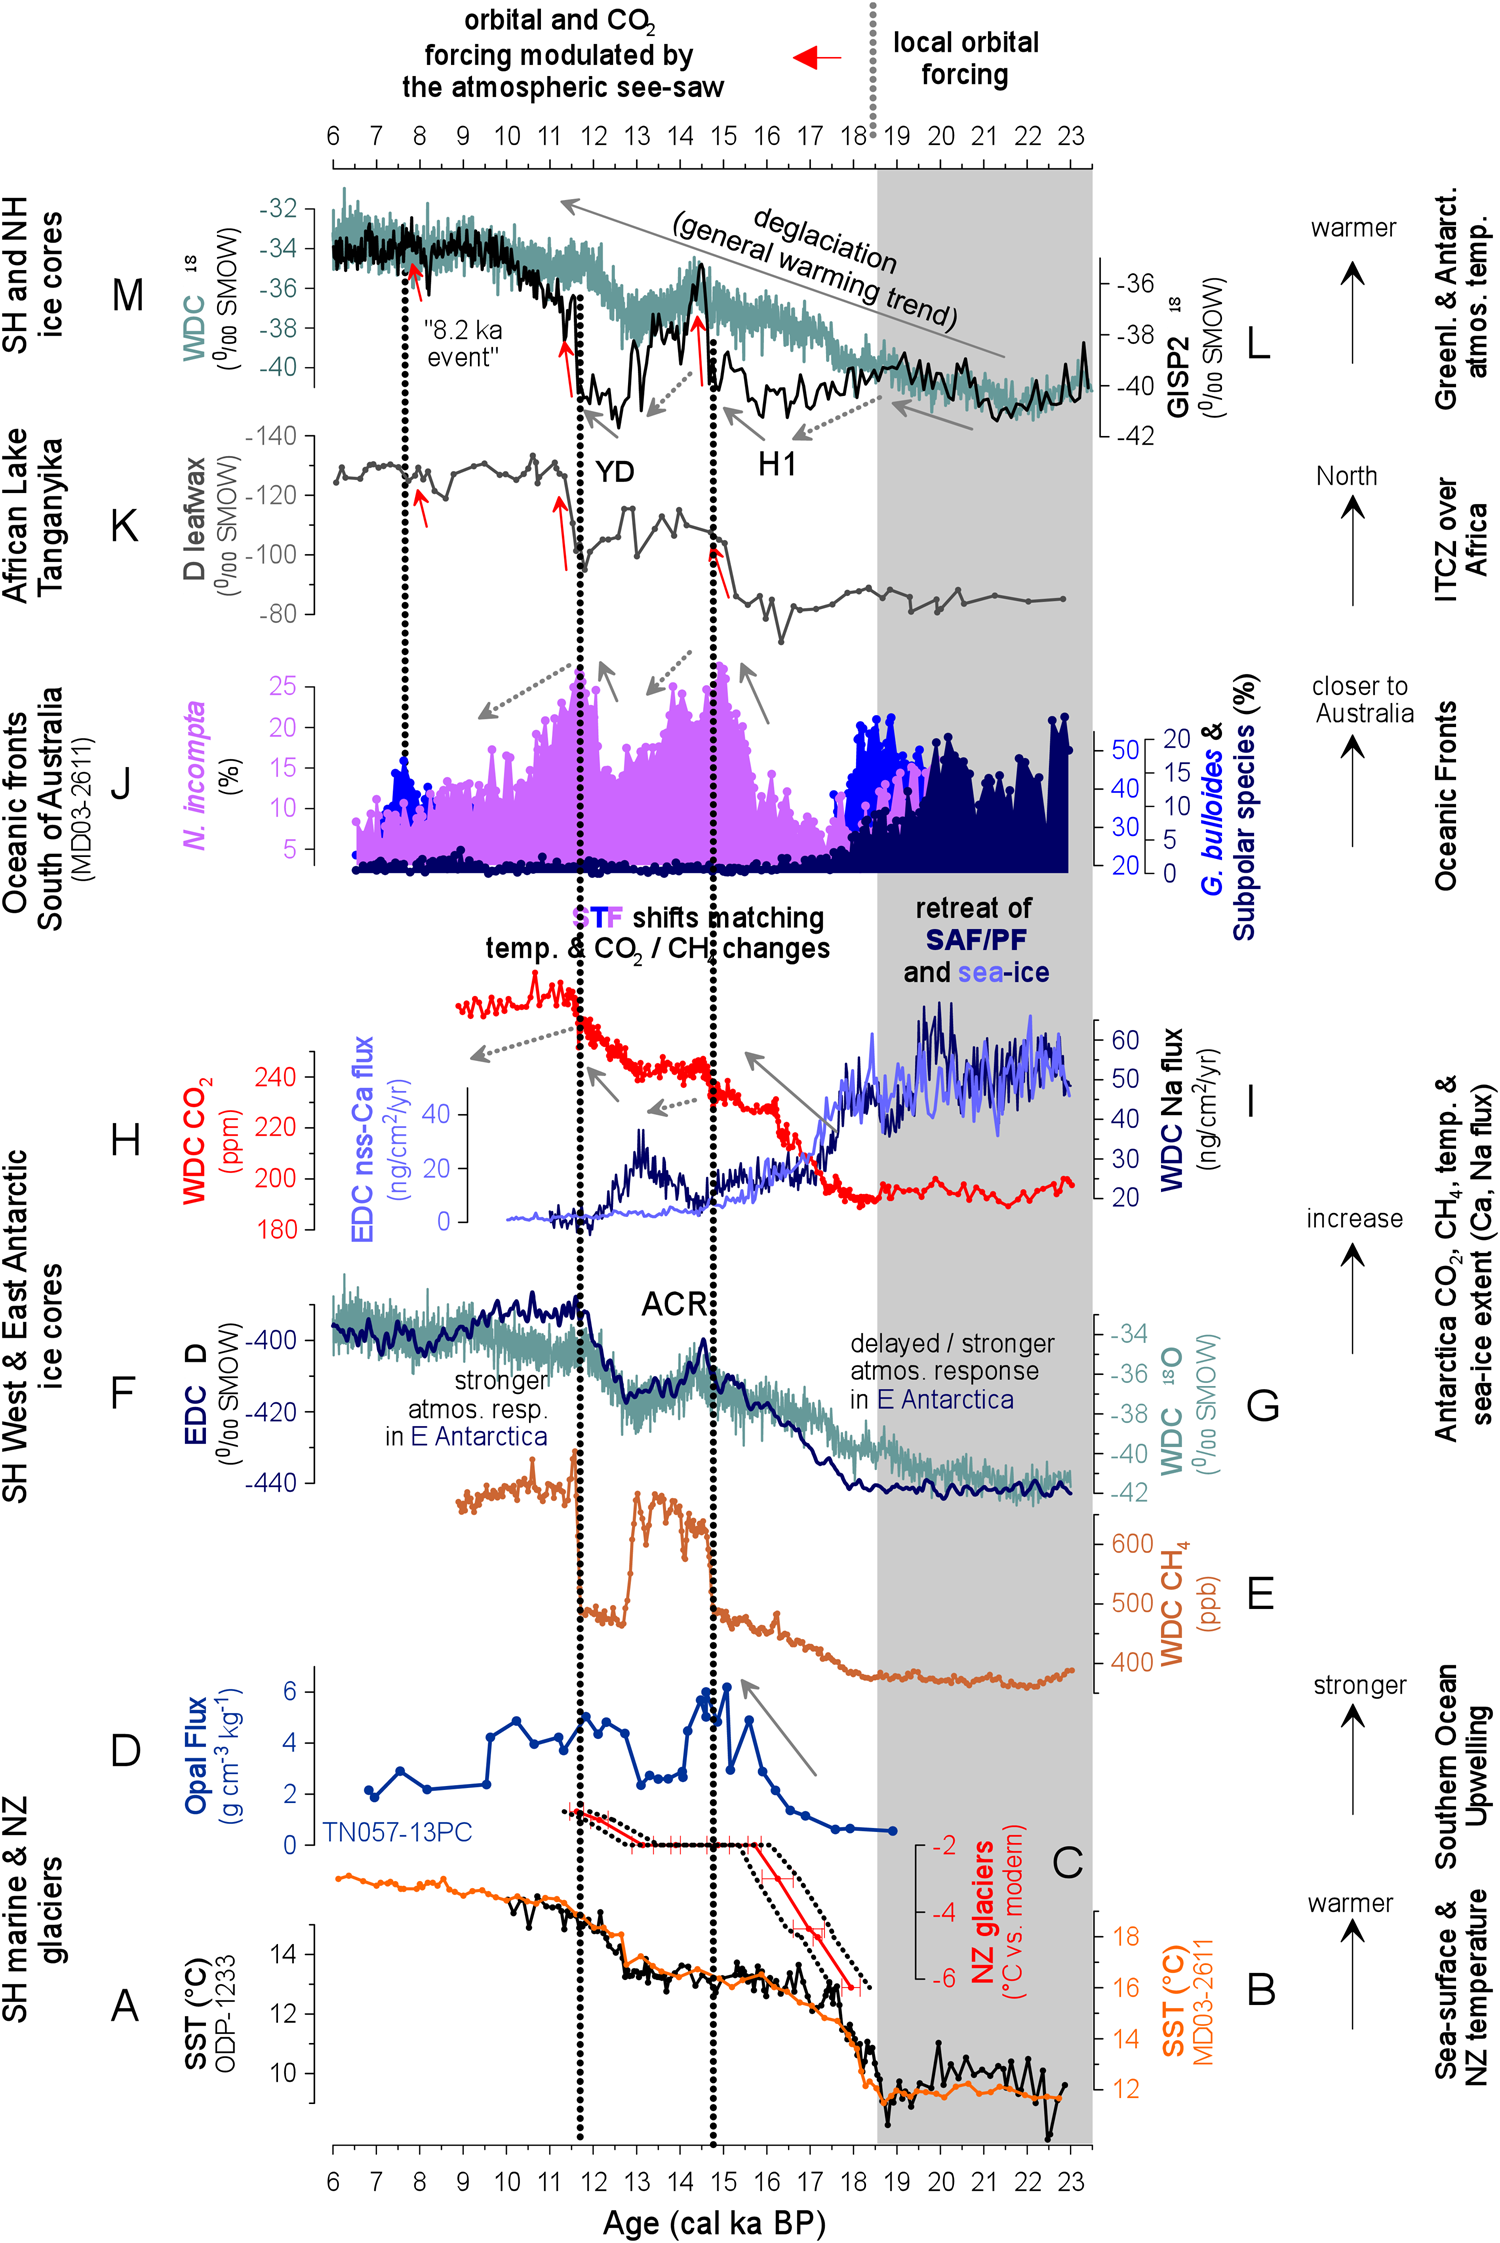
(color online) Deglacial frontal latitudinal shifts (J) compared to SST changes recorded south of Australia (B), the southeastern Pacific (A; Kaiser et al., Reference Kaiser, Lamy and Hebbeln2005), the Southern Ocean opal flux (D; Anderson et al., Reference Anderson, Ali, Bradtmiller, Nielsen, Fleisher, Anderson and Burckle2009), and the New Zealand glacier retreat (C; Putnam et al., Reference Putnam, Schaefer, Denton, Barrell, Andersen, Koffman and Rowan2013). West Antarctic ice-core methane (CH4) (WAIS Divide Project Members, 2013) and δ18O (WAIS Divide Project Members, 2013) are shown in (E) and (G, M). East Antarctic ice core δD (Jouzel et al., Reference Jouzel, Masson-Delmotte, Cattani, Dreyfus, Falourd, Hoffmann and Minster2007) is shown in (F). Changes in CO2 (Lourantou et al., Reference Lourantou, Lavrič, Köhler, Barnola, Paillard, Michel, Raynaud and Chappellaz2010) and sea ice (Röthlisberger et al., Reference Röthlisberger, Mulvaney, Wolff, Hutterli, Bigler, Sommer and Jouzel2002) are shown in (H) and (I). Greenland ice core δ18O (Grootes et al., Reference Grootes, Stuiver, White, Johnsen and Jouzel1993) and leafwax δD data from the African Lake Tanganyika (Tierney et al., Reference Tierney, Russell, Huang, Damsté, Hopmans and Cohen2008) are shown in (L) and (K). By ~18.5 ka, sea ice extent had diminished (I), oceanic fronts had contracted poleward (J), and temperatures had slightly warmed (M) in the Southern Hemisphere. After ~18.5 ka, upwelling (D) began, CO2 (H) and CH4 (E) started to rise, and glaciers in New Zealand retreated (C). Furthermore, from ~18 ka onward, northward STF displacements (vertical stippled lines) coincided with marked temperature, CO2, and CH4 changes as well as with ITCZ displacements over Africa and warming (red arrows) recorded in the Northern Hemisphere Greenland ice cores. All indicate a coupling between large-scale atmospheric circulation, frontal shifts south of Australia, CO2, and ice-core temperatures (gray arrows) that continued until ~7.6 ka.

DISCUSSION
Oceanic frontal displacements south of Australia and possible SH and NH linkages
Offshore South Australia, the oceanic fronts retreat toward Antarctica from ~22 to 18.5 ka, as indicated by a decreasing abundance of SAF/PF–specific foraminifera and a decreasing biomarker %C37:4. The SAF/PF retreat is first seen at the more distal location offshore South Australia (core MD03-2611), and the SAF/PF influence remained longer at the more proximal site offshore Victoria (core SS0206-GC15). This initial poleward retreat of the oceanic fronts seen by the subpolar species group (Fig. 4J) is linked to the general SH warming trend triggered by local orbital forcing (WAIS Divide Project Members, 2013) detected in the more maritime-influenced West Antarctica (Fig. 4G). The poleward displacement of the oceanic fronts (Fig. 4J) is parallel to the sea ice retreat seen in West and East Antarctic ice cores (Fig. 4I). Note the match is even clearer when applying a higher reservoir age to our age model. From ~18.5 ka onward, after the STF moved poleward, as indicated by G. bulloides percentages (Figs. 3C and 4I), and the sharp warming (Fig. 4B) is accompanied by the presence of a strong and warm LC (G. ruber peak; Fig. 3E–G). Notably, this first step of deglacial warming and the poleward frontal shift in conjunction with Heinrich Stadial (HS) 1 in the NH (Fig. 3 and Supplementary Fig. 3) is by far the sharpest between ~18.5 and 16.5 ka in both core records. Despite a sharp warming at this time, it is hard to explain such an extreme increase in the percentages of (sub)tropical species without an accompanying shift in the LC influence and thus a retreat in other frontal systems. For example, G. ruber reaches its maximum abundance in the entire record, suggesting the most subtropical hydrographic conditions south of Australia for the entire record, including the Holocene despite still being cooler than the Holocene by ≥3°C. A similarly rapid and extreme shift of the oceanic fronts was observed in the Atlantic sector of the Southern Ocean, suggesting the poleward contraction of the ACC and is circumpolar (or at least multibasinal) in extent (Barker et al., Reference Barker, Diz, Vautravers, Pike, Knorr, Hall and Broecker2009). The poleward displacement of the oceanic fronts and warming during the equivalent of HS1 in our cores is paralleled by widespread SH warming (Fig. 4A: off Chile; see Kaiser et al., Reference Kaiser, Lamy and Hebbeln2005), rapid glacier retreat in New Zealand (Fig. 4C; Putnam et al., Reference Putnam, Schaefer, Denton, Barrell, Andersen, Koffman and Rowan2013), an onset of upwelling in the circum-Antarctic region (Fig. 4D; Anderson et al., Reference Anderson, Ali, Bradtmiller, Nielsen, Fleisher, Anderson and Burckle2009), and a CO2 increase (Fig. 4H; Lourantou et al., Reference Lourantou, Lavrič, Köhler, Barnola, Paillard, Michel, Raynaud and Chappellaz2010). Coincident with this phenomenon, iceberg melt off Antarctica (Supplementary Fig. 4; Fogwill et al., Reference Fogwill, Turney, Golledge, Etheridge, Rubino, Thornton, Baker, Woodward, Wintger, van Ommen and et al2017) increased, and the ocean warmed up overall (Supplementary Fig. 4; Bereiter et al., Reference Bereiter, Shackleton, Baggenstos, Kawamura and Severinghaus2018). In fact, the warming that commenced at ~18.5 ka is also seen in East Antarctica (Fig. 4F; Jouzel et al., Reference Jouzel, Masson-Delmotte, Cattani, Dreyfus, Falourd, Hoffmann and Minster2007) and a few centuries later than in West Antarctica (Fig. 4G; WAIS Divide Project Members, 2013).
Our new high-resolution data from offshore Australia provide evidence that, after the oceanic fronts retreated south by ~18.5 ka, the STF shifted back once more after ~16.3 ka (after the maximum of the NH Heinrich Event 1 in the NH, the LC influence waned) and reached—after a rapid shift—its temporary northernmost position at ~14.8 ka (Fig. 4J). After a subsequent slow southward displacement, the STF rapidly shifted north again (after the Younger Dryas = Heinrich Event (H) 0 maximum), thus reaching a second maximum northward position at ~11.7 ka (Fig. 4J). A third, but weaker, northward displacement is seen at ~7.6 ka (Fig. 4J). Thus, major southward oceanic frontal shifts are broadly associated with SH warming, a gradual CO2 rise, and southward Intertropical Convergence Zone (ITCZ) shifts over Africa (Fig. 4). Already, southward repositioning of the ITCZ during H1 and H0 are widely recognized in the tropical region north of Australia (e.g., Ayliffe et al., Reference Ayliffe, Gagan, Zhao, Drysdale, Hellstrom, Hantoro and Griffiths2013; Mohtadi et al., Reference Mohtadi, Prange, Oppo, De Pol-Holz, Merkel, Zhang, Steinke and Lückge2014). Therefore, northward frontal displacements in offshore southern Australia (represented by vertical lines in Fig. 4) are coeval with rapid NH warmings after H1, H0, and possibly even after the “8.2 ka event,” with centennial jumps in atmospheric CO2 and CH4 coinciding with northward displacements in the ITCZ (Fig. 4). Nevertheless, it is worth recognizing that chronological uncertainties related to possible marine reservoir changes may complicate these interpretations. However, modeling studies have supported that the NH climate is linked to SSW changes via latitudinal shifts of the ITCZ and associated ocean-atmospheric feedbacks (Lee et al., Reference Lee, Chiang, Matsumoto and Tokos2011; Ceppi et al., Reference Ceppi, Hwang, Liu, Frierson and Hartmann2013; Menviel et al., Reference Menviel, Spence, Yu, Chamberlain, Matear, Meissner and England2018).
The recent study by Moy et al. (Reference Moy, Palmer, Howard, Bijma, Cooper, Calvo, Pelejero, Gagan and Chalk2019) showed that surface waters in the region south of Tasmania were a sink for atmospheric CO2 during the last glacial maximum. Their reconstruction suggests changes in the strength of the biological pump and the release of deep-ocean CO2 to surface waters contributed to the last deglacial rise in atmospheric CO2. These authors argued that these are related changes in upwelling intensity and the distribution of water masses over the deglaciation. The shifts observed in our core sites support such a shift in water masses.
The intensity and extent of the STF northward displacements off southern Australia seem to decrease with progressing NH ice sheet deglaciation and parallel a weakening NH temperature response and amplitude of ITCZ shifts (Fig. 4). As the SH sea ice appears not to have expanded (see ice-core records, Fig. 4I) during these phases, the westerly wind belt may have widened temporarily, perhaps as a result of strengthened SWW (Menviel et al., Reference Menviel, Spence, Yu, Chamberlain, Matear, Meissner and England2018), as suggested by our data from offshore Australia. Our suggestion is that if these changes occurred over the entire Southern Ocean, they may have led to broader regions of upwelling and increased CO2 degassing and explain increasing deep-ocean ventilation (Gottschalk et al., Reference Gottschalk, Skinner, Jaccard, Menviel, Nehrbass-Ahles and Waelbroeck2020).
The fast centennial-scale CO2 increases (Marcott et al., Reference Marcott, Bauska, Buizert, Steig, Rosen, Cuffey and McConnell2014) in the Southern Ocean appear to be coincident with, and potentially linked to, our observed rapid frontal shifts and therefore can explain the rapid transfer of carbon from the deep to upper ocean (and potentially, the atmosphere), as already observed in the Southern Ocean (Rae et al., Reference Rae, Burke, Robinson, Adkins, Chen, Cole and Greenop2018). However, our observation of frontal shifts in phase with northward ITCZ shifts is also consistent with a solubility-driven CO2 increase influenced by an increased Atlantic Meridional Overturning Circulation and NH warming (Bauska et al., Reference Bauska, Brook, Marcott, Baggenstos, Shackleton, Severinghaus and Petrenko2018), as both hemispheres were warm at this time. Likewise, the ITCZ shifts could drive a change in terrestrial carbon storage (Nielsen et al., Reference Nielsen, Jochum, Pedro, Eden and Nuterman2019). Each of these mechanisms would work in concert in response to the rapid atmospheric shifts indicated by proxy in our records.
A northward displacement of the STF south of Australia as well as of the ITCZ over the NH possibly also occurred after the 8.2 ka event (Supplementary Fig. 5). However, sea-level (Gregoire et al., Reference Gregoire, Payne and Valdes2012) freshwater proxy in the Labrador Sea (Lochte et al., Reference Lochte, Repschläger, Kienast, Garbe-Schönberg, Andersen, Hamann and Schneider2019) and modeling studies (Wiersma and Jongma, Reference Wiersma and Jongma2010; Wagner et al., Reference Wagner, Morrill, Otto-Bliesner, Rosenbloom and Watkins2013) have shown that the 8.2 ka event (Lake Agassiz drainage) appears to have been a part of a longer term freshening/cooling in the Labrador Sea region resulting from the Hudson Bay ice saddle collapse, which provided large volumes of fresh water to the ocean. A southward-shifted ITCZ during the 8.2 ka event is found in numerous proxies (e.g., Cheng et al., Reference Cheng, Fleitmann, Edwards, Wang, Cruz, Auler and Mangini2009 Liu et al., Reference Liu, Henderson, Hu, Mason, Charnley, Johnson and Xie2013) and modeling (e.g., Morrill et al., Reference Morrill, Ward, Wagner, Otto-Bliesneer and Rosenbloom2014) studies. Although our signal from offshore Australia is admittedly tentative, if confirmed it would be the first documented response to this event in higher-latitude SH marine archives.
HS1 and deglaciation
The mechanisms driving the last deglaciation remain equivocal (e.g., Raymo, Reference Raymo1997; Clark et al., Reference Clark, Shakun, Baker, Bartlein, Brewer, Brook and Carlson2012; Tzedakis et al., Reference Tzedakis, Crucifix, Mitsui and Wolff2017). A number of hypotheses have already been invoked for this change, such as the gradual buildup of excessive NH ice, potentially beyond an intrinsic stability threshold (see references listed above), and the global influence of this excess ice when it melts (Denton et al., Reference Denton, Anderson, Toggweiler, Edwards, Schaefer and Putnam2010).
The extreme changes occurring during this first step of deglacial warming (and HS1) appear critical to breaking the grip of the last glaciation. The latter has been argued to be a consequence of an anomalous state arising because of the interaction between low (orbital; continental ice) and high (D-O; ocean-atmosphere) frequency components of the climate system (see Wolff et al., Reference Wolff, Fischer and Röthlisberger2009, and references therein). The apparent and exceptional circumpolar contraction of fronts during HS1 (just after ice volume peaked), followed by a gradually reduced sensitivity of the SH frontal response as deglaciation progresses (see below), suggests a possible sensitivity of the global ocean-atmosphere system to NH ice volume. As NH ice cover and its topography strongly influence the atmosphere (Chiang and Bitz, Reference Chiang and Bitz2005; Roberts et al., Reference Roberts, Valdes and Singarayer2017) postulated in models, the exceptional poleward SWW shift associated with HS1 might be the result of a strong HS occurring in concert with a large NH (excess) ice volume. It is already clear that a threshold in the SH and CO2 response to NH climate changes exists (Ahn and Brook, Reference Ahn and Brook2014), and our results suggest that the first step of deglaciation (HS1) involved an anomalously extreme SH atmosphere-ocean state, plausibly arising in response to maximum NH ice. An anomalous atmospheric shift during HS1 is already supported by the occurrence of one of the most extreme and widespread mega droughts of the past 50 ka in the Afro-Asian monsoon region (Stager et al., Reference Stager, Ryves, Chase and Pausata2011). Indeed, anomalies in nutrients and productivity are also evident in both the tropical oceans (Diz et al., Reference Diz, Hernández-Almeida, Bernárdez, Pérez-Arlucea and Hall2018) and the Southern Ocean (Jaccard et al., Reference Jaccard, Hayes, Martínez-García, Hodell, Anderson, Sigman and Haug2013) and are distinct features of late Pleistocene terminations, consistent with an anomalous atmospheric-ocean state at these times.
Coincident with this extreme southward shift of the STF/SWW, sea ice extent declined, and the deep ocean warmed during HS1 (Supplementary Fig. 4; Bereiter et al., Reference Bereiter, Shackleton, Baggenstos, Kawamura and Severinghaus2018), thus causing the breakdown of the glacial mode of stratification, which is important for nutrient/carbon cycling and the oceans’ ability to store CO2 (Sigman et al., Reference Sigman, Hain and Haug2010; Adkins, Reference Adkins2013).
The high ocean CO2 storage associated with this glacial stratification mode is critical in maintaining the glacial state and explaining the duration of glaciation in the 100-ka world (Farmer et al., Reference Farmer, Hönisch, Haynes, Kroon, Jung, Ford and Raymo2019). Thus, by ending the glacial mode of stratification that had persisted since glacial inception (Adkins, Reference Adkins2013), HS1 marked the point of no return for the deglaciation. Destratification also offers an explanation to the conundrum (Bauska et al., Reference Bauska, Brook, Marcott, Baggenstos, Shackleton, Severinghaus and Petrenko2018) as to why there was no CO2 recovery after HS1 as in other millennial-scale events; the glacial stratification, and its high CO2 capacitance, had ended. In this way, the buildup of heat in the deep ocean and the breakup of glacial stratification clearly distinguishes it from other millennial-scale events, which involved mainly interhemispheric heat exchange in the ocean interior north of the ACC (Pedro et al., Reference Pedro, Jochum, Buizert, He, Barker and Rasmussen2018).
The reason that the deep ocean warmed during this anomalous polar ocean-atmosphere contraction remains unclear, although a number of factors likely worked in concert. The minimum in sea ice combined with the southward-shifted westerlies would have reduced the surface buoyancy loss (Watson et al., Reference Watson, Vallis and Nikurashin2015), slowed the rate of dense water renewal, and potentially warmed the deep ocean by deepening isopycnals and downward-mixing heat (Bronselaer et al., Reference Bronselaer, Winton, Griffies, Hurlin, Rodgers, Sergienko, Stouffer and Russell2018; Silvano, et al., Reference Silvano, Rintoul, Peña-Molino, Hobbs, van Wijk, Aoki, Tamura and Williams2018). Indeed, internal ocean mixing would have been maximized by the high energy input from the westerlies coincident with low sea level (excess ice), which would have increased tidal dissipation (Wilmes et al., Reference Wilmes, Schmittner and Green2019) and downward mixing of heat. As a consequence, by the end of HS1, the ocean would have been weakly stratified, thus explaining the subsequent dramatic increase in ventilation during the Bølling that is already observed in data (Barker et al., Reference Barker, Knorr, Vautravers, Diz and Skinner2010) and postulated in models (Marson et al., Reference Marson, Mysak, Mata and Wainer2016).
CONCLUSION
Taken together, our results indicate a tight coupling between ocean frontal changes in offshore South Australia (and by analogy, possibly in the Southern Ocean) and NH climate and may help confirm previous hypotheses that the westerlies play a critical role modulating CO2 uptake and release from the Southern Ocean on millennial and potentially even centennial timescales. Furthermore, we identify an anomalously marked southward atmospheric shift (but cannot estimate its extent) during the SH equivalent of HS1, which we postulate may have played a critical role in triggering the deglaciation. This atmospheric shift most likely arose in response to peak ice conditions in the NH, thus offering a potential mechanism behind the observation that large ice sheets and the duration of glaciation—by allowing ice to build—could be critical for deglaciations. The intensity and extent of the STF northward displacements in the SH seem to decrease with progressing NH ice sheet deglaciation and parallel a weakening NH temperature response and amplitude of ITCZ shifts. The last and smallest frontal shift in offshore Australia may be related to the 8.2 ka event in the NH.
Supplementary Material
The supplementary material for this article can be found at https://doi.org/10.1017/qua.2021.12
Acknowledgments
We are grateful to both Yvon Balut (Institut Polaire Français Paul-Emile Victor) and Don Mackenzie (Commonwealth Scientific and Industrial Research Organisation) for help retrieving the two cores.
We are grateful for the pertinent comments from two anonymous reviewers as well as those from D. Booth and J. Shulmeister, who helped clarify many points in the original manuscript and suggested restructuring.
Financial Support
Jansen acknowledges funding for this research by the European Research Council under the European Community's Seventh Framework Programme (FP7/2007-2013) ERC grant agreement 610055 as part of the ice2ice project. Ninnemann acknowledges funding from the Research Council of Norway (THRESHOLDS project; grant 254964).