I. INTRODUCTION
With the progress of industry, water pollution has become a serious environmental issue. Reference Ho, Porter and Mckay1 Most of organic compounds which have high toxic and non-biodegradable properties have been released into the environment that pose a high risk to human health. Reference Chen and Ray2–Reference Shahat, Hassan and Azzazy4 Degradation of toxic organic pollutants in water has received considerable attention over recent years. To ease the pressure of environmental pollution, many approaches have been provided to deal with pollutants, such as biological treatment with enzyme Reference Guldhe, Singh, Mutanda, Permaul and Bux5 or microorganism, Reference Gao, Yang, Wang, Zhao and Sheng6 physical treatment of wastewater with flocculating agent, Reference Li, Luo, Hou and Han7 and photocatalytic treatment with catalysts. Reference Turchi and Ollis8 However, due to the harsh working conditions of biological treatment, especially microbial and enzyme on the environment (such as temperature, pH, and so on), small changes can inactivate enzymes or microorganisms to loss of their activity, which limits their application scope. Reference Rosal, Rodríguez, Perdigónmelón, Petre, Gómez and Agüera9–Reference Ried, Mielcke, Wieland, Schaefer and Sievers11 In recent years, semiconductor photocatalysis has been widely investigated for its potential application in environmental protection. Reference Hoffmann, Martin, Choi and Bahnemann12–Reference Chen, Jiang, Yu, Liu, Liu, Li, Huang, Tong and Chen16 TiO2, as a semiconductor photocatalyst, has obtained a large number of scientific researcher’s attention since discovered in 1972. Reference Nakata and Fujishima17 It is expected to be one of the most valuable photocatalysts due to its oxidative, chemically stable, economical and nontoxic characteristics. Reference Jiang, Zheng, Wang, Li and Sun18–Reference Jiang, Li, Wei, Jiang, Du and Chen30
As one of the most environmentally friendly and efficient photocatalyst, cuprous oxide (Cu2O) has received the attention by many researchers. Reference Hara, Kondo, Komoda, Ikeda, Kondo, Domen, Hara, Shinohara and Tanaka31–Reference He, Shao, Zheng and Zheng34 Cu2O has a cubic structure with a body-centered cubic packing of oxygen atoms with copper atoms occupying one half of the tetrahedral sites. Reference Xu, Wang and Zhu35 It is a p-type semiconductor and could find practical applications in solar energy conversion Reference Zhao, Shang, Song, Wang, Zhou, Lv and Zi36 hydrogen production by photocatalysis of water Reference Hara, Kondo, Komoda, Ikeda, Kondo, Domen, Hara, Shinohara and Tanaka31,Reference Nian, Hu and Teng37 and lithium-ion batteries as an electrode material. Reference Zhang, Yu, Wu, Hoster and Lou38 And it has many advantages, such as nontoxic, low price, good stability, good visible light response, and other advantages. Reference Gao, Liu, Xu, Wu, Wu and Jiang39 The photogenerated carriers can be produced in the sunlight, and the photoelectric conversion efficiency can reach upon to 14%. Reference Li, Xiong, Pan and Qian40 Therefore, it also can be used as an ideal photocatalytic candidate for degradation of organic pollutants.
However, Cu2O nanocatalysts are often complicated and troublesome in recycle process, because of time-wasting process of centrifugal separation, which could hinder the re-usability of catalysts in solution. Reference Tahir and Amin41 It is generally known that nanofiber materials are superior to the other materials due to their fascinating features of structural characteristics including high porosity and crisscross property, which are of benefit to the diffusion of substrate or product molecules onto/from active sites. Reference Yang, Chaudhari, Rajesh and Yu42 CNFs (carbon nanofibers) have the chemical similarity to carbon nanotubes, such as extremely large surface area and high mechanical strength which are suitable to be used as supporter materials. Using CNFs as supporter materials offer the significant advantages, such as low dosage, high catalytic activity, easy recycling, and excellent stability. Reference Jiang, Zheng, Wang, Li and Sun18,Reference Yu, Liu, Jiang, Liu, Yu, Chen, Li, Huang and Tong43–Reference Chen, Jiang, Yu, Liu, Liu, Li, Huang and Tong47
Rhodamine B (RhB) as a kind of common typical toxic organic pollutants, has been studied a lot for catalytic reaction. Reference Mi and Ahn48,Reference Mahlambi, Mahlangu, Vilakati and Mamba49 It can be monitored easily with high precision by ultraviolet-visible (UV-Vis) spectroscopy, the RhB had been chosen as the model reaction for catalysis in our work. Phenol is an organic compound with high toxicity, which is widely used in chemical and cosmetics industries. The presence of phenol in aqueous solution can produce serious consequences even the trace of concentration. Reference Fang and Chan50–Reference Keweloh, Heipieper and Rehm52 Therefore, it is significant to develop an efficient catalytic material for removing the phenol from wastewater. In this work, we used electrospun technology and carbonization methods to prepare composite CNFs (Cu2O/CNFs) containing cuprous oxide (Cu2O) nanoparticles. The as-obtained composite CNFs have been characterized by scanning electron microscopy (SEM), transmission electron microscopy (TEM), X-ray diffractometer (XRD), and X-ray photoelectron spectroscopy (XPS). The resultant Cu2O/CNFs exhibit efficient catalytic activity for the degradation of RhB and phenol. The possible mechanism for degradation of RhB and phenol was also discussed.
II. MATERIALS AND METHODS
A. Chemicals and material
Polyacrylonitrile (PAN, Mw = 150,000) was purchased from Aladdin Co. Ltd. (Shanghai, China). Copper acetate monohydrate, propanetriol, p-benzoquinone, RhB, phenol, and N,N-dimethylformamide (DMF, 99.5%) were purchased from Jingchun Chemistry Reagent Co., Ltd. (Shanghai, China). Hydroquinone, allomaleic acid, and formic acid were purchased from Caojing Chemistry Reagent Co., Ltd. (Hangzhou, China). Deionized water was used in all of the experiments was prepared by a Milli-Q Biocel reagent water system (Millipore, Billerica, Massachusetts). All other reagents were used as received without further purification.
B. Fabrication of Cu2O/CNFs
The Cu2O/CNFs were prepared according to the modified method described in the previous literature. Reference Chen, Jiang, Yu, Liu, Liu, Li, Huang and Tong47,Reference Fang and Chan50,Reference Huang, Jiang, Chen, Li, Liu, Tong and Chen53 Typically, 0.76 g PAN and 0.16 g copper acetate were firstly dissolved in DMF by stirring for several hours to obtain a homogeneous solution with a concentration of 16 wt%. Subsequently, about 10 mL of the spinning solution was transferred into a 10 mL injection syringe with a capillary tip having a 2.5 cm length and an outer diameter of 0.7 mm. The injection syringe was laid in an injection pump that set a solution injection speed at 0.12 mm/h. The receptor was a grounded metallic rotating receptor which was covered with aluminum foil and was set rotated at 500 rpm. There is a distance about 10 cm between the needle and receptor. The composite nanofibers were collected on the aluminum foil by electrospinning from a syringe at an applied electric positive voltage of +15 kV and the negative voltage of −2.0 kV. Then, the electrostatic spinning composite nanofibers were transferred to a tube furnace calcine. The samples were firstly heated at 120 °C for 1 h to remove the solvent and moisture. Then, the temperature was increased to 350 °C for 4 h in N2 atmosphere to carbonize. The heating rate was controlled at 4 °C per minute. After cooling, the composite carbonize nanofibers (Cu2O/CNFs) could be obtained.
C. Characterization
The microstructures and crystal phase of the as-prepared samples were analyzed with a Siemens Diffraktometer D5000 (Thermo Fisher Scientific (Eccublens) SARL, Ecublens, Switzerland) with Cu Kα radiation source at 35 kV, with a scan rate of 3° min−1 in the 2θ range of 10–80°. The ULTRA-55 (Carl Zeiss SMT Pte Ltd, Singapore, Singapore) field emission scanning electron microscopy (FE-SEM) at an accelerating voltage of 10 kV and JEM-2100 (JEOL, Ltd., Tokyo, Japan) TEM were used to characterize the morphologies of the as-prepared samples. XPS data were obtained with an ESCALab220i-XL (Thermo VG Scientific, Waltham, Massachusetts) electron spectrometer from VG Scientific using 300 W Al Kα radiation. The base pressure was about 3 × 10⁻⁹ mbar. The binding energies were referenced to the C 1s line at 284.6 eV from adventitious carbon.
D. Measurement of photocatalytic activity
The photocatalytic activity of the Cu2O/CNFs was investigated by the photodegradation of RhB and phenol. Prior to the catalytic degradation of RhB, a blank control group without any catalysts and oxidizing agent and three experimental groups containing Cu2O/CNFs (3 × 3 cm2, ∼15 mg) with 5% H2O2, Cu2O/CNFs (3 × 3 cm2, ∼15 mg) without H2O2 and CNFs (3 × 3 cm2, ∼6 mg) are designed, respectively. In a typical reaction, 10 mg/mL of RhB solution was prepared in 240 mL deionized water. After stirring for 30 min, all control and experimental groups were firstly placed in the dark for adsorption and desorption equilibrium. Then, the catalytic reduction of RhB was carried out in photodynamic reaction chamber with the temperature maintained at 20 °C by a circulating water system under visible light (500 W high-pressure Xenon lamp). The same volume of the mixture was taken out at the intervals of 10 min, and concentration of RhB in the solution was immediately recorded via UV-Vis spectrometer UV1902PC (Shanghai Aucy Scientific Instrument, Shanghai, Chiina) in the range of 200–650 nm.
Photodegradation of a phenol solution (10 ppm) was performed to evaluate the photocatalytic performance of the as-prepared samples, which was also carried out in photodynamic reaction chamber. The UV radiation source is 100 W high-pressure mercury lamp, its wave length range is 290–450 nm with the main wave crest at 365 nm. The as-prepared Cu2O/CNFs (3 × 3 cm2, ∼15 mg) were added into the 100 mL phenol solution. At given time intervals, a certain volume of the irradiated suspension was collected. The concentration of phenol was measured by UV-Vis spectrophotometer (UV1902PC) at λmax = 270 nm. To further explore the reaction course and analysis of intermediate products in the reaction process of the reaction of degradation process, high performance liquid chromatography (HPLC) were implemented. The solution collected was filtered and analyzed on an Aligent 1260 HPLC (Palo Alto, CA) with a Poroshell 120 EC-C18 column. The detection wave length was at 287 nm. The mobile phase was a mixture of methanol and water with a volume ratio of 50:50 and flow rate of 0.5 mL/min.
III. RESULTS AND DISCUSSION
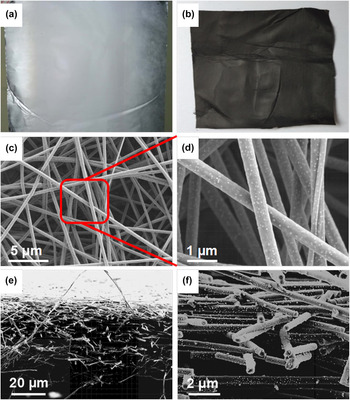
In this article, the electrospun Cu2O/CNFs are prepared by a convenient electrospinning method and following a carbonization treatment. The schematic representation for preparation of electrospun Cu2O/CNFs is shown in Fig. 1. Figures 2(a) and 2(b) show the digital pictures of the composite nanofibers prepared before and after carbonization treatment, respectively. After carbonization, the electrospun composite nanofibers still persist the membrane structure, but the color is altered from white to black. The morphology and structure of the composite CNFs were further analyzed by FE-SEM. From Fig. 2(c), it can be found that nanofibers display a uniform diameter around 450 nm. The large number of nanoparticles on the surface of the nanofiber can be found from Fig. 2(d). Figures 2(e) and 2(f) show the cross-section of the Cu2O/CNFs. The Cu2O/CNF membrane has a thickness around ∼40 μm, and these nanofibers show a network structure arranged in a crisscross pattern.
The schematic for preparation of Cu2O/CNFs via electrospinning and carbonization.

Digital photos of composite nanofibers before (a) and after (b) carbonation. The surface (c, d) and cross-sectional (e, f) morphologies of Cu2O/CNFs composite fibers.

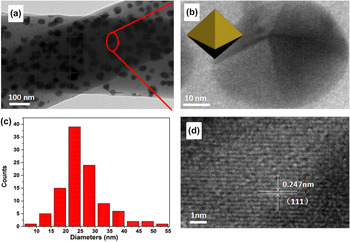
Figure 3(a) shows the TEM image of Cu2O/CNFs. It shows that the nanoparticles with similar shape and size are uniformly distributed on the surface and inner side of the nanofibers. The nanoparticles exhibit octahedron structure and lattice fringe d(111) = 0.247 nm, Reference Kuo and Huang54 as shown in Figs. 3(b) and 3(d). The size distribution is shown in Fig. 3(c), and the mean diameter of Cu2O is around 25 nm.
TEM (a, b) and HRTEM (d) images of Cu2O/CNFs samples, the crystal model of Cu2O in the nanofibers is displayed inset in (b), the diameter distribution histograms of Cu2O in the nanofibers (c).

The crystallographic structure of the Cu2O/CNFs is further confirmed by powder XRD analysis. As shown in Fig. 4(a), it can be found that the diffraction peaks with low intensities and wide range located between 10 and 20° corresponded to amorphous carbon phase, which was assigned as the d 002 layers, representing the presence of integral graphite crystal structure. Reference He, Qin, Zhang, Yang, Zhang and Yang55,Reference Asgher, Bhatti, Ashraf and Legge56 No detectable dopant-related peaks can be observed in Cu2O/CNFs except the typical octahedron structure of Cu2O crystal (JCPDS No. 99-0041) and the majority of the diffraction peaks could be indexed to the Cu2O phase and the relatively peaks at 2θ = 36.9°, 43.5°, 64°, and 77°, indexed to (111), (200), (220), and (222) plane reflections of Cu2O, respectively. Reference Xu, Wang and Zhu35 The UV-Vis diffusion reflectance spectra of the as-prepared Cu2O and Cu2O/CNFs are shown in Fig. 4(b). It can be seen that Cu2O shows excellent DRS signals in the range of 250–500 nm, while Cu2O/CNFs exhibit a stronger absorption in the range of 250–700 nm. The results indicate that immobilizing Cu2O onto CNFs improve the absorption in the visible light range, which is beneficial to increase the utilization efficiency of visible light. The band gap energy of the Cu2O/CNFs is estimated to be 2.0 eV on the basis of the relationship between (Ahν)2 and photon energy, as shown in Fig. 4(c). Room-temperature photoluminescence (PL) spectrum of obtained Cu2O and Cu2O/CNFs measured at an excitation wave length of 340 nm are shown in Fig. 4(d). A sharp near-band gap UV emission at ∼365 nm and a broad visible-band emission attributed to defects and impurities could be clearly observed. However, the intensity of the PL signal for the Cu2O/CNFs is lower than that of Cu2O in the visible light. It indicates that the obtained Cu2O/CNFs have a lower recombination rate of electrons and holes. This can be ascribed to the prevention of CNFs because the excited electrons could transfer to the CNFs.
XRD pattern of the as-prepared Cu2O/CNFs (a), UV-Vis diffuse reflectance spectra of Cu2O and Cu2O/CNFs (b). The relationship between (Ahν)2 and photon energy (c). Room-temperature PL emission spectra of Cu2O and Cu2O/CNFs (d).

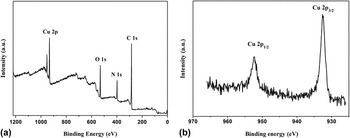
The bond energies of surface element for Cu2O/CNFs are confirmed by XPS analysis. Figure 5(a) shows the survey spectrum of the as-prepared Cu2O/CNFs. It exhibit prominent peaks of carbon, oxygen, nitrogen, and copper. Reference Sun, Wang, Hao, Han and Cao57 Figure 5(b) exhibits the high-resolution XPS spectrum of Cu 2p. Two peaks at binding energies of 932.49 and 953.32 eV can be obtained, which are corresponding to Cu 2p 1/2 and Cu 2p 3/2, respectively. Reference Abulizi, Yang and Zhu58
XPS spectra of as-prepared Cu2O/CNFs sample: survey spectrum (a) and high-resolution spectrum of Cu 2p (b).

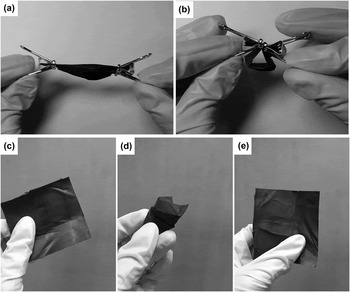
The as-prepared Cu2O/CNFs are expected to present excellent mechanical flexibility, enabling them to maintain the original dimensions after folding, bending [Figs. 6(a) and 6(b)], crushing, and releasing [Figs. 6(c)–6(e)]. The strategy has shown excellent versatility and scalability for potentially large-scale fabricating lightweight carbon-based nanofibrous products by employing specific textured matrices. And it also is beneficial to recycle use in the application of the liquid environment.
The flexibility test of composite fiber membrane, folding and bending (a and b), crushing and releasing (c-e).

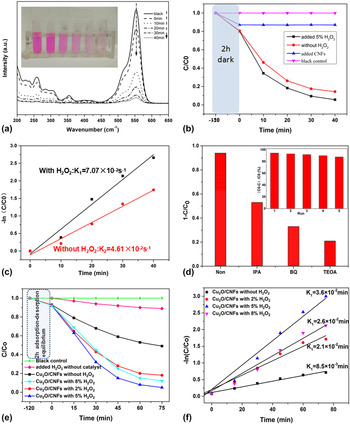
To evaluate the catalytic performance, the obtained Cu2O/CNFs are firstly investigated as catalysts for degradation of the RhB. Figure 7(a) shows the UV-Vis absorption spectra of RhB solution in the presence of Cu2O/CNFs with 5% H2O2. It is clearly seen that more than 90% of RhB can be decolored within 40 min. The inset in Fig. 7(a) shows the photographs of color of RhB solution with different reactive time. Plots of photocatalytic degradation of RhB in different condition are shown in Fig. 7(b). It can be observed that the concentration of RhB solution is almost not removed in blank control under 2 h dark treatment or visible light irradiation, while the concentration of RhB solution is reduced ∼10% with CNFs under 2 h dark treatment. It can be ascribed to absorption of CNFs due to its high porosity and interconnectivity. Significantly, the concentration of RhB with the presence of Cu2O/CNFs is lower than that with absence of Cu2O. It demonstrates that Cu2O/CNFs has the better catalytic activity over the CNFs. The plots of ln(C t /C 0) as a function of time for the reaction catalyzed by Cu2O/CNFs with different concentration of H2O2 are shown in Fig. 7(c). The kinetic reaction rate constant (k) is estimated from the slopes of the linear relationship. The k for the Cu2O/CNFs with 5% H2O2 and Cu2O/CNFs without 5% H2O2 are 7.07 × 10⁻² and 4.61 × 10⁻² s−1, respectively. It indicates that H2O2 can be worked with Cu2O/CNFs to form the Fenton reagent in the reaction system. To testify and explore the presence of main active radicals, 1.0 mM of isopropanol (IPA, a quencher of ˙OH), p-benzoquinone (BQ, a quencher of O2˙−) and triethanolamine (TEOA, a quencher of h+) are chosen as trapping agent for hydroxyl radicals (˙OH), superoxide radicals (O2˙−), and electron holes (h+). As shown in Fig. 7(d), it can be observed that the concentration of RhB decreased with addition of IPA, BQ, and TEOA into the reaction system. Therefore, it can be concluded that the h+, O2˙−, and ˙OH are the main active species. The result is consistence with our early report. Reference Jiang, Tang, Chen, Liu, Li, Huang and Chen29,Reference Chen, Jiang, Jiang, Li, Liu, Huang and Chen45 The inset in Fig. 7(d) shows photodegradation cycles of RhB in the presence of Cu2O/CNFs. The Cu2O/CNFs exhibit an excellent catalytic stability for degradation of RhB.
Absorption spectra of RhB solution with the presence of Cu2O/CNFs and 5% H2O2 (inset: the photographs of color of RhB using the Cu2O/CNFs as catalyst) (a). Plots of photocatalytic degradation of RhB in different condition (b). Plot of ln(C t /C 0) as a function of time for the reaction catalyzed by Cu2O/CNFs with different concentration of H2O2 (c). Photocatalytic degradation of RhB over various products trapping experiments for detecting of active species experiment during the photocatalytic degradation of RhB reaction by the addition of 1.0 mM IPA, TEOA, and BQ (d) (inset shows cycles for the photodegradation of RhB in the presence of Cu2O/CNFs). The concentration curves of phenol under different conditions (e). Plot of ln(C t /C 0) as a function of time for the reaction catalyzed by Cu2O/CNFs (f).

The photodegradation of phenol is evaluated under the UV irradiation and room temperature. Figure 7(e) shows the concentration curves of phenol under different reaction conditions. It can be found that phenol self-degradation is almost negligible under light irradiation without any catalysts. However, the concentration of phenol is reduced obviously after the Cu2O/CNFs have been added into the reaction system. It indicates that the Cu2O/CNFs are beneficial to remove phenol due to the adsorption of CNFs and catalytic effect of Cu2O. Moreover, the phenol degradation ratio can be further improved after adding hydrogen peroxide (H2O2) into the reaction system. Only ∼50% of phenol can be removed in the solution in the absence of H2O2. However, the phenol degradation ratio can be increased to 81.8, 95.3, and 88.2% with presence of 2, 5, and 8% of H2O2 in the solution. From these results, we can conclude the extra oxidant, H2O2, plays an important role to enhance the degradation reaction. On increasing the H2O2 concentration to 8%, no obvious degradation effect can be improved. A large amount of hydroxyl radicals may be produced instantaneously at the initial reaction under the action of the Cu2O/CNFs, but only a portion of hydroxyl radicals will take part in the oxidation of phenol, and other hydroxyl radicals will take part in reunion Reference Kurian and Sugunan59 (formula a) or oxidation by hydrogen peroxide Reference Chu, Wang, Dong, Liu and Sun60 (formula b). Hydrogen peroxide in the reaction system can be worked in coordination with Cu2O/CNFs to form a Fenton reagent. Reference Chu, Wang, Dong, Liu and Sun60
 $$^ \cdot {\rm{OH\ }} + {}^ \cdot {\rm{OH}} \to {{\rm{H}}_2}{{\rm{O}}_2}$$
 $${2^ \cdot }{\rm{OH}} + {{\rm{H}}_2}{{\rm{O}}_2} \to 2{{\rm{H}}_2}{\rm{O}} + {{\rm{O}}_2}$$
Figure 7(f) shows the plots of ln(C t /C 0) as a function of time for the degradation reactions of phenol. The pseudo first-order kinetics can be used to evaluate the kinetic reaction rate of the current catalytic reaction. The kinetic rate constant k app = 3.6 × 10⁻² min−1 in the presence of Cu2O/CNFs and 5% of H2O2 can be calculated from the rate equation ln(C t /C 0) = −k app t, where C 0 is the initial concentration of phenol and C t represents the concentration of phenol at the time t. It is 4.23 times of the kinetic rate constant for the reaction system without H2O2.
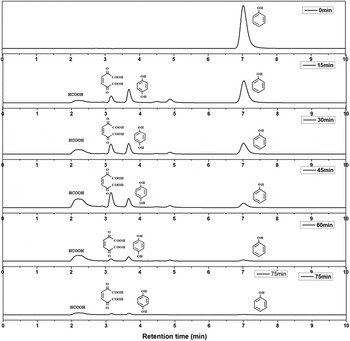
The HPLC was carried out to further explore intermediate products during the reaction degradation process. Previous studies have shown that phenol can produce many intermediates during the oxidation degradation reaction, such as hydroquinone, catechol, Reference Szewzyk, Szewzyk and Schink61 benzoquinone and o-benzoquinone, Reference Mijangos, Varona and Villota62 2,5-dioxide-3-hexene diacid and 2,4-hexadienoic diacid, Reference Santos, Yustos, Quintanilla, Rodríguez and García-Ochoa63 cis-butenedioic acid, allomaleic acid, oxalic acid, and formic acid. Reference Duprez, Delanoë, Barbier, Isnard and Blanchard64 Firstly, four compounds, phenol, hydroquinone, allomaleic acid, and formic acid, have been chosen as the standard samples. They have diffident retention times on HLPC that can determine the intermediate products of phenol degradation. The retention times for phenol, hydroquinone, allomaleic acid, and formic acid are 7.02 min, 3.67 min, 3.17 min, and 2.20 min, respectively. Figure 8 shows the HPLC spectra of different catalytic reaction times. Compared to the HPLC spectra of standard samples, it can be found that only a single signal peak appeared in the sample’s HPLC spectrum, and no impurities exist before reaction. The retention time is 7.03 min that is in agreement with the standard samples of phenol. By increasing the reaction time, other signal peaks with retention time at 2.20 min, 2.90 min, and 3.67 min can be observed, which are attributable to formic acid, cis-butenedioic acid, and hydroquinone, respectively. The intensity of phenol decreased gradually with prolonging the reaction time. And intensity of other intermediates increased firstly and then decreased or disappeared. At the initial stage (∼15 min), two peaks with retention time at 4.50 and 4.85 min can be observed, which are attributable to benzoquinone and o-benzoquinone. However, the intensity of these peaks decreased gradually and disappeared finally after reaction for 75 min. Similar trends also can be observed for other intermediates. It indicates the intermediates can be further transferred and degraded during the reaction process.
HPLC spectra obtained at different catalytic reaction time.

Combined with previous reports, Reference Wang, Yu and Sun65–Reference Zhang, Zhao, Geng, Guo, Wan and Yang69 we conclude a possible mechanism for degradation of phenol. Under UV irradiation, the electrons on the valence band (VB) of the Cu2O are jumped into the conduction band, which makes the existence of a large number of holes at VB. At the same time, hydrogen peroxide is decomposed into hydroxyl radicals in the presence of Cu2O/CNFs. The holes and hydroxyl radicals have strong oxidation ability. The hydroxyl radicals and holes attack firstly on phenol with assistant of CNFs. Hydroquinone and catechol are the initial intermediates for phenol degradation due to the interaction between of phenol and hydroxyl radicals. Reference Szewzyk, Szewzyk and Schink61 They will be further oxidized into benzoquinone and o-benzoquinone. The presence of hydroquinone in the intermediates has been confirmed in the reaction system. Benzoquinone is easily oxidized into p-benzoquinone. Because the retention time of benzoquinone may be located between hydroquinone and catechol, we believe that the retention time at 4.477 and 4.870 min may be benzoquinone and catechol. Benzoquinone and catechol can be further oxidized into cis-butenedioic acid and allomaleic acid and then fumaric acid. Fumaric acid is finally degraded into small molecular substances such as formic acid. Carbon dioxide and H2O can be formed at that final stage.
IV. CONCLUSION
In summary, hybrid Cu2O nanoparticles supported on CNFs were prepared via combination of electrospinning and carbonization treatments. The morphology, composition, and structure of the resultant CNFs were characterized by SEM, TEM, XPS, and XRD. Due to the high efficient catalytic properties of Cu2O and excellent flexibility of Cu2O/CNFs, the obtained hybrid CNFs had been used as a photocatalyst to degradation of RhB and phenol with assistant of visible and UV irradiation, respectively. The possible mechanism of RhB and phenol degradation was also discussed. The resultant hybrid CNFs offer the significant advantages, such as low dosage, high catalytic activity, easy recycling and excellent stability.
ACKNOWLEDGMENTS
This work was financially supported by the National Natural Science Foundation of China (51373155), Collaborative Innovation Center for Modern Textile Technology of Zhejiang Province (2011-Program) (20160202), and “521 Talents Training Plan” in Zhejiang Sci-Tech University.