I. INTRODUCTION
In recent years, environmental pollution has become an issue calling for urgent attention. Semiconductor photocatalytic process, known as a novel, highly efficient and “green” pollution-controlling process,Reference Fujishima and Honda1, Reference Yu, Yang, Yu, Cao, Li and Zhou2 has shown great potential to align with the “zero” waste scheme in the water/wastewater industry due to its low cost, environmental friendly, and sustainable treatment. This advanced redox technology has been widely demonstrated to remove persistent organic compounds and microorganisms in water.Reference Yu, Yu, Leung, Ho, Cheng, Zhao and Zhao3 Among various semiconductors, titanium dioxide (TiO2) has been regarded as one of the most promising photocatalysts due to its excellent photoactivity, chemical stability, and nontoxicity.Reference Krysa and Jirkovsky4–Reference Zhang, Wang, Zakaria and Ying6
TiO2 is an important functional inorganic material and it exists mainly in three crystal phases in nature: rutile (tetragonal space group P42/mnm), anatase (tetragonal, space group I41/amd) and brookite (orthorombic, space group Pbca).Reference Ovenstone and Yanagisawa7 In most photocatalytic applications, anatase is usually regarded as the most active crystal phase among the three occurring forms of TiO2.Reference Augustynski8–Reference Li and Gray10 Most of the synthetic processes favor the forming of anatase, rutile, or a mixture of anatase/rutile. These two phases are extensively studied as photocatalysts mainly due to their easy synthesizability. In contrast, the brookite phase is rarely studied, ascribing the lack of interest to the difficulties in obtaining its pure form; furthermore, it is reported that brookite has higher rate of photocatalytic activities than that of rutile and anatase.Reference Ohtani, Handa, Nishimoto and Kagiya11 Recently, the synthesis of pure brookite TiO2 with different morphologies such as nanorods, nanotubes, and nanoflowers has been reported.Reference Li and Gray10, Reference Kandiel, Feldhoff, Robben, Dillert and Bahnemann12, Reference Xie, Lü, Liu and Shu13 It has been known that anatase powders with a small fraction of rutile or brookite phase, such as commercial TiO2 Degussa P25, show enhanced photocatalytic activity compared with pure anatase powders due to the “mixed-phase effect,” which promoted the charge separation and hindered the recombination between the two phases.Reference Li and Gray10 The mixture of brookite phase and anatase phase still remains fascinating, however, reports on brookite/anatase mixed-phase TiO2 and their photocatalytic activity are quite few.
Herein, pure brookite, mixed-phase brookite/anatase, and pure anatase TiO2 were prepared via a facile hydrothermal process; the ratio of mixed-phase brookite/anatase can be tuned by simply changing the reaction pH value. The photocatalytic activity of these as-prepared samples was evaluated by photocatalytic degradation of rhodamine B (Rh B) aqueous solution under visible light irradiation. The enhanced activity was analyzed on the base of the strucutre and surface property of the samples.
II. EXPERIMENTAL
A. Preparation of TiO2 nanoparticles
All chemicals used were analytical grade and used without further purification. Samples with different brookite/anatase ratios were synthesized by the following procedure: sodium hydroxide (NaOH) (2 M) solution was slowly added into titanium sulfate [Ti(SO4)2] (1 M) solution [NaOH and Ti(SO4)2 was in molar ratio of 4:1] under vigorous stirring, yielding an amorphous TiO2 suspension, and the amorphous TiO2 suspension was stirred for 5 h and left still overnight. The resulting suspension was filtered and redispersed in water. The synthetic conditions were optimized by adjusting the pH value of the collected precipitate with sulfuric acid (H2SO4) or NaOH. Afterward, the above mixture was sealed in the autoclave and placed into an electric furnace held at 180 °C for 36 h. The autoclave was then cooled in air. The resulting precipitate was separated by centrifugation, washed with water several times, collected, and then dried at 80 °C in an oven.
B. Characterization
The phase purity and crystal structure of the samples were determined by x-ray powder diffraction (XRPD) using a Bruker D8 advance x-ray diffraction (Bruker AXS Company, Karlsruhe, Germany) equipped with Cu Kα radiation (λ = 1.5406 Å). Phase composition and crystallite sizes of the obtained powders were estimated by the x-ray line broadening technique based on the Hall’s Equation and Scherrer’s formula. Transmission electron microscopy (TEM) images were taken on a TEM instrument (TECNAI12, Phillips, Eindhoven, Netherlands). UV-vis diffuse reflectance spectra of the samples were measured using an UV-vis spectrophotometer (UV-2450, Shimadzu, Japan). The reflectance spectra (FL) of the samples were obtained using a Cary Eclipse Scanning UV-vis System (Varian, Salt Lake City, UT) equipped with sphere diffuse reflectance accessory. Raman scattering was performed on a Renishaw (In Via, Renishaw, UK) spectrometer using a 532 nm laser source.
C. Photocatalytic activity
The photocatalytic degradation of Rh B was conducted using a set of homemade device. In a typical run, 0.1 g of the photocatalyst was suspended in 100 mL of 10 mM Rh B aqueous solution. The mixture was vigorously stirred for 30 min to ensure the establishment adsorption-desorption equilibrium among the photocatalyst, Rh B and water before irradiating with visible light. After establishing this precipitate procedure, visible illumination was supplied by a self-ballasted 1000 W xenon lamp (λ ≥ 410 nm), and 5 mL mixture was sampled every 30 min. The concentration of Rh B was monitored by UV-vis spectrometer and the absorbance was probed with UV-vis diffuse reflectance spectra. In line with the absorbance, the degradation (De) was estimated as follows:
 $$D_{\rm{e}} \, = \,[(C_0 - C)/C_0 ]\, \times \,100\% \, = \,[(A_0 - A)/A_0 ]\, \times 100\% ,$$
where C 0 and C are the concentrations of Rh B before and after degradation, respectively. A 0 and A are the corresponding absorbance values before and after degradation, respectively.
III. RESULTS AND DISCUSSION
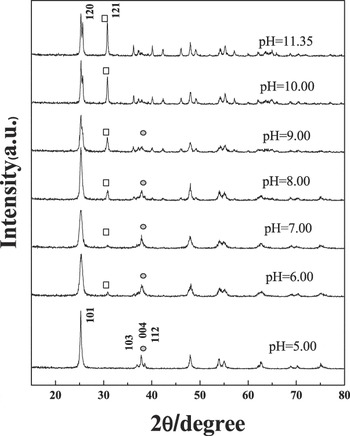
The XRD patterns of all these as-synthesized TiO2 were exhibited in Fig. 1. According to diffraction peak positions and strength, the diffraction peaks of TiO2 samples were complied with the standard pattern of brookite phase (vide Joint Committee on Powder Diffraction Standards specifications JCPDS 29-1360), with pH value varying from 11.35 to 10.00. When the pH value was controlled between 9.00 and 6.00, mixed-phase TiO2 with tunable brookite/anatase ratios was obtained, and the brookite/anatase ratios declined as the pH value decreased from 9.00 to 6.00. Seen from the XRD patterns, there came forth a characteristic diffraction peak of anatase TiO2 (JCPDS 21-1272) as soon as the pH value was adjusted below 10.00. It became evident that there was a gradual transition from brookite to anatase in mixed-phase TiO2 with the pH value continuously declining from 10.00 to 5.00. When the pH value was 5.00, the characteristic peak of brookite disappeared and the crystal pattern of TiO2 was completely transformed into pure anatase. Therefore, it is obvious that the pH value controlled in hydrothermal synthesis determines the crystal type and phase content. Since the energies of the three phases are sufficiently close to one another, they can be reversed by small differences in surface energy.Reference Naicker, Cummings, Zhang and Banfield14 We infer that the phase transformation in a hydrothermal solution happens via a hydroxylation-precipitation pathway, followed by reprecipitation of a more stable phase.
XRD patterns of TiO2 at different pH values. ⃞ stands for a characteristic peak of brookite and ○ stands for a distinguished peak of anatase.

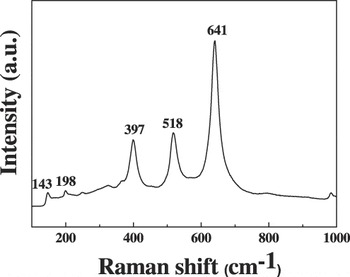
As the diffraction peaks of crystal faces of anatase (101) and brookite (120) overlapped, it was difficult to distinctively determine the existence of the two crystal forms. The characteristic diffraction peaks of the crystal faces of brookite (121) were observed at 2θ = 31°, which is an evidence of the existence of the brookite crystal form. Similarly, the existence of anatase phase can be confirmed by the “three sharp peaks” [crystal face (103), (004), and (112)] and other diffraction peaks compared with the standard anatase XRD pattern. The XRD patterns revealed that the intensity of diffraction peaks located at 2θ = 31° reduced from top to bottom in Fig. 1, while the characteristic peaks of anatase phase could be readily discerned from its (004) diffraction, indicating that the brookite composition in mixed-phase TiO2 decreased as the pH value decreased. In agreement with the XRD result, the Raman spectrum of the samples prepared at pH = 5.00 exhibits vibrational peaks at 143, 198, 397, 518, and 641 cm−1Reference Olivares, Zuluaga, Ortega, Murelaga, Alonso-Olazabal, Urteaga, Amundaray, Alonso-Martin and Etxebarria15, as shown in Fig. 2. These characteristic vibrational peaks match well with the standard spectrograph of anatase TiO2. Moreover, the vibrational peaks associated with other crystal types of TiO2 were not observed, indicating that the obtained samples are exclusively composed of anatase phase.
Raman spectrum of TiO2 at pH = 5.00.

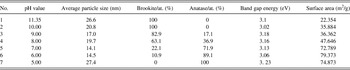
The average particle size of TiO2 with different pH values was estimated using Scherrer’s equation (shown in Table I). Pure brookite TiO2 has the maximum size, more than 20 nm. With the pH value decreased, the samples were gradually transferred from spindle shape to cosh shape and then to cubic shape, which can be seen from Fig. S1. The phase content of a sample can be calculated from individual diffraction peaks on the basis of Eqs. (2) and (3) below.
 $$W_{\rm{B}} \, = \,{{K_{{\rm{brookite}}} \times I_{121}^{{\rm{brookite}}} } \over {K_{{\rm{brookite}}} \times I_{121}^{{\rm{brookite}}} + K_{{\rm{anatase}}} \times I_{101}^{{\rm{anatase}}} }},$$
 $$W_{\rm{A}} \, = \,1 - W_{\rm{B}} ,$$
Physicochemical characteristics of pure brookite, pure anatase, and mixed-phase TiO2 nanocrystals.

where W B, W A are the weight fractions of brookite and anatase respectively, the optimized correction coefficients K brookite and K anatase were found to be 2.721 and 0.886, respectively.Reference Xu and Zhang16I 101, I 121 represent the integrated intensities of the anatase (101) and brookite (121) peaks, respectively. The phase composition of the samples and some parameters are summarized in Table I.
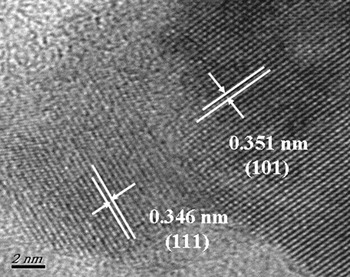
Figure 3 shows a high-resolution electron micrograph (HRTEM) of samples prepared at pH = 8.00. The interplanar crystal spacing was measured, which confirms that brookite and anatase coexisted from microcosmic angle. The interplanar crystal spacings were 0.351 and 0.346 nm, in conformity with the interplanar crystal spacing of anatase TiO2 (101) (theoretical calculation d 101 = 0.352 nm) and brookite TiO2 (111) (theoretical calculation d 111 = 0.347 nm), respectively.
HRTEM images of anatase/brookite mixed-phase TiO2 prepared at pH = 8.00.

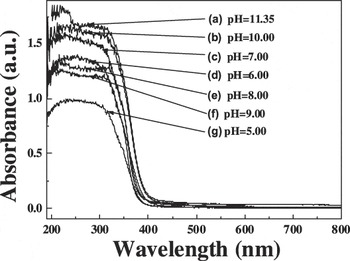
It was reported that the photocatalytic activity was affected by samples’ capability of light absorption and the absorption threshold. The UV-visible diffusion reflectance spectra (UV-vis DRS) of the as-prepared brookite, anatase, and mixed-phase TiO2 are shown in Fig. 4. A strong absorption due to the interband transition was observed at ∼400 nm.Reference Xie, Lü, Liu and Shu13 It can be speculated that band gaps of brookite TiO2 and brookite/anatase mixed-phase TiO2 were smaller than that of anatase TiO2. The band gap, E g, is usually estimated from the absorption edge wave length of the interband transition according to the following formula:
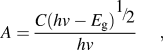 $$A = {{C{\rm{(}}hv - E_{\rm{g}} {\rm{)}}^{{\raise0.7ex\hbox{${\rm{1}}$} \!\mathord{\left/ {\vphantom {{\rm{1}} 2}}\right.\kern-\nulldelimiterspace}\!\lower0.7ex\hbox{$2$}}} } \over {hv}},$$
UV-vis DRS patterns of TiO2 prepared with various pH values.

where A is the absorbency, h is Planck constant, and C is the proportional coefficient. These calculated data were shown in Table I.
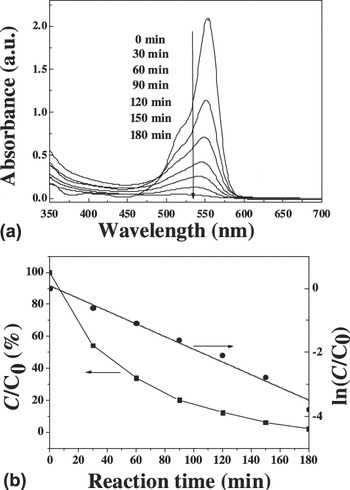
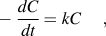
The photocatalytic activity of samples was evaluated by photocatalytic degradation of Rh B aqueous solution under visible-light irradiation. As shown in Fig. 5(a), the Rh B exhibits a characteristic peak at 550 nm. It is evident that the maximum absorption wave length of the dye gradually shifts to blue with the light illumination time extended, indicating that ethyl is dissociated gradually during the photocatalytic degradation of Rh B, and finally undergoes complete degradation. In this process, chromogenic aromatic ring of Rh B is effectively dissociated under sufficiently long reaction time. When the reaction time is long enough, such as 3 h, the degradation rate reaches as much as 97.87%. Degradation kinetics is monitored by the change of concentration of Rh B aqueous solution. Figure 5(b) shows the dependence of the concentration (C) of Rh B normalized against the initial reacting concentration (C 0). Figure 5(b) plots ln(C/C 0) against the reaction time (t) line, indicating that the degradation reaction of Rh B follows the first-order kinetics:
 $$ - \,{{dC} \over {dt}} = kC,$$
(a) Absorption spectra of the Rh B aqueous solution at different times after the start of the photocatalytic reaction under visible-light irradiation with assistance of the mixed-phase TiO2 prepared at pH 8.00. (b) The normalized concentration of the Rh B aqueous as a function of reaction time in both linear (■) and logarithmic (●) scale.

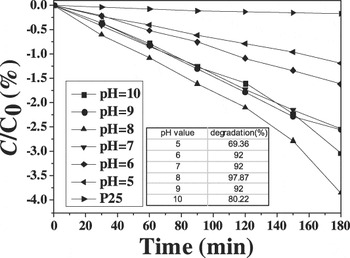
where C is concentration of the Rh B aqueous solution, t is reaction time, and k is a rate constant, which is ∼0.02 min−1 calculated from results shown in Fig. 5(b). The linear relationship of ln(C/C0) and t further confirms that the Rh B is steadily decomposed on TiO2 nanoparticles under visible irradiation. Figure 6 plots the comparison of the photocatalytic activity of samples prepared at different pH values. Pure brookite TiO2 or pure anatase shows less degradation rate, i.e., 80.22% and 69.39%, respectively. Mixed-phase TiO2 prepared at pH = 9.00, pH = 7.00, and pH = 6.00 show higher photocatalytic activity in decomposing Rh B aqueous solution at around 92% after 3 h irradiation. The Rh B aqueous solution with the mixed-phase TiO2 nanoparticles prepared at pH 8.00 (containing 63.1% brookite and 36.9% anatase, respectively) illustrates the best activity under visible light illumination. The degradation constants of pH = 10, 9, 8, 7, 6, 5, P25 were 0.01625, 0.01479, 0.02013, 0.0142, 0.00913, 0.00645, 0.000983 min−1, respectively.
Photocatalytic degradation of Rh B aqueous solution using TiO2 prepared with various pH values, the inset is exact degradation ratio of Rh B aqueous solution.

The specific surface area and adsorption property of TiO2 reveal that the adsorption of dyes is very small in the dark. The chemical photocatalytic reaction plays a major role in degrading Rh B aqueous solution. In summary, the mixed-phase TiO2 show good photocatalytic efficiency in degradation of Rh B aqueous solution under simulated sunlight, relating to their crystal form and heterojunction effect between brookite and anatase phase. The heterojunction between anatase and brookite TiO2 may promote the separation of photoelectrons/holes at the interface. What is more, good crystallinity and large surface area may also facilitate the contact probability of catalyst surface and Rh B, enhance the active site of the response and accelerate the photocatalytic degradation reaction of Rh B aqueous solution.
IV. CONCLUSIONS
We successfully designed and synthesized pure brookite, anatase, and brookite/anatase mixed-phase TiO2 via hydrothermal reaction by adjusting pH values. The samples were gradually transferred from spindle shape to cosh shape and then to cubic shape with the pH value decreased. The degradation results of Rh B aqueous solution showed that mixed-phase TiO2 was much more efficient than the pure phase TiO2. The photocatalytic activity varied with the change of the brookite/anatase ratio. Mixed-phase TiO2 exhibited the best photocatalytic activity especially when the sample was prepared under pH = 8. The heterojunction effect of brookite and anatase played an important role in the remarkable improvement of the photocatalytic activity.
Supplementary Material
Supplementary materials can be viewed in this issue of the Journal of Materials Research by visiting http://journals.cambridge.org/jmr.
ACKNOWLEDGMENTS
This work was partly supported by the National Natural Science Foundation of China (Grant No. 21003065), Natural Science Foundation of Jiangsu Province (Grant No. BK2010166), and Industry High Technology Foundation of Jiangsu (BE2010144).