INTRODUCTION
Building on a methodology developed during doctoral research at the University of Edinburgh (Thacker Reference Thacker2016), the Scottish Medieval Castles & Chapels C-14 Project (hereafter SMCCCP) has been investigating medieval masonry buildings across Scotland through programs of landscape, buildings and materials analysis which includes radiocarbon (14C) analysis of Mortar-Entrapped Relict Limekiln Fuels (hereafter MERLF). This paper will summarize evidence from one of five case studies undertaken during the pilot phase of that project, at Achanduin Castle on the island of Lismore in Scotland.
The increased importance of this particular study for the wider research is predicated on the broad range of architectural, documentary and archaeological sources of evidence now associated with this site, some of which has emerged since the initial SMCCCP work was undertaken. The complementary character of this evidence has allowed the castle’s constructional chronology to be calculated with a precision which is rare in a Scottish medieval context, and that allows us to re-evaluate the relationships between these different sources and the independent 14C data.
PREVIOUS EVIDENCE
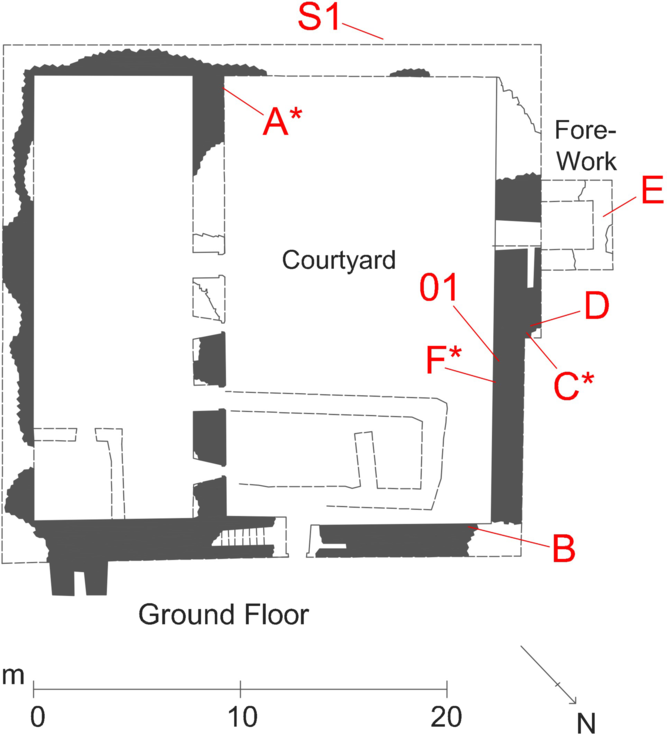
The remains of Achanduin Castle are highly ruinous but still present a complete sub-square building footprint; with lime-bonded rubble masonry walls 1.4–2.4 m thick enclosing a space approximately 22 m square (RCAHMS 1975: 168–171). A series of collapses has reduced the southeast and southwest enclosure walls to very fragmentary ground-floor levels, but in the northeast and northwest these survive up to 6 m high and display a series of intramural openings at first-floor level. These openings clearly suggest that the north and southeast areas of the enclosure were associated with multi-story building ranges of some description, although excavations undertaken at the site between 1970 and 1975 discovered no very conclusive evidence for a completed structure in the former of these positions (Caldwell et al. Reference Caldwell, Stell and Turner2015; Caldwell and Stell Reference Caldwell and Stell2017). A large probable upper hall building was discovered at the southeast end of the enclosure, but at ground floor level the northwest appears to be dominated by a roughly cobbled courtyard, with a main entrance in the northeast curtain, and a smaller entrance and “forework” in the northwest (Caldwell et al. Reference Caldwell, Stell and Turner2015; Caldwell and Stell Reference Caldwell and Stell2017; see Figure 1).
Sample contexts plotted onto a ground floor plan of Achanduin Castle (original image: DP 037606 © Crown Copyright: HES). Labeled without the ACL site code prefix, this includes MERLF samples A–F, mortar sample 01 and sandstone sample S1. MERLF samples with an asterisk have been subject to radiocarbon analysis.

Before this excavation and beyond, the sub-rectangular form of this enclosure had been regarded as clear evidence that Achanduin was one of the earliest stone castles surviving in Scotland. For MacGibbon and Ross (Reference MacGibbon and Ross1887: 75–77), this was a “first period” 1200–1300 AD structure, similar to the earliest castle buildings in the west highlands and islands because of its “great wall of enceinte”; while for the Dunbar and Duncan (Reference Dunbar and Duncan1971: 8) and the RCAHMS (1975: 26–27) “Achadun” belonged “to a well-defined group of early Scottish stone castles” which included a range of apparently late-12th to early-13th century sub-rectangular enclosure buildings such as Sween, Innes Chonnell, Skipness, Tarbert, and Roy (see also Dunbar Reference Dunbar and MacLean1981: 44–45).
The structural and historical basis for some of these typological comparisons is open to challenge and many of these comparative buildings are currently under investigation by the SMCCCP, but the castle at Achanduin is now also associated with a suite of documentary and archaeological evidence which appears to constrain its constructional chronology within much narrower limits. This includes a 1304 grant to bishop Andrew of Argyll of 5 pennylands “…propinquiori castro seu manerio de Achychendone…” and an earlier 1240 charter granting 14 pennylands of land to bishop William of Argyll which included “…Barmaray et duas nummatas terre de Achacendune…” but contains no reference to a building at all (Paul Reference Paul1882: 670 no 3136; Duncan and Brown Reference Duncan and Brown1957: 211, 219; Turner Reference Turner1998). These documents have been widely accepted as a terminus ante quem (TAQ) and terminus post quem (TPQ) respectively and on that basis the building’s constructional chronology can be constrained to a period between 1240 and 1304 AD (cf. RCAHMS 1975: 171).
Within the Scottish medieval castles’ corpus this is already a very refined chronology, but further architectural and archaeological evidence suggests a very late constructional date for Achanduin within this range is most probable. This includes mason’s marks, dressed mouldings and a sandstone provenance similar to those found in the neighboring cathedral church choir, and a halfpenny coin from the reign of John Balliol (1292–1296) discovered during the 1970s excavations at the castle “beneath rubble make-up filling a crevice in the bedrock in the [north corner of the] courtyard” (RCAHMS 1975: 171; Turner Reference Turner1998: 649; Caldwell et al. Reference Caldwell, Stell and Turner2015: 350, illus. 7; Caldwell and Stell Reference Caldwell and Stell2017: 15). Once more, this comparative evidence is not unproblematic; since Lismore cathedral choir has itself been ascribed to a range of different 14th-century dates and even held up as an example of the challenges faced by scholars in ascribing constructional chronologies to Scottish medieval buildings (Fawcett Reference Fawcett2011: 146–147). The latter coin evidence has recently been published posthumously and will be considered in more detail below; but the combination of numismatic and charter evidence now appears to effectively narrow the date of the castle’s construction to the 12 years between 1292 and 1304.
This interpretive narrative is convincing and supported by the discovery of 14th century coins and some pottery in overlaying occupational materials. Apart from the broad architectural typologies with which interpretations began and somewhat tenuous comparisons with the neighboring cathedral choir, however, it is salient that none of this supporting evidence is directly associated with the constructional fabric of the upstanding building itself.
METHODOLOGY: SURVEY, SAMPLING, AND ANALYSIS
Achanduin Castle and the surrounding environment were subject to preliminary survey during the SMCCCP pilot study. Building survey included characterisation of masonry styles and close examination of surviving mortars with the naked eye and ×10 hand lens up to a height of 2 m. A walkover survey of the surrounding foreshore was undertaken to investigate current inter- and sublittoral sand and gravel compositions, and fragments of local woodland were examined to establish current taxonomic variety.
The sample assemblage removed from the castle building comprised fragments of mortar, MERLF, and a single sample of sandstone. Sample contexts identified within the castle structure were recorded photographically, with hand measurements from adjacent wall faces plotted onto the RCAHMS ground-floor plan of the site (Figure 1). The location of a loose sample of aggregate collected from the foreshore was recorded by hand-held GPS. All samples were removed using hand tools from exposed contexts, stored in labeled and sealed sample bags within hard plastic containers, before air-drying at room temperature for 48 hr to remove surface moisture and repackaging. Samples containing suspected MERLF fragments were then stored in a laboratory refrigerator.
Thin sections of the mortar, sandstone and aggregate samples were prepared by Mike Hall at the University of Edinburgh to a standard 30-µm thickness. The mortar and sandstone samples were initially sawn into slices approximately 5 mm thick and dried on a hotplate for 48 hr at 50°C before consolidating one freshly cut surface on each sample with epoxy resin. Once cured, the consolidated surface was ground down on a horizontal lap to provide a flat surface for mounting onto a 76 × 25 mm glass slide. A cut-off saw and horizontal lap were then used to remove most of the excess material from the slide, before the section was hand polished and cover-slipped. Preparation of the aggregate sample proceeded by the same general methodology, but this loose material was cast into a resin block before initial slicing. Prepared thin sections were subject to microscopic examination in plane and polarised light, using a Leica DMLM polarising microscope with image capture by LAS V4.0 software.
Archaeobotanical analysis was undertaken with Mike Cressey of CFA Archaeology, Musselburgh. Wood-charcoal fragments were fractured to expose transverse sections for examination in reflected light to ×40 and identified to genus level (where possible) with reference to standard anatomical literature (Schweingruber Reference Schweingruber1990). Sample morphology was also characterized; including biostructural curvature, presence of pith, bark or heartwood/sapwood boundaries, number of annual rings, and an approximate sample age estimated. Where the analysis identified single-entity wood-charcoal MERLF fragments of short-lived taxonomy and/or morphology, then these were weighed, wrapped in aluminium foil, and placed in sealed sample bags to be considered for 14C analysis.
Selected single entity MERLF wood-charcoal samples were submitted to the Scottish Universities Environmental Research Centre (SUERC) for 14C analysis. All submitted samples were subject to acid-base-acid (ABA) pretreatment and graphitization at the SUERC laboratory, before analysis by accelerator mass spectrometry (AMS) (Dunbar et al. Reference Dunbar, Cook, Naysmith, Tripney and Xu2016).
RESULTS
Buildings Analysis
As above, the northeast and northwest walls of the main enclosure survive up to approximately 6 m above current ground level. A small stretch of the southwest curtain also remains standing, but the rest of the enclosure walls are largely reduced to a few low courses above ground level. The fragmentary remains of the cross-wall separating the southeast range from the courtyard stand to 2 m high at the southwest end and here it abuts the southwest enclosure wall. This abutment suggests the cross-wall is likely to have been constructed secondarily and may provide further context for the lack of evidence for internal walls defining the north range. That the “forework” abuts the external face of the northwest curtain is also clear.
All walls are dominated by undressed limestone blocks with some basalt and minor use of gneiss and granite. Contrasts in stone sorting and emplacement technique are evident, however, depending on height and context. The lowest three courses of the external face of the northeast wall, for example, have been laid in relatively formal courses with contact between large, often edge-laid, facing blocks. By courses four to five, however, there are panels of smaller stones interposed between the larger slabs, and in the higher courses much of the wall face is composed of smaller, irregularly faced and informally placed, flat-laid stone. Internally, excepting some isolated sections which contain larger stones, the wall faces are dominated by smaller flat-laid limestone rubble blocks similar to those in the higher courses of the external wall faces. Changes in ground level along this wall lend a greater heterogeneity, as different course heights are visible, but lateral bonding is generally very poor throughout, both internally and externally.
All upstanding wall cores and faces are lime-bonded, with small surviving fragments of mortar coating displayed on both internal and external wall faces. A very comprehensive in-situ assessment of the mortar archaeology of the whole structure is compromised by widespread loss of mortar materials from wall cores and large areas of superficial calcite recrystallization. This latter process, which obscures surface compositions, is particularly evident in the northeast curtain wall, where some more recent consolidation is also suspected. Constructional mortar survival and compositional visibility is better in the northwest curtain and southeast cross-wall, however, and these materials appear compositionally consistent and continuous from deep core to wall face and coating in all visible contexts.
No clear compositional contrasts were noted in the constructional mortars of the enclosure walls, southeast range cross-wall, or northwest “forework”, however, and (in all three) these materials may be summarized as:
-
Coarse yellow-colored wood-fired limestone-lime mortars, included with a moderate concentration of altered meta-limestone kiln relicts grading up to 25 mm+, and a low concentration of probable MERLF fragments.
-
The mortar has been tempered with a poorly sorted mixture of rounded quartz-rich sands and gravels (including limestone, basalt, schist/gneiss and red granite) ranging up to 30 mm diameter with a very high sub-mm fraction.
Lab-Based Analysis
Petrographic thin section analysis confirmed these in-situ interpretations of the mortar’s composition. ACL.01 presents a poorly sorted composite material composed of a mixture of calcareous, non-calcareous and carbonaceous inclusions supported by a light brown carbonate matrix. The thin section is included with a high concentration of angular polycrystalline metalimestone grains dominated by equidimensional calcite crystals oriented parallel to the long axis of each grain. These calcareous clasts display widespread evidence for textural alteration, forming a cryptocrystalline dark brown carbonate in close optical continuity with the supporting carbonate (mortar) matrix. Section ACL.01 is also included with a high concentration of large rounded clasts of meta-limestone grading to 17 mm, a range of rounded polycrystalline quartz-rich lithogies (including some mica schist, micaceous sandstone, quartzite) and granite to 7 mm. Finer grades are dominated by rounded to very angular monomineralic quartz, but no shell fraction was noted. The textural contrast between the rounded unheated limestone temper and the angular heated limestone kiln-relics is striking.
All six MERLF fragments within the sample assemblage were wood-charcoal. This small assemblage included three fragments of Quercus sp. two of Betula sp. and one which was too degraded to characterize. None of these fragments displayed evidence of bark, but the three which presented the shortest-lived taxonomical and/or morphological character were selected for AMS 14C analysis and results are presented in Table 1 below.
Site context, archaeobotanical character, 14C measurements and calibration date ranges for selected MERLF samples from Achanduin Castle. All samples were removed from in-situ constructional mortars consistent with phasing. All samples were single entity. The curve column denotes biostructural curvature. δ13C values are all reasonably close to the expected –25‰ level. Calibrated date ranges were calibrated by the probability method using OxCal v.4.3.2 (Bronk Ramsey Reference Bronk Ramsey2017) and the IntCal13 atmospheric curve (Reimer et al. Reference Reimer, Bard, Bayliss, Beck, Blackwell, Bronk Ramsey, Buck, Cheng, Edwards, Friedrich, Grootes, Guilderson, Haflidason, Hajdas, Hatté, Heaton, Hoffmann, Hogg, Hughen, Kaiser, Kromer, Manning, Niu, Reimer, Richards, Scott, Southon, Staff, Turney and van der Plicht2013) at 5-year resolution. Calibrated date ranges have been rounded out to 10 years.

MODELING
Chronological estimates for the construction of Achanduin Castle were generated using Bayesian techniques within the OxCal program, and full details of these models are included in the ESM. Four main “outlier” approaches were trialled (Bronk Ramsey Reference Bronk Ramsey2009), with the 14C measurements included within a General Outlier model in Model 1 (which also included a Tau Start Boundary; ESM 1.0–3.0), a modified Charcoal Outlier model in Model 2 (with the time constant reduced to 100 years to reflect the shorter lived fuel; ESM 4.0–6.0), the default OxCal Charcoal Outlier model in Model 3 (with a time constant of 1000 years; ESM 7.0–9.0), and no outlier at all in Model 4 (ESM 10.0–12.0). The 14C measurements, MERLF sample taphonomy, and building phasing form the fundamental basis of all these models and, to render the effect of other types of evidence on constructional estimates more explicit, documentary and excavated coin evidence has been introduced incrementally in sub-models labeled a–c. Each of these pieces of evidence were critically reassessed before inclusion in the model, beginning with sample taphonomy and building phasing.
Recent work has highlighted that the principal potential sources of disjuncture between MERLF 14C measurements and constructional completion of masonry structures are old-wood effect, lime transport and maturation times, and building construction times (Thacker Reference Thacker2020). The first of these has been mitigated in the Achanduin study by the selection of MERLF fragments for 14C dating with relatively short-lived characteristics. The lack of bark evidence in the wider assemblage is problematic, but two of the three selected samples are Betula sp. which is generally regarded as the shortest-lived common tree in Britain and reportedly very rarely reaches 100 years old (Rackham Reference Rackham2003: 311). Characterisation of the last sample as short-lived Quercus sp. is supported by the narrow range of 14C measurements returned across the assemblage; these are statistically consistent at the 5% significance level (T′=4.2, T′(5%)=6.0, ν=2; Ward and Wilson Reference Ward and Wilson1978), indicating they could all be of the same actual age.
The use of local materials for mortar manufacture suggests transport times were short, and the high concentration of limekiln relicts within surviving mortars suggests these were deposited with little or no post-kiln/pre-deposition maturation period. All exposed mortars were characterized in-situ as wood-fired metalimestone-lime mortars tempered with nearby foreshore sands and gravels, and that interpretation is supported by petrographic thin section analysis of representative mortar samples from the castles northwest curtain wall and archaeobotanical analysis of mortar-entrapped relict limekiln fuel fragments from all three structures. These component materials are all consistent with the exploitation of local resources; Achanduin is located on a small island dominated by Dalradian metalimestone bedrock and surrounded by foreshore aggregates, and the Quercus-Betula composition of the limited MERLF assemblage is consistent with the vegetational history of the wider region.
Assessment of construction times and phasing at Achanduin Castle is interrelated. Previous interpretations have suggested the southeast range cross-wall and enclosure walls are coeval and this medium-sized enclosure castle is unlikely to have taken more than a decade to construct. These interpretations are consistent with the relatively homogeneous character of the constructional mortars throughout the structure and with the narrow range of measurements returned by 14C analysis of the MERLF assemblage. It is reasonable, therefore, to interpret the abutment between the southeast range cross-wall and surrounding enclosure walls (noted during building survey) as a “construction break” within a broadly single-phase event.
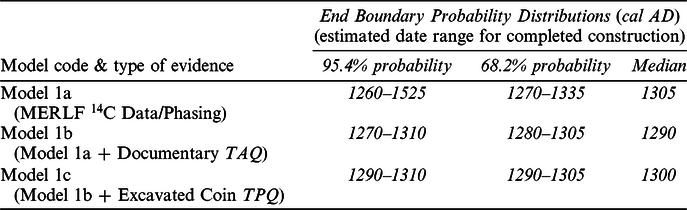
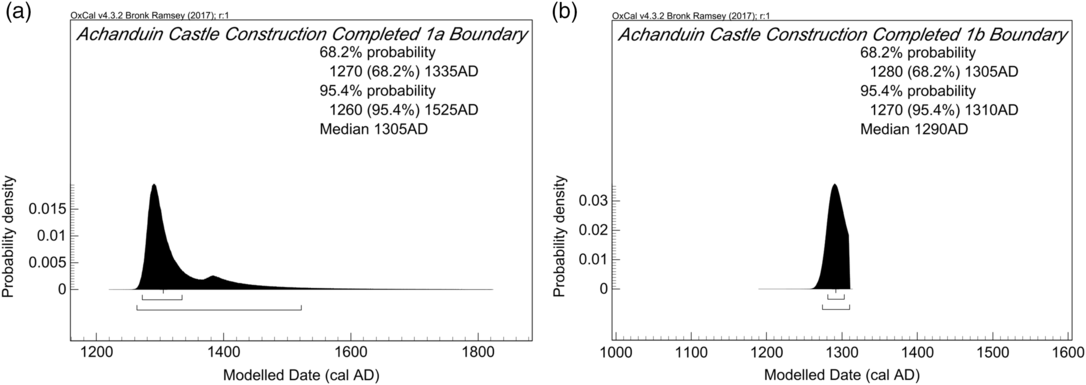
Informed by the above analysis, all three 14C measurements were constrained within a single phase, in all models. There will be some chronological disjuncture between the 14C measurements and the completion of Achanduin Castle (since there was no bark evidence in the MERLF samples, the castle may have taken several years to construct, and all samples were removed from low wall courses), but this is likely to be minimal. In Model 1, therefore, each sample was tagged with a 5% outlier probability within an OxCal “General” outlier model (Bronk Ramsey Reference Bronk Ramsey2009), with a Tau start boundary and the End Boundary probability distribution regarded as the best estimate for completion of the building (ESM 1.0). This “standalone” Model 1a suggests construction of Achanduin Castle was completed in 1260–1525 cal AD (95.4% probability) probably 1270–1335 cal AD (68.2% probability; Achanduin Castle Construction Completed 1a; ESM Figures S1 and S2).
Despite some “tenuous” evidence for an earlier structure on the site (Caldwell et al. Reference Caldwell, Stell and Turner2015: 349, illus. 20), the probable 1270–1335 constructional estimate generated by the standalone Model 1a at 68.2% probability suggests the 1304 charter reference may very well refer to the substantially upstanding and predominantly single-phase building sampled by the SMCCCP, and in this instance confirms that this building was very unlikely to have been standing when the earlier 1240 charter was sealed. Although the RCAHMS (1975, 171) speculated that “building was in progress during the last years of the 13th century”, Turner cautioned that the 1304 reference may not necessarily refer to a completed structure and on this basis his suggested date of 1310 is accepted here as a TAQ for the first multidisciplinary Model 1b (ESM 2.0). Model 1b suggests Achanduin Castle was completed in 1270–1310 cal AD (95.4% probability) probably 1280–1305 cal AD (68.2% probability; Achanduin Castle Construction Completed 1b; ESM S3 & S4).
In the absence of a definitive statement regarding the stratigraphic relationship between the courtyard and curtain wall fabric, it is not possible to demonstrate how the (1292 × 1296) mint date of the excavated Balliol coin relates to the constructional chronology of the main enclosure walls. From the statement that these walls were generally founded on bedrock it is reasonable to suggest that the roughly cobbled courtyard surface is secondary to the basal courses of the enclosure walls, and this is problematic since it has been reported that these coin types “would have circulated all over Scotland until well into the second half of the 14th century” (Holmes Reference Holmes, Caldwell and Stell2017: 34). A mixture of bedrock and rubble filled bedrock cavities such as that within which the late 13th century coin was found, however, do reportedly underlie both the courtyard cobbling and enclosure walls (Caldwell and Stell Reference Caldwell and Stell2017: 15, 25, 29, 72), and the constructional estimate from Model 1b already suggests the construction of the enclosure walls and the minting of the coin are closely contemporary. It is possible that all of these events are separated by chronologically insignificant construction breaks and so, in line with previous interpretations, the 1292 × 1296 coin is accepted as a TPQ for completion of the castle building in the second multidisciplinary Model 1c (ESM 3.0). Model 1c suggests construction of Achanduin Castle was completed in 1290–1310 cal AD (95.4% probability) probably 1290–1305 cal AD (68.2% probability; Achanduin Castle Construction Completed 1c; ESM Figures S5 & S6).
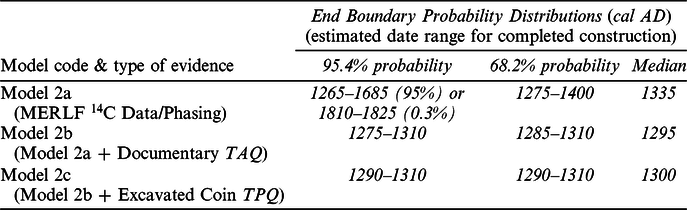
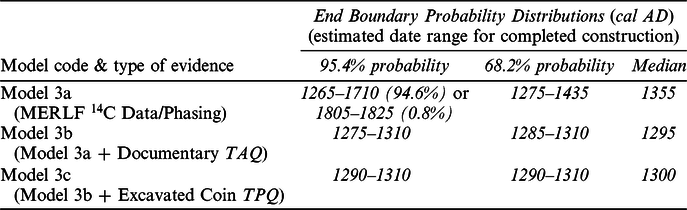
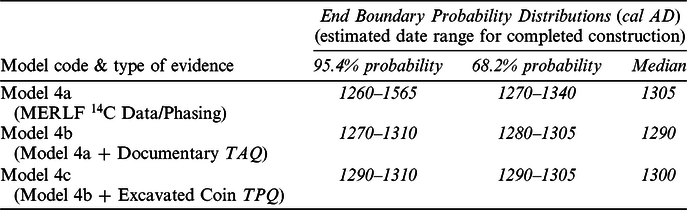
These Model 1(a–c) constructional estimates are summarized in Table 2, with the distributions from the other three modeling approaches summarized in Tables 3–5. Agreement indices in all models are above 60%.
End Boundary Probability Distributions generated by Achanduin Castle models 1a, 1b & 1c. Plotted in OxCal v4.3.2 (Bronk Ramsey Reference Bronk Ramsey2017), calibrated using IntCal13 atmospheric curve (Reimer et al. Reference Reimer, Bard, Bayliss, Beck, Blackwell, Bronk Ramsey, Buck, Cheng, Edwards, Friedrich, Grootes, Guilderson, Haflidason, Hajdas, Hatté, Heaton, Hoffmann, Hogg, Hughen, Kaiser, Kromer, Manning, Niu, Reimer, Richards, Scott, Southon, Staff, Turney and van der Plicht2013), models 1a–c all employ a Tau Start Boundary, General Outlier model and 5% Outlier probabilities. Probability distributions have been rounded out to 5 years. See ESM 1.0 to 3.0 for further details of model specifications.

End Boundary Probability Distributions generated by Achanduin Castle models 2a, 2b & 2c. Plotted in OxCal v4.3.2 (Bronk Ramsey Reference Bronk Ramsey2017), calibrated using IntCal13 atmospheric curve (Reimer et al. Reference Reimer, Bard, Bayliss, Beck, Blackwell, Bronk Ramsey, Buck, Cheng, Edwards, Friedrich, Grootes, Guilderson, Haflidason, Hajdas, Hatté, Heaton, Hoffmann, Hogg, Hughen, Kaiser, Kromer, Manning, Niu, Reimer, Richards, Scott, Southon, Staff, Turney and van der Plicht2013), models 2a–c all employ exponential Charcoal Outlier models modified to a 100 year old time constant, and all measurements are tagged with 100% Outlier probabilities. Distributions have been rounded out to 5 years. See ESM 4.0 to 6.0 for further details of model specifications.

End Boundary Probability Distributions generated by Achanduin Castle models 3a, 3b & 3c. Plotted in OxCal v4.3.2 (Bronk Ramsey Reference Bronk Ramsey2017), calibrated using IntCal13 atmospheric curve (Reimer et al Reference Reimer, Bard, Bayliss, Beck, Blackwell, Bronk Ramsey, Buck, Cheng, Edwards, Friedrich, Grootes, Guilderson, Haflidason, Hajdas, Hatté, Heaton, Hoffmann, Hogg, Hughen, Kaiser, Kromer, Manning, Niu, Reimer, Richards, Scott, Southon, Staff, Turney and van der Plicht2013), models 3a–c all employ the default (1000 year) OxCal Charcoal Outlier model and 100% Outlier probabilities. Probability distributions have been rounded out to 5 years. See ESM 7.0 to 9.0 for fuller model specifications.

End Boundary Probability Distributions generated by Achanduin Castle models 4a, 4b & 4c. Plotted in OxCal v4.3.2 (Bronk Ramsey Reference Bronk Ramsey2017) and calibrated using IntCal13 atmospheric curve (Reimer et al Reference Reimer, Bard, Bayliss, Beck, Blackwell, Bronk Ramsey, Buck, Cheng, Edwards, Friedrich, Grootes, Guilderson, Haflidason, Hajdas, Hatté, Heaton, Hoffmann, Hogg, Hughen, Kaiser, Kromer, Manning, Niu, Reimer, Richards, Scott, Southon, Staff, Turney and van der Plicht2013), models 4a–c do not employ an Outlier model. Probability distributions have been rounded out to 5 years. See ESM sections 10.0 to 12.0 for further details of model specifications.

DISCUSSION
With reference to the summary Tables 2–5 presented above, it is the constructional estimates generated by the “standalone” Achanduin Castle models (1a, 2a, 3a & 4a) which are most significant for our interpretations of relatively short-lived MERLF 14C data from sites where other forms of chronological evidence are not available. All four main modeling approaches have generated End Boundary probability distributions for Achanduin Castle which are consistent with the accepted date of construction of the surviving structure at both 68.2% and 95.4% probability. The most refined of these estimates was generated by Model 1a, although Models 1a and 4a have generated very similar distributions at 68.2% probability. The estimates generated by Models 2a and 3a are much less refined at both 95.4% and 68.2% probability and the medians are late. This reflects the more positively skewed character of the End Boundary distributions associated with both of these models (with heavier positive shoulders on the main peak and longer positive tails), although the narrower time constant imposed on Charcoal Outlier model 2a has effectively constrained that feature; thereby slightly increasing precision and median accuracy in the constructional estimate.
The first “multidisciplinary” models presented by the study (1b, 2b, 3b & 4b) once more demonstrate the complementary character of MERLF 14C data (from primary phase fabric) and documentary sources (which are often late incidental references to a completed building of some sort) (Thacker Reference Thacker2016, Reference Thacker2019, Reference Thacker2020). The documentary TAQ associated with Achanduin effectively truncates the positive side of the End Boundary distributions generated by all the “standalone” models (see, for example, Figure 2), whatever their shape, resulting in similar very refined constructional estimates in all “multidisciplinary” models at both 95.4% and 68.2% probability. These models still only include evidence associated with the upstanding building (without any evidence excavated from below ground), but present more refined date range estimates for Achanduin Castle than was previously possible from architectural typology and documentary evidence alone, and all of these distributions support the suggestion that the castle had not been constructed when the earlier 1240 charter was sealed.
End Boundary probability distributions generated by Model 1a (left) and Model 1b (right).

The last “multidisciplinary” models presented here (1c, 2c, 3c & 4c) generate very similar and even more refined constructional estimates at 95.4% and 68.2% probability. We are essentially back to the previously accepted constructional date, but now including evidence from the upstanding castle walls.
CONCLUSION
This paper has presented the first independent dating evidence relating to the construction of Achanduin Castle. The study also presents further convincing evidence that Bayesian techniques can generate robust “standalone” chronological estimates for the construction of masonry buildings from the 14C data returned by MERLF fragments, where that data is carefully situated within a wider program of landscape, buildings and materials analysis. The consistency between the standalone constructional estimates generated by all four model specifications presented above, and the refined date range which can be ascribed to Achanduin Castle on the basis of other types of (architectural, documentary and archaeological) evidence, promotes greater confidence in the estimates generated for other masonry buildings where similar MERLF assemblages pertain, but other dating evidence is absent.
The Achanduin Castle study is currently limited to only three 14C measurements and, as more data from the SMCCCP emerges, further discussion of the relationship between MERLF sample character, assemblage sizes, measurement error margins, outlier distributions, and other types of dating evidence is required. Within the single phase Achanduin Castle study presented above, the most precise and apparently accurate standalone End Boundary distributions were generated by imposing a Tau Start Boundary on the data and tagging each 14C measurement with a low Outlier probability in a General Outlier Model. Indeed, the 1270–1335 cal AD (68.2% probability; Achanduin Castle Construction Completed 1a; ESM figs S1 & S2) constructional estimate generated by this model 1a is remarkably consistent with the building’s previously accepted 1292–1304 AD ascription. Where documentary evidence for the building’s existence was also included in the model specification, however, then very precise constructional estimates for the upstanding building were generated by all four modeling approaches, at both 68.2% and 95.4% probabilities.
ACKNOWLEDGMENTS
The pilot phase of the Scottish Medieval Castles & Chapels C14 Project was funded by Historic Environment Scotland’s Archaeology Programme, with 14C analysis funded through their 14C call-off contract. Mike Hall of Edinburgh University prepared the material thin sections. Archaeobotanical analysis was undertaken by Mike Cressey with the author. 14C analysis was undertaken by the Scottish Universities Environmental Research Centre (SUERC). David Caldwell kindly commented on an earlier draft of this paper, which was then improved by the comments of two anonymous peer reviewers. Any errors are my own.
SUPPLEMENTARY MATERIAL
To view supplementary material for this article, please visit https://doi.org/10.1017/RDC.2020.57