










1. Introduction
It follows from [Reference Newman29] that more than 99% of all species amounting to over 5 billion species that ever lived on Earth are estimated to be extinct. Some scientists estimate that up to half of presently existing plant and animal species may become extinct by 2100 [Reference Wilson41]. Humans can cause extinction of a species through overharvesting, pollution, habitat destruction and other influences. A variety of conservation programmes have been designed in order to prevent further extinctions. One of the most effective method to protect endangered species from extinction is establishing protection zones. The role of protection zones in preventing population from extinction has been investigated in [Reference Cui, Li, Mei and Shi7–Reference Du and Liang11, Reference Du, Peng and Wang13, Reference Du and Shi15–Reference He and Zheng18, Reference Li and Wu24–Reference Li and Yamada26, Reference Oeda30, Reference Wang and Li40, Reference Zeng, Zeng and Liu42] and the references therein for reaction–diffusion models.
In the present work, we are interested in the effects of the location of a protection zone and the boundary condition on the long-time behaviour of an endangered species whose spatiotemporal evolution was described by a reaction–diffusion model with a protection zone. That is our model is given by the following form:

where the general Robin condition is imposed on $x=0$ with $b\geq 0$
 ; $L_2 > L_1 \geq 0$
 are two constants and the protection zone is $[L_1,\, L_2]$
 . Throughout this paper, we set

then $L$ and $L_1$
 are the length and the starting point of the protection zone, respectively. In the protection zone, the growth of the species is governed by a monostable nonlinearity $f(u)$
 which is a $C^1$
 function satisfying

The nonlinearity $g(u)$ is used to describe the evolution species which obeys the strong Allee effect [Reference Allee1] out of the protection zone. In order to describe the strong Allee effect, a typical reaction function is the so-called ‘bistable’ nonlinear terms; see, for example, [Reference Courchamp, Berec and Gascoigne6, Reference Keitt, Lewis and Holt20, Reference Lewis and Kareiva23, Reference Maciel and Lutscher28, Reference Wang, Shi and Wei39] and the references therein. Here, we assume that the bistable nonlinear term $g(u)$
 is a $C^1$
 function and satisfies

for some $\theta \in (0,\,1)$ , $g'(0)<0$
 , $g'(1)<0$
 and

Next, we need to give the interface conditions at $x=L_i$ for $i=1,\, 2$
 . Here, we assume that the population density is continuous and the population flux is conserved at the interface points $x=L_i$
 . Then the interface conditions at $x=L_i$
 are given by

where $u(t,\, L_i-0)$ and $u_x(t,\, L_i-0)$
 represent, respectively, the left limit value and the left derivative of $u$
 with respect to $x$
 at $x=L_i$
 , and $u(t,\, L_i+0)$
 and $u_x(t,\, L_i+0)$
 are respectively the right limit value and the right derivative of $u$
 with respect to $x$
 at $x=L_i$
 . Especially, if $L_1=0$
 , then the conditions for $x=L_1$
 in (1.5) should be removed automatically.
Combining (1.1) and (1.5), we are led to the following system:

The initial function $u_0$ belongs to $\mathscr {X}(h)$
 for some $h>0$
 , where

Problem (Reference Courchamp, Berec and GascoigneP) with $b=\infty$ (i.e. $u_x(t,\,0)=0$
 ) has been studied recently in [Reference Du, Peng and Sun10]. The authors in [Reference Du, Peng and Sun10] obtained that there are two critical values $0< L_* \leq L^*$
 which affect the long-time behaviour of the solutions significantly. More precisely, in the small protection zone case ($L< L_*$
 ), there is a vanishing–transition–spreading trichotomy result; in the medium-sized protection zone case ($L_*< L< L^*$
 ), there is a transition–spreading dichotomy result; only spreading happens in the large protection zone case ($L>L^*$
 ). They also found that $L_*$
 is increasing in $L_1$
 , which yields that the protection zone should start from somewhere near $0$
 , see [Reference Du, Peng and Sun10] for more details. And any other relevant works with free-boundary conditions can be found, for instance, in [Reference Sun and Han34–Reference Sun and Li36].
When $L=0$ , that is to say, there is no protection zone in the environment, some special cases of (Reference Courchamp, Berec and GascoigneP) were studied by many authors. Among them, Du and Matano [Reference Du and Matano14] considered the case where $b=\infty$
 and obtained a rather comprehensive analysis of the dynamical behaviour of solutions by introducing a parameter in the initial value. And any other relevant works can be found, for instance, in [Reference Aronson and Weinberger2, Reference Chen, Lou, Zhou and Giletti5, Reference Zlatoš43] and the references therein. In the case where $L_1=0$
 and $L_2=\infty$
 , the authors in [Reference Aronson and Weinberger2] also studied problem (Reference Courchamp, Berec and GascoigneP), and obtained the asymptotic behaviour of solutions and the existence of the travelling wave solutions, see [Reference Aronson and Weinberger2] for more details.
Our primary goal in this paper is to examine the role of the protection zone by studying the dynamics of the reaction–diffusion model (Reference Courchamp, Berec and GascoigneP).
Throughout the paper, unless otherwise specified, in addition to the previously imposed conditions (1.2)–(1.4) on $f,\,g$ , we further assume that
(H) The functions $f,\,g$ are globally Lipschitz and $g(u)< f(u)\ \mbox { for all } 0 < u < 1.$

For any given $h>0$ and $u_0 \in \mathscr {X}(h)$
 , it is known from [Reference Du, Lou, Peng and Zhou12, Reference Jin, Peng and Shi19, Reference von Below38] that (Reference Courchamp, Berec and GascoigneP) admits a unique nonnegative solution $u\in C^{1,2}((0,\,\infty )\times ([0,\,\infty )\setminus (\{ L_1\}\cup \{ L_2\})))\cap C^{\gamma /2,1+\gamma }((0,\,\infty )\times [0,\,\infty ))$
 for any $\gamma \in (0,\,1)$
 , and $u$
 exists for all time $t>0$
 . By the comparison principle and classical theory for parabolic equations, we see that $u$
 is uniformly bounded with respect to both space and time. Therefore, one may expect that the long-time behaviour of solutions will be determined by nonnegative and bounded stationary solutions of (Reference Courchamp, Berec and GascoigneP), that is, the solutions of the following elliptic equation:

A phase-plane analysis shows that all nonnegative and bounded stationary solutions of (1.7) can be classified as follows (cf. § 2):
(1) Trivial solution: $v\equiv 0$
 ;
(2) Active states: $v(x)=u^*(x)$
is a positive and increasing solution of (1.7), subject to $u^*(\infty )=1$;(3) Ground states: $v(x)=U(x)$
is a positive solution of (1.7), and when $x>L_2$, $U(\cdot )=V(\cdot -z)$ where $z\in \mathbb {R}$ and $V$ is the unique positive symmetrically decreasing solution of
\[ V'' + g(V)=0,\quad V(0)=\theta^*,\ V({\pm}\infty)=0, \]where $\theta ^*\in (\theta,\,1)$
is uniquely determined by the condition
\[ \int_0^{\theta^*}g(s){\rm d}s=0; \]
(4) Positive periodic solutions: $v(x)$
is a positive solution of (1.7) and when $x>L_2$, $v(x)=P(x-z_1)$, where $z_1\in \mathbb {R}$ and $P$ is a periodic solution of $v'' + g(v)=0$ satisfying $0<\min P<\theta <\max P<\theta ^*$.


Now, let us list some possible situations on the asymptotic behaviour of the solutions to problem (Reference Courchamp, Berec and GascoigneP):
• vanishing: $\lim _{t\to \infty }u(t,\,\cdot )=0$
uniformly in $[0,\,\infty )$;• spreading: $\lim _{t\to \infty }|u(t,\,\cdot )-u^*(\cdot )|=0$
locally uniformly in $[0,\,\infty )$;• transition: $\lim _{t\to \infty }|u(t,\,\cdot )-U(\cdot )|=0 \mbox { locally uniformly in} [0,\infty )$
,


where $u^*(x)$ and $U(x)$
 are the active state and ground state, respectively.
Denote
 \begin{align}
L_*:&=\displaystyle
\dfrac{1}{\sqrt{f'(0)}}\arctan\Bigg[\sqrt{-\dfrac{g'(0)}{f'(0)}}\,{\cdot}\,\dfrac{(b\sqrt{-g'(0)}+1){\rm
e}^{2\sqrt{-g'(0)} L_1}\,{-}\,(b\sqrt{-g'(0)}-1)}{(b\sqrt{-g'(0)}+1){\rm e}^{2\sqrt{-g'(0)} L_1} +(b\sqrt{-g'(0)}-1)}\Bigg]\nonumber\\ &
\displaystyle \quad+\dfrac{1}{\sqrt{f'(0)}}\arctan
\sqrt{-\dfrac{g'(0)}{f'(0)}}.
\end{align}
By the proof of assertion (I) in theorem 1.1, we know that if $0< L< L_*$ , then problem (1.7) has a ground state. This allows us to define

In § 3, one obtains that $L^*$ is bounded.
We are now in a position to give a satisfactory description of the long-time dynamical behaviour of problem (Reference Courchamp, Berec and GascoigneP).
Theorem 1.1 Assume that (H) holds. For any given $b\geq 0$ and $L_2>L_1\geq 0,$
 let $L:=L_2-L_1,$
 $u$
 be the solution of (Reference Courchamp, Berec and GascoigneP) with $u_0=\sigma \phi$
 for some $\phi \in \mathscr {X}(h),$
 $h>0$
 and $\sigma >0$
 . Moreover, let $L_*$
 and $L^*$
 be given in (1.8) and (1.9), respectively. The following assertions hold.
(I) (Small protection zone case) If $0< L< L_*$
, then there exist $\sigma _*,\,\ \sigma ^*\in (0,\,\infty )$ with $\sigma _*\leq \sigma ^*$ such that the following trichotomy holds:
(i) Vanishing happens when $0<\sigma <\sigma _*;$
(ii) Transition happens when $\sigma \in [\sigma _*,\,\sigma ^*;$]
(iii) Spreading happens when $\sigma >\sigma ^*$
.
(II) (Medium-sized protection zone case) If $L_*< L^*$
and $L_*< L< L^*$, then there exists $\sigma ^*\in (0,\,\infty )$ such that the following dichotomy holds:
(i) Transition happens when $\sigma \in (0,\,\sigma ^*];$
(ii) Spreading happens when $\sigma >\sigma ^*$
.
(III) (Large protection zone case) If $L>L^*$
, then spreading happens for all $\sigma >0$.


It is known from theorem 1.1 that if the length of protection zone $L$ satisfies $L>L_*$
 , then the species will survive in $(0,\,\infty )$
 all the time regardless of its initial data. Thus, $L_*$
 is called the effective length of protection zone.
Next, based on the property of the effective length $L_*$ of protection zone, we give the following result.
Theorem 1.2 Assume that (H) holds. For any given $b\geq 0$ and $L_2>L_1\geq 0$
 , let $L:=L_2-L_1$
 . The following assertions hold.
(i) When $0\leq b< {1}/{\sqrt {-g'(0)}}$
, then the bigger $L_1$ is, the shorter effective length of protection zone is, and the shortest effective length is $({2}/{\sqrt {f'(0)}})\arctan \sqrt {-({g'(0)}/{f'(0)})}$, which is independent of $b$.(ii) When $b> {1}/{\sqrt {-g'(0)}}$
, then the smaller $L_1$ is, the shorter effective length of protection zone is, and the shortest effective length is $({1}/{\sqrt {f'(0)}})[\arctan \sqrt {-({g'(0)}/{f'(0)})}+\arctan ({1}/{b\sqrt {f'(0)})}]$.(iii) When $b= {1}/{\sqrt {-g'(0)}}$
, then the effective length of protection zone is identically equal to $({2}/{\sqrt {f'(0)}})\arctan \sqrt {-({g'(0)}/{f'(0)})}$, regardless of the choice of $L_1$.


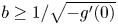
From theorem 1.2, we can deduce that if $b$ is large (i.e. $b\geq 1/\sqrt {-g'(0)}$
 ), then the protection zone should start from somewhere near $0$
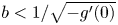
 ; while if $b$
 is small (i.e. $b<1/\sqrt {-g'(0)}$
 ), then the protection zone should start from somewhere away from $0$
 , and as far away from $0$
 as possible.
The rest of our paper is organized as follows. In § 2, we prepare some preliminary results, including the analysis of the associated stationary solution problems, the comparison principle and a general convergence result. Section 3 covers the dynamical behaviour of solutions of (Reference Courchamp, Berec and GascoigneP) and the proofs of theorems 1.1 and 1.2. In § 4, we end the paper with some discussion on our results.
2. Some preliminary results
In this section, we present some preliminary results which will be frequently used later.
2.1 Stationary solutions
Clearly, a so-called stationary solution of (Reference Courchamp, Berec and GascoigneP) is a solution of (1.7). We will use the phase-plane analysis to describe the solutions of (1.7). In the $qp$ -plane, each solution of $q''+f(q)=0$
 corresponds to a trajectory $p^2=F(q)-C_1$
 , where $p:=q'$
 , $C_1$
 is a constant and $F(q):=-2\int _0^qf(v){\rm d}v$
 . At the same time, each solution of $q''+g(q)=0$
 gives a trajectory $p^2=G(q)-C_2$
 where $C_2$
 is a constant and $G(q):=-2\int _0^qg(v){\rm d}v$
 . Moreover, for any solution of (1.7), the connection condition at $x= L_i$
 ($i=1,\,\ 2$
 ) is fulfilled whenever there are some $C_1$
 and $C_2$
 such that the trajectory $q'^2=F(q)-C_1$
 intersects the trajectory $q'^2=G(q)-C_2$
 . Noting that such an intersection point may not be unique, thus several stationary solutions of (Reference Courchamp, Berec and GascoigneP) can be derived from different trajectories.
It is easy to check that the trajectory $p^2=-2\int _0^qg(v){\rm d}v$ passes through the point $(\theta ^*,\, 0)$
 in the phase plane, which is denoted by $\Gamma ^*$
 ; for any $\beta \in (0,\,1)$
 , the trajectory $p^2=2\int _q^\beta f(v){\rm d}v$
 passes through the point $(\beta,\, 0)$
 , which is denoted by $\Gamma _\beta$
 . Using the phase-plane analysis, together with condition (H), we are able to obtain the following lemma.
Lemma 2.1 For any $\beta \in (0,\,\theta ^*)$ , there are exactly two points of intersection of $\Gamma ^*$
 and $\Gamma _\beta$
 . If $\beta =\theta ^*$
 , there is a unique point $(\theta ^*,\,0)$
 of intersection of $\Gamma ^*$
 and $\Gamma _{\theta ^*}$
 . If $\beta \in (\theta ^*,\,1)$
 , then $\Gamma ^*$
 does not intersect $\Gamma _\beta$
 .
Based on lemma 2.1, we shall list all possible bounded and nonnegative stationary solutions of (Reference Courchamp, Berec and GascoigneP) in the following lemma; one can also refer to Figure 1 for the structure of active states and ground states.
Lemma 2.2 Assume that (H) holds. For any given $L_2>L_1\geq 0$ and $b\geq 0,$
 all solutions of the stationary problem (1.7) are one of the following types:
(1) Trivial solution: $v\equiv 0$
;(2) Active states: $v(x)=u^*(x)$
(see Figure 1(b)) is a positive and increasing solution of (1.7), subject to $u^*(\infty )=1$;(3) Ground states: $v(x)=U(x)$
(see Figure 1(c)) is a positive solution of (1.7), and when $x>L_2$, $U(\cdot )=V(\cdot -z)$ where $z\in \mathbb {R}$ and $V$ is the unique positive symmetrically decreasing solution of
\[ V'' + g(V)=0,\quad V(0)=\theta^*,\ V({\pm}\infty)=0; \]
(4) Positive periodic solutions: $v(x)$
is a positive solution of (1.7) and when $x>L_2$, $v(x)=P(x-z_1)$, where $z_1\in \mathbb {R}$ and $P$ is a periodic solution of $v'' + g(v)=0$ with $0<\min P<\theta <\max P<\theta ^*$.


$qp$ -plane. (a) The red dotted curves are the trajectories for $q''+f(q)=0$
 , the blue solid curves are the trajectories for $q''+g(q)=0$
 and the black solid line $l$
 : $q=bp$
 with $b>0$
 . (b) The red solid curve is the trajectory for an active state of (1.7). (c) The red solid curve is the trajectory for a ground state of (1.7).

It follows from the phase-plane analysis that any ground state $U$ of (1.7) satisfies that

We also observe that, for any $\alpha \in (\theta ^*,\,1)$ , the trajectory for $q''+g(q)=0$
 passing through the point $(\alpha,\,0)$
 in the phase plane gives a function $v_\alpha$
 satisfying

with

2.2 Comparison principle
In this section, we give the following useful comparison principle, which is stated as follows.
Lemma 2.3 Assume that $\bar {u}(t,\,x)\in C^{1,2}((0,\,\infty )\times ([0,\,\infty )\setminus \{L_i\}))$ ($i=1,\,\ 2$
 ) satisfies

When $\bar {u}_{0}(x)\geq u_{0}(x)$ for $x\in [0,\,\infty )$
 and $u$
 is a solution of (Reference Courchamp, Berec and GascoigneP), then

The proof of lemma 2.3 is similar as that of [Reference Du, Lou, Peng and Zhou12, lemma 2.2], so the details are omitted here.
Remark 2.4 The function $\overline u$ in lemma 2.3 is often called a supersolution to (Reference Courchamp, Berec and GascoigneP). A subsolution can be defined analogously by reversing all the inequalities. The corresponding comparison principle for subsolutions holds in the above case.
2.3 A general convergence theorem
By similar analysis to [Reference Du, Peng and Sun10, Reference Du and Matano14], we can present a general convergence result, which reads as follows.
Theorem 2.5 (Convergence theorem for system (Reference Courchamp, Berec and GascoigneP))
Let $u(t,\,x)$ be a solution of ( Reference Courchamp, Berec and GascoigneP) with $u_0\in \mathscr {X}(h)$
 for some $h>0$
 . Then $u$
 converges to a stationary solution $v$
 of (1.7) as $t\to \infty$
 locally uniformly in $[0,\,\infty )$
 . Moreover, the limit $v$
 is either $0$
 , or an active state, or a ground state of (1.7).
Proof. Denote by $\omega (u)$ the $\omega$
 -limit set of $u(t,\,\cdot )$
 in the topology of $L^{\infty }_{loc}([0,\,\infty ))$
 . By local parabolic estimates, the definition of $\omega (u)$
 remains unchanged if the topology of $L^{\infty }_{loc}([0,\,\infty ))$
 is replaced by that of $C^2_{loc}([0,\,L_1)\cup (L_1,\,L_2)\cup (L_2,\,\infty ))\cap C^1_{loc}([0,\,\infty ))$
 . It is well-known that $\omega (u)$
 is a compact, connected and invariant set.
Since the conditions in (Reference Courchamp, Berec and GascoigneP) at the interface points $x=L_i$ for $i=1,\,\ 2$
 do not change the number of sign changes of the functions defined similarly as in [Reference Du and Matano14, Lemmas 2.7, 2.9], then by the argument of [Reference Du and Matano14, theorem 1.1] with slight modifications, we can show that $\omega (u)$
 consists of only one element, which is either a constant solution or a nonnegative solution of (1.7) which is decreasing with respect to $x> h$
 . In view of lemma 2.2, $\omega (u)$
 contains either $0$
 , or an active state, or a ground state of (1.7). Consequently, we obtain that as $t\to \infty$
 , $u$
 converges to either $0$
 , or an active state, or a ground state of (1.7) locally uniformly in $[0,\,\infty )$
 .
3. Classification of dynamical behaviour
In this section, we obtain a complete description of the long-time dynamical behaviour of (Reference Courchamp, Berec and GascoigneP). Firstly, we study the properties of the principal eigenvalue of a linear eigenvalue problem and prove theorem 1.2. Next, we give some sufficient conditions for vanishing and for spreading, and obtain the boundedness of $L^*$ . Finally, we give the proof of theorem 1.1.
3.1 A linear eigenvalue problem
We first study the following eigenvalue problem:

and analyse the properties of its principal eigenvalue. It will turn out that these preliminary results are crucial in determining the dynamics of (Reference Courchamp, Berec and GascoigneP). Set

As $h\in L^\infty ([0,\,\infty ))$ , it is well-known that the principal eigenvalue (or the so-called first eigenvalue) of (3.1) exists. Thus, we use $\lambda _1 (L,\,b)$
 to denote the principal eigenvalue of (3.1). The corresponding eigenfunction $\varphi _1^L$
 of (3.1) satisfies $\varphi _1^L\in C^1([0,\,\infty ))\cap C^2([0,\,\infty )\setminus \{ L_i\})$
 ($i=1,\,\ 2$
 ), $\varphi _1^L>0$
 on $(0,\,\infty )$
 and $\varphi _1^L(0)=b(\varphi _1^L)'(0)$
 .
Let $\lambda _1^R(L,\,b)$ be the principal eigenvalue of

It follows from [Reference Berestycki, Hamel and Rossi3, proposition 6.11] (or [Reference Berestycki and Rossi4, theorem 4.1]) that

Let $L_*$ be given as in § 1. Then we are able to conclude that
Lemma 3.1 For any given $b\geq 0$ and $0\leq L_1< L_2$
 , let $L:=L_2-L_1$
 and $\lambda _1(L,\,b)$
 be the principal eigenvalue of (3.1). Then we have for any given $0\leq L_1< L_2$
 and any $b\geq 0$
 ,

and

where

Moreover, for any given $b\geq 0$ , $\lambda _1(L,\,b)$
 is decreasing in $L>0$
 , and there exists a unique $L_*:=L_*(L_1,\,b)$
 such that $\lambda _1(L,\,b)$
 is negative $($
 resp. $0$
 , or positive$)$
 when $L>L_*$
 $($
 resp. $L=L*$
 , or $L< L_*)$
 .
Proof. Let us write $\lambda _1=\lambda _1(L,\,b)$ for simplicity. It follows from lemma A.1 in Appendix A that $\varphi '(x)>0$
 for $0< x\ll 1$
 and $\lambda _1\in (-f'(0),\,-g'(0))$
 for any given $0\leq L_1< L_2$
 and any given $b\geq 0$
 .
We only sketch the proof for the case where $L_1>0$ ; the analysis for the case where $L_1=0$
 is similar.
Since $\lambda _1\in (-f'(0),\,-g'(0))$ , then

For $x\in [0,\,L_1)$ , it follows from the second equation of (3.1) that

which implies that there are two constants $C_1$ and $C_2$
 such that

This, together with $\varphi (0)=b\varphi '(0)$ and $\varphi (x)>0$
 for $x>0$
 , yields that

and for $x\in (0,\,L_1)$ ,

and

Then we have

Similarly, for $x\in (L_2,\,\infty )$ , there are two constants ${C}_3$
 and ${C}_4$
 such that

Using $\varphi (\infty )=0$ , we infer that ${C}_4>0={C}_3$
 , and so for $x\in (L_2,\,\infty )$
 ,

and

Then we obtain

Since $\varphi '(L_i+0)=\varphi '(L_i-0)$ $(i=1,\,2)$
 , it follows from (3.5) and (3.6) that

By the first equation of (3.1), we have $\varphi ''(x)<0$ for $x\in (L_1,\,L_2)$
 . This, together with (3.7), yields that there is a unique $a\in (L_1,\,L_2)$
 satisfying $\varphi '(a)=0$
 .
When $x\in (L_1,\, L_2)$ , we get from the first equation of (3.1) that

thus there are two constants ${C}_5$ and ${C}_6$
 such that

Since $\varphi '(a)=0$ and $\varphi (x)>0$
 for $x> 0$
 , then ${C}_5>0={C}_6$
 . In turn, it holds

Moreover, basic computation gives that

By virtue of (3.5) and (3.6), it then follows that

and

Thanks to (3.8)–(3.10), we may have that

By a similar argument as the proof of [Reference Du, Peng and Sun10, lemma 4.1], we have

and as $L_2\to \infty$ ,

Furthermore, making use of (3.9)–(3.11) again, we deduce that

and

Adding these two identities infers

It is noted that $\theta _1$ is decreasing while $\theta _2$
 is increasing with respect to ${\lambda }_1$
 . By virtue of (3.14), some basic analysis shows that ${\lambda }_1$
 is decreasing with respect to $L>0$
 . In addition, by (3.12) and (3.13), we conclude that there is a unique value

such that ${\lambda }_1<0$ if $L>L_*:=L_*(L_1,\,b)$
 , ${\lambda }_1=0$
 if $L={L}_*$
 and ${\lambda }_1>0$
 if $0< L<{L}_*$
 . The proof is complete now.
We obtain the following property of $L_*(L_1,\,b)$ .
Proposition 3.2 Let ${L}_*(L_1,\,b)$ be given in lemma 3.1. There exists $B^*:={1}/{\sqrt {-g'(0)}}$
 such that ${L}_*(L_1,\,b)$
 is decreasing (resp. increasing) with respect to $L_1\geq 0$
 if $0\leq b< B^*$
 (resp. $b>B^*$
 ). Moreover, for any given $L_1\geq 0$
 , ${L}_*(L_1,\,b)$
 is decreasing with respect to $b\geq 0$
 .
Proof. The basic computation gives that

with $\gamma :=\sqrt {f'(0)}$ and $\beta :=\sqrt {-g'(0)}$
 , which implies that

Moreover, we obtain the following results: for any fixed $b\geq 0$ ,
(i) $\underset {L_1\geq 0}{\min }\ L_*(L_1,\,b)=\underset {L_1\to \infty }{\lim }\ L_*(L_1,\,b)=\frac {2}{\sqrt {f'(0)}}\arctan \sqrt {-\frac {g'(0)}{f'(0)}}$
if $0\leq b< B^*$;(ii) $\underset {L_1\geq 0}{\max }\ L_*(L_1,\,b)={L}_*(0,\,b)=\frac {1}{\sqrt {f'(0)}}[\arctan \sqrt {-\frac {g'(0)}{f'(0)}}+\arctan \frac {1}{b\sqrt {f'(0)}}]$
if $0\leq b< B^*$;(iii) ${L}_*(L_1,\,b)\equiv \frac {2}{\sqrt {f'(0)}}\arctan \sqrt {-\frac {g'(0)}{f'(0)}}$
if $b= B^*$;(iv) $\underset {L_1\geq 0}{\min }\ {L}_*(L_1,\,b)=L_*(0,\,b)=\frac {1}{\sqrt {f'(0)}}[\arctan \sqrt {-\frac {g'(0)}{f'(0)}}+\arctan \frac {1}{b\sqrt {f'(0)}}]$
if $b> B^*$;(v) $\underset {L_1\geq 0}{\max }\ {L}_*(L_1,\,b)=\underset {L_1\to \infty }{\lim }\ L_*(L_1,\,b)=\frac {2}{\sqrt {f'(0)}}\arctan \sqrt {-\frac {g'(0)}{f'(0)}}$
if $b> B^*$.





Similarly, we can compute that

which yields that for any fixed $L_1\geq 0$ , $L_*(L_1,\,b)$
 is decreasing with respect to $b\geq 0$
 , and
(i) $\underset {b\geq 0}{\max }\ {L}_*(L_1,\,b)={L}_*(L_1,\,0)=\frac {1}{\sqrt {f'(0)}}\Bigg \{ \arctan [\sqrt {-\frac {g'(0)}{f'(0)}}\cdot \frac {{\rm e}^{2\sqrt {-g'(0)} L_1} +1}{{\rm e}^{2\sqrt {-g'(0)} L_1}-1}] +\arctan \sqrt {-\frac {g'(0)}{f'(0)}}\Bigg \}$
,(ii) $\underset {b\geq 0}{\min }\ {L}_*(L_1,\,b)=\underset {b\to \infty }{\lim }{L}_*(L_1,\,b)=\frac {1}{\sqrt {f'(0)}}\Bigg \{ \arctan [\sqrt {-\frac {g'(0)}{f'(0)}}\cdot \frac {{\rm e}^{2\sqrt {-g'(0)} L_1} -1}{{\rm e}^{2\sqrt {-g'(0)} L_1}+1}]+\arctan \sqrt {-\frac {g'(0)}{f'(0)}}\Bigg \}$
.


The proof is now complete.
Remark 3.3 From above proposition and its proof, we obtain that

Finally, we derive the following estimate for $L^*$ . That is, we have
Proposition 3.4 For any given $b\geq 0$ and $0\leq L_1< L_2$
 , let $L^*$
 be given in (1.9), then $L^*$
 is bounded.
Proof. Firstly, we consider the case where $f$ is a Fisher–KPP type of nonlinearity (i.e. ${f(u)}/{u}$
 is decreasing with respect to $u\geq 0$
 ) and prove that $L^*\leq 2L^0$
 with

It follows from [Reference Du, Peng and Sun10, proposition 3.10] that the following auxiliary problem:

admits a unique positive symmetrically decreasing solution $q_l(x)$ when $l>l_0:={\pi }/{2\sqrt {f'(0)}}$
 , and $q_l(x)$
 is increasing in $l>l_0$
 , that is, when $l_2>l_1>l_0$
 , then $q_{l_2}(x)> q_{l_1}(x)$
 for $x\in [-l_1,\,l_1]$
 . It is easy to check that $L^0>l_0$
 . Moreover, when $l=L^0$
 , the unique positive solution $q_l(x)$
 of problem (3.15) satisfies $q_l(0)=\theta ^*$
 .
We claim that $L^*\leq 2L^0$ . Let us use an indirect argument and suppose that $L^*> 2L^0$
 . For any fixed $L_0\in (2L^0,\, L^*)$
 and any $0\leq L_1< L_2$
 satisfying $L_0=L_2-L_1$
 , consider the following problem:

It follows from some standard analysis that for any $v_0(x)\geq,\,\not \equiv 0$ , the unique positive solution $v(t,\,x)$
 of (3.16) satisfies

where $q_{{(L_2-L_1)}/{2}}(x)$ is the unique positive solution of (3.15) with $l={(L_2-L_1)}/{2}={L_0}/{2}>L^0$
 . Since the solution $u(t,\,x)$
 of (Reference Courchamp, Berec and GascoigneP) satisfies that $u(1,\,x)>0$
 for all $x\geq 0$
 , we can take $v_0(x)$
 small enough such that $u(1,\,x)>v_0(x)$
 in $[L_1,\,L_2]$
 . Hence, the comparison principle can be used to obtain that

Combining this, the fact that $q_l(0)>\theta ^*$ with $l>L^0$
 , and lemma 2.2, we see that $u(t,\,x)-u^*(x)\to 0$
 locally uniformly in $[0,\,\infty )$
 as $t\to \infty$
 , which means that only spreading can happen for $u$
 . That is, problem (Reference Courchamp, Berec and GascoigneP) does not have a ground state for any $L_0>2L^0$
 . This contradicts the definition of $L^*$
 , and so $L^*\leq 2L^0$
 .
Later, we consider the case where $f$ is a generally monostable nonlinearity. In this case we need to construct a Fisher–KPP type of nonlinearity $\underline {f}(u)$
 satisfying $\underline {f}(0)=\underline {f}(1)=0$
 and $\underline {f}(u)\leq f(u)$
 for $u\in [0,\,1]$
 . Once this is done, we then use the same argument as above to obtain that $L^*\leq 2\underline {L}^0$
 with

Now, let us construct such $\underline {f}$ . As $f$
 is a $C^1$
 function, there exist two small positive constants $\delta _0$
 and $\delta _1$
 such that

Choose $k:=\min \{\frac {1}{2}f'(0),\, \underset {s\in [\delta _0,\,1-\delta _1]}{\min }{f(s)}/{s}\}$ and construct the following function $\underline {f}\in C^1$
 such that:

and that $\underline {f}(u)$ is a Fisher–KPP type of nonlinearity with

which completes the proof.
Remark 3.5 It follows from the above proof that the Fisher–KPP condition for $f(u)$ is the key point, which guarantees that problem (3.15) admits a unique positive symmetrically decreasing solution $q_l(x)$
 when $l>l_0$
 . The proof of this proposition is similar to those of [Reference Du, Peng and Sun10, propositions 3.10 and 4.2]. However, it appeared that the proofs of [Reference Du, Peng and Sun10, propositions 3.10 and 4.2] were not completely correct, because the authors in [Reference Du, Peng and Sun10] only considered the case where $f(u)$
 is a Fisher–KPP type of nonlinearity. By a similar argument as above, one can fill this gap and give the correct proof.
3.2 Vanishing and spreading phenomena
Now, we give some sufficient conditions for vanishing and for spreading. We begin this section with the following result.
Lemma 3.6 For any $L_2>L_1\geq 0$ and any $b\geq 0$
 , let $\lambda _1(L,\,b)$
 be the principal of the eigenvalue problem (3.1) and $u$
 be a solution of (Reference Courchamp, Berec and GascoigneP) with $u_0\in \mathscr {X}(h)$
 for some $h>0$
 . The following assertions hold:
(i) When $\lambda _1(L,\,b)>0$
and $\|u_0\|_{L^\infty }$ is small, then vanishing happens;(ii) When $\lambda _1(L,\,b)<0$
, then vanishing does not happen for any $u_0\not \equiv 0$.


Proof. (i) Let $\varphi _1^L$ be the corresponding positive eigenfunction, which can be normalized satisfying $\|\varphi _1^L\|_{L^{\infty }}=1$
 . Define

with some $\delta >0$ so small that

A simple calculation yields that

Choose $\|u_0\|_{L^\infty }$ small such that $u_0(x)\leq \bar {u}(0,\,x)$
 in $[0,\,h]$
 , then $\bar {u}$
 is a supersolution of (Reference Courchamp, Berec and GascoigneP). Lemma 2.3 yields that $u(t,\,x)\leq \bar {u}(t,\,x)$
 for $t\geq 0$
 and $x \geq 0$
 . Combining this with the fact that $\|\bar {u}\|_{L^\infty ([0,\infty ))}\to 0$
 as $t\to \infty$
 , we obtain that vanishing happens for $u$
 .
(ii) As $\lambda _1(L,\,b)<0$ , in light of (3.3), one obtains that $\lambda _1^R(L,\,b)<0$
 for all large $R$
 with $R>L_2+h$
 . The positive eigenfunction corresponding to $\lambda _1^R(L,\,b)$
 , denoted by $\varphi _1^{L,R}$
 , solves (3.2) and can be normalized so that $\|\varphi _1^{L,R}\|_{L^{\infty }}=1$
 . Set

where the constant $\varrho >0$ can be chosen to be sufficiently small such that

Consequently, we deduce that

Furthermore, since $u(1,\,x)>0$ for all $x\geq 0$
 , we can take $\varrho$
 to be smaller if necessary such that $u(1,\,x)>w(x)$
 for all $x\geq 0$
 . Hence, $w$
 is a generalized subsolution of (Reference Courchamp, Berec and GascoigneP) for $t\geq 1,\,x\geq 0$
 . By lemma 2.3, we obtain $u(t,\,x)\geq w(x)$
 for $t>1$
 and $x \geq 0$
 . This apparently implies that vanishing cannot happen for $u$
 , which completes the proof of this lemma.
Based on the phase-plane analysis we can give the following sufficient condition for spreading.
Lemma 3.7 Assume that (H) holds. For any $L_2>L_1\geq 0$ and any $b\geq 0$
 , let $u$
 be the solution of (Reference Courchamp, Berec and GascoigneP) with $u_0\in \mathscr {X}(h)$
 for some $h>0$
 . If for any $\alpha \in (\theta ^*,\,1]$
 , $u_0\geq \alpha$
 on $[r,\,r+2l_\alpha ]$
 for some $r\geq L_2$
 , where $l_\alpha$
 is given in (2.3), spreading happens for $u$
 .
Proof. It follows from [Reference Chen, Lou, Zhou and Giletti5, lemmas 3.1 and 3.2] that the solution $w$ of the following problem:

satisfies

where $W^*$ is the unique solution of

The comparison principle gives that $u(t,\,x)\geq w(t,\,x)$ for $t>0$
 and $x\geq r$
 . Since active states are only solutions of (1.7) bigger than $W^*(x)$
 for $x\geq r$
 , then the conclusion follows from theorem 2.5 immediately.
3.3 Proof of theorem 1.1
Based on the preparation of the previous subsections, we are now ready to give
Proof of theorem 1.1. Proof of theorem 1.1
Let $u_\sigma$ be a solution of (Reference Courchamp, Berec and GascoigneP) with $u_0=\sigma \phi$
 for some $\phi \in \mathscr {X}(h)$
 , $h>0$
 and $\sigma >0$
 , and define

We claim that for any $L_2>L_1\geq 0$ and any $b\geq 0$
 , $\Sigma _1$
 is a nonempty open interval.
Firstly, we show that $\Sigma _1$ is nonempty. As $f$
 and $g$
 are globally Lipschitz on $[0,\,\infty )$
 , there is $K>0$
 such that

Consider the following problem:

Clearly, this problem admits a unique positive solution $\underline {u}$ and the comparison principle yields that, for $t\geq 0,\,x\geq 0$
 ,

Then for any $\alpha \in (\theta ^*,\,1)$ , we have $u_\sigma (1,\,x)>\alpha$
 in $[L_2,\,L_2+2l_\alpha ]$
 provided that $\sigma$
 is sufficiently large. This and lemma 3.7 yield that $\sigma \in \Sigma _1$
 , which implies that $\Sigma _1$
 is nonempty.
Later we show that $\Sigma _1$ is open. Choose any $\sigma _1\in \Sigma _1$
 , then for any $\alpha \in (\theta ^*,\,1)$
 and $l_\alpha$
 given in (2.3), we can find $T_1>0$
 such that

By the continuous dependence of the solution of (Reference Courchamp, Berec and GascoigneP) on its initial values, if $\epsilon >0$ is sufficiently small, then the solution $u_{\epsilon }$
 of (Reference Courchamp, Berec and GascoigneP) with $u_0=\phi _{\sigma _1-\epsilon }$
 satisfies (3.20). It then follows from lemma 3.7 that spreading happens for $u_{\epsilon }$
 , which infers that $\sigma _1-\epsilon \in \Sigma _1$
 . On the contrary, the comparison principle implies that $\sigma \in \Sigma _1$
 for any $\sigma >\sigma _1$
 . Thus, $\Sigma _1$
 is open. Define $\sigma ^*:=\inf \Sigma _1$
 , then $\Sigma _1=(\sigma ^*,\,\infty )$
 .
(I) When $0< L< L_*$
, it follows from lemma 3.1 that the eigenvalue problem (3.1) with $L\in (0,\,L_*)$ admits a positive principal eigenvalue $\lambda _1(L,\,b)$. Combining this with lemma 3.6(i), we have that vanishing happens for all small $\sigma >0$, thus
\[ \Sigma_0=\{\sigma>0:\ \mbox{vanishing happens for the solution } u_\sigma \mbox{of} (??) \} \neq \emptyset. \]Moreover, by the same argument of [Reference Du, Peng and Sun10, lemma 3.6(i)], we see that $\Sigma _0$ is an open interval. Define $\sigma _*:=\sup \Sigma _0$, then $\Sigma _0=(0,\, \sigma _*)$. Recalling that $\sigma ^*:=\inf \Sigma _1$ and $\Sigma _1=(\sigma ^*,\,\infty )$, then we have $\sigma _*\leq \sigma ^*$ and neither spreading nor vanishing happen for $u_\sigma (t,\,x)$ with $\sigma \in [\sigma _*,\, \sigma ^*]$. Thus, each solution $u_\sigma (t,\,x)$ with $\sigma \in [\sigma _*,\, \sigma ^*]$ is a transition one.(II) When $L_*< L< L^*$
, it follows from lemma 3.1 that principal eigenvalue $\lambda _1(L,\,b)$ of eigenvalue problem (3.1) with $L\in (L_*,\, L^*)$ is negative. This, together with lemma 3.6(ii), implies that vanishing does not happen for any $\sigma >0$. On the contrary, we have proved that $\Sigma _1=(\sigma ^*,\,\infty )$ with $\sigma ^*:=\inf \Sigma _1<\infty$. Moreover, it follows from the proof of [Reference Du, Peng and Sun10, lemma 3.8] that problem (Reference Courchamp, Berec and GascoigneP) admits a ground state for any $0< L< L^*$. Thus, we obtain that $\sigma ^*>0$ and each solution $u_\sigma (t,\,x)$ with $\sigma \in (0,\, \sigma ^*]$ is a transition one.(III) When $L>L^*$
, it follows from lemma 3.1 that principal eigenvalue $\lambda _1(L,\,b)$ of eigenvalue problem (3.1) with $L>L^*$ is negative. This, together with lemma 3.6(ii), implies that vanishing does not happen for any $\sigma >0$. Combining with the definition of $L^*$ and the proved fact that $\Sigma _1=(\sigma ^*,\,\infty )$ with $\sigma ^*:=\inf \Sigma _1<\infty$, we obtain that $\sigma ^*=0$ and spreading happens for all $\sigma >0$.


The whole proof of theorem 1.1 is thus complete.
4. Discussion
In the present work, we have been concerned with a reaction–diffusion model with a bounded protection zone for an endangered single species, living in a one-dimensional habit, where the species is subjected to a strong Allee effect in its natural habitat, but within the protection zone the species growth is governed by the monostable nonlinear reaction.
Assume that the protection zone is $[L_1,\, L_2]$ , and the general Robin condition is imposed on $x=0$
 (i.e. $u(t,\,0)=bu_x(t,\,0)$
 with $b\geq 0$
 ). Our results (theorem 1.1) have shown that there are two critical values $0< L_*\leq L^*$
 , and proved that a vanishing–transition–spreading trichotomy result holds when the length $L:=L_2-L_1$
 of protection zone is smaller than $L_*$
 ; a transition–spreading dichotomy result holds when $L_*< L< L^*$
 ; only spreading happens when $L>L^*$
 . As a consequence, our results suggest that the protection zone works only when its length $L$
 is larger than the critical value $L_*$
 . Furthermore, in light of theorem 1.2, we obtained that $L_*$
 is an increasing function of $L_1$
 when $b< 1/\sqrt {-g'(0)}$
 ; while $L_*$
 is decreasing with respect to $L_1$
 when it holds $b\geq 1/\sqrt {-g'(0)}$
 . This suggests that the precise strategies for an optimal protection zone is that if $b$
 is large (i.e. $b\geq 1/\sqrt {-g'(0)}$
 ), in order to make $L_*$
 small, then the protection zone should start from somewhere near $0$
 ; while if $b$
 is small (i.e. $b< 1/\sqrt {-g'(0)}$
 ), then the protection zone should start from somewhere away from $0$
 , and as far away from $0$
 as possible.
In this paper, we have assumed that the species live in a one-dimensional space. In fact, the habitat of a biological population, in general, can be rather complicated. For example, natural river systems are often in a spatial network structure. The topological structure of a river network can greatly influence the species spreading and vanishing. Therefore, as in [Reference Du, Lou, Peng and Zhou12, Reference Jin, Peng and Shi19, Reference Lam, Lou and Lutscher21, Reference Lam, Lou and Lutscher22, Reference Lou and Lutscher27, Reference Ramirez31–Reference Sun33, Reference Sun, Lou and Zhou37], it would be interesting to consider a more general river habitat (bounded or unbounded) consisting of one branch or more than one branch. Then a reaction–diffusion model with strong Allee effect and a protection zone in a river network should be an interesting problem. We leave it for future work.
Financial support
N. Sun was partially supported by NSF of China (No. 11801330), the Support Plan for Outstanding Youth Innovation Team in Shandong Higher Education Institutions (No. 2021KJ037) and the Shandong Province Higher Educational Science and Technology Program (No. J18KA226).
Appendix A.
Lemma A.1 For any given $b\geq 0$ and $0\leq L_1< L_2$
 , let $L=L_2-L_1$
 and ${\lambda }_1(L,\,b)$
 be the principal eigenvalue of (3.1). Then we have

Proof. For simplicity, we write $\lambda _1=\lambda _1(L,\, b)$ , and $\varphi (x)$
 is denoted to be a corresponding positive eigenfunction. First of all, we claim that

In fact, when $b=0$ , then $\varphi (0)=0$
 . This, together with $\varphi (x)>0$
 for $x>0$
 , yields that $\varphi '(x)>0$
 for $0< x\ll 1$
 . Let us consider the case where $b>0$
 . If $\varphi (0)=0$
 , then $\varphi '(0)=0$
 , as $\varphi (x)>0$
 , so $\varphi '(x)>0$
 for $0< x\ll 1$
 . If $\varphi (0)>0$
 , then $\varphi '(0)>0$
 , so $\varphi '(x)>0$
 for $0< x\ll 1$
 . If $\varphi (0)<0$
 , then $\varphi '(0)<0$
 , thus $\varphi (x)<0$
 for $0< x\ll 1$
 , which is a contradiction. Thus, our claim is proved.
Next, we divide the proof into four steps as follows.
Step 1: $\lambda _1\not =-g'(0)$ . If there are $0\leq L^0_1< L^0_2$
 such that $\lambda _1=-g'(0)$
 , then for $x>L^0_2$
 , it follows from the second equation of (3.1) that

which implies that there is a constant $C$ such that $\varphi '(x)\equiv C$
 for $x>L^0_2$
 . This, combining with $\varphi (\infty )=0$
 , shows that $\varphi (x)\equiv 0$
 , a contradiction.
Step 2: $\lambda _1<-g'(0)$ . Suppose that $\lambda _1>-g'(0)$
 for some $0\leq L^0_1< L^0_2$
 . Then, for $x> L^0_2$
 , it holds

As $\varphi (x)>0$ for $x >0$
 , then $\varphi ''<0$
 in $(L^0_2,\,\infty )$
 , which yields that $\varphi '(x)$
 is decreasing in $x>L^0_2$
 . If $\varphi '(\infty )\geq 0$
 , $\varphi$
 is increasing in $x> L^0_2$
 . Since $\varphi >0$
 on $[L^0_2,\,\infty )$
 , we arrive at a contradiction with $\varphi (\infty )=0$
 . If $\varphi '(\infty )<0$
 , it is easily shown that there exists a large $x_0>0$
 such that $\varphi (x)<0$
 for $x\in [x_0,\,\infty )$
 , which again leads to a contradiction.
Step 3: $\lambda _1\not =-f'(0)$ . If there are $0\leq L^0_1< L^0_2$
 such that $\lambda _1=-f'(0)$
 . It then follows from the first equation of (3.1) that

which yields that there is a constant $C_0$ such that

We claim that $C_0>0$ . If this is proved, for $x> L^0_2$
 , it follows from the second equation of (3.1) that

with $g'(0)-f'(0)<0$ , then there exist two constants $\tilde {C}_1$
 and $\tilde {C}_2$
 such that

Noting that $\varphi (\infty )=0<\varphi (x)$ for $x>0$
 , we have $\tilde {C}_2>0=\tilde {C}_1$
 . In turn, $\varphi (x)=\tilde {C}_2{\rm e}^{-\sqrt {f'(0)-g'(0)}\,x}$
 for $x>L^0_2$
 . Hence, we obtain

This leads to a contradiction with the condition $\varphi '(L_2-0)=\varphi '(L_2+0)$ .
Now, let us prove $C_0>0$ . In fact, when $L^0_1=0$
 , it then follows from (A.1) that $C_0>0$
 . When $L^0_1>0$
 , then for $x\in (0,\,L^0_1)$
 , it follows from the second equation of (3.1) that

As $g'(0)-f'(0)<0$ , one can find two constants $\tilde {C}_3$
 and $\tilde {C}_4$
 such that

This, together with $\varphi (0)=b\varphi '(0)$ and $\varphi (x)>0$
 for $x>0$
 , yields that

which implies that

and

Thanks to the condition $\varphi '(L^0_1-0)=\varphi '(L^0_1+0)$ , we see that $C_0=\varphi '(L^0_1-0)>0$
 . Thus, we prove that $C_0>0$
 in this case.
Step 4: $\lambda _1>-f'(0)$ . If there are $0\leq L^0_1< L^0_2$
 such that $\lambda _1<-f'(0)$
 . From the first equation of (3.1), we see that

We claim that

If this is done, then when $x> L_2^0$ , it follows from the second equation of (3.1) and the results proved in steps 1 and 2 that

Then $\varphi ''(x)>0$ for $x> L_2^0$
 and we can find two constants $\tilde {C}_5$
 and $\tilde {C}_6$
 such that

As $\varphi (\infty )=0$ , it is necessary that $\tilde {C}_6>0=\tilde {C}_5$
 . Hence, $\varphi (x)=\tilde {C}_6{\rm e}^{-\sqrt {-(g'(0)+\lambda _1)}x}$
 for $x>L_2^0$
 and

Using this, (A.3) and the condition $\varphi '(L_2^0-0)=\varphi '(L_2^0+0)$ , we arrive at a contradiction.
It is remaining to prove (A.3). If $L^0_1=0$ , it follows from (A.1) and (A.2) that

Now, we consider the case where $L^0_1>0$ . For $x\in (0,\, L_1^0)$
 , it follows from the second equation of (3.1) and the results proved in steps 1 and 2 that

This, together with (A.1), yields that

Since $\varphi '(L_1^0-0)=\varphi '(L_1^0+0)$ , one obtains that

Combining this with (A.2), we have

which ends the proof of (A.3).
The proof of this lemma is complete.



