1 Introduction
Financial regulations have fundamentally changed since the Basel II Accords. Among other evolutions, Basel II and III explicitly impose that computations of capital requirements be model-based. This paradigm shift in risk management has been the source of strong debates among both practitioners and academics, who question whether such model-based regulations are indeed more efficient.
A common feeling in the industry is that regulations will sometimes give a false impression of security: risk managers tend to think that a financial company that would fulfil all the criteria of, say, the Basel III Accords on capital adequacy, is not necessarily on the safe side. This is so mainly because many risks, and most significantly systemic or system-wide risks, are not properly modelled, and also because it is easy to manipulate to some extent various risk measures, such as Value at Risk (VaR).
In parallel, a fast growing body of academic research provides various arguments explaining why current regulations are not well fitted to address risk management in an adequate way, and may even, in certain cases, worsen the situation. This negative unintended effect may be described by the phrase regulation risk, which refers to the fact that prudential rules are sometimes themselves a source of systemic risk.
In Lévy Véhel & Walter (Reference Khindanova, Rachev and Schwartz2014), it was shown that a wrong model of price dynamics coupled to the regulatory VaR constraint tends to systematically increase Tail Conditional Expectation. In the present work, using elementary arguments, we show how a combination of model risk and regulation risk leads to an effect which is exactly the opposite of what the regulator tries to enforce. More precisely, we explain how wrongly assuming a Gaussian dynamics (or, more generally, a light left-tailed one) when the “true” one is pure jump with heavy left tails, and trying to minimise VaR and under a constraint of minimal volume of activity results in effect in movements that will maximise VaR.
Although much more elementary, our approach is inspired by several articles by Danielsson et al.: in Danielsson et al. (2001), the authors elaborate on the idea that “regulations fail to consider the fact that risk is endogenous. Value-at-Risk can destabilise an economy and induce crashes when they would not otherwise occur”. A number of qualitative arguments are then put forward to support this claim, and in particular the fact that VaR is a misleading risk measure when the returns are not Gaussian.
In Danelsson & Zigrand (Reference Borio2001) and Danelsson et al. (Reference Bayraktar, Horst and Sircar2001), a general equilibrium model is proposed that provides a possible explanation of why VaR-based regulation raises such difficulties. In essence, this model shows that VaR constraints tend to increase the degree of risk-aversion of all actors. As a consequence, liquidity in the market is lowered when prices fall. As a noteworthy output of these studies, numerical simulations show that reactions to shocks are both more accentuated and extended under VaR regulation.
In the present work, we highlight a plausible mechanism through which this specific last effect takes place, resulting in an increase of endogenous risk due to VaR constraint. In a nutshell, the idea is simply that, by treating jumps in the evolution of prices as exceptional events and essentially ignoring them in model-based VaR computations, one misses an essential dimension of risk, and acts in a way that will in effect favour sudden large movements in the markets and ultimately increase VaR. Our simple setting allows us to quantify precisely this effect. Similarly to Danelsson et al. (Reference Bayraktar, Horst and Sircar2001), an important assumption in our approach is that actors on the market share the common practice of managing risk in a variance/covariance framework. However, contrarily to Danelsson et al. (Reference Bayraktar, Horst and Sircar2001), our mechanism predicts that VaR constraints result in an increased intensity of jumps and a decrease in volatility – a fact confirmed experimentally on certain data sets (El Mekeddem & Lévy Véhel, Reference Danielsson, Shin and Zigrand2013) – where the model in Danelsson et al. (Reference Bayraktar, Horst and Sircar2001) results in increases on both aspects. This discrepancy is may be only apparent: the model in Danelsson et al. (Reference Bayraktar, Horst and Sircar2001) is conditionally Gaussian, and thus a larger risk mechanically translates into a larger volatility, as this is the only variable determining risk. In our framework, however, risk is a function of both volatility and jump intensity, and a greater risk may be obtained with a smaller volatility, provided the intensity of jumps undergoes a sufficient increase. By modelling in a more realistic way prices movements, we are able to distinguish the effects of VaR regulation on volatility from those on jump intensity, and give a mathematical translation to the common feeling of practitioners that regulations give a false impression of security characterised by low volatility but increased risk of sudden large movements.
We mention in passing that our results are an instance of the fact mentioned in Danielsson et al. (Reference Carr, Geman, Madan and Yor2013) that, contrarily to intuition, a situation where every institution tries to act in a prudent way does not automatically ensure safety of the whole financial system.
Numerous other recent works point to some form of regulation risk related to Basel III/Solvency II. Let us briefly mention (Al-Darwish et al., Reference Danelsson, Shin and Zigrand2011), which points to unintended consequences for cost of capital, funding patterns, interconnectedness and risk migration (Aggarwal et al., Reference Danelsson and Zigrand2015), where model risk is emphasised in view of the fact that Solvency Capital Requirement calculations under Solvency II, requiring the quantification of extreme loss percentiles, are subject to a very high degree of model uncertainty and Bank of England which examines procyclical behaviours entailed by the regulations and provides some interesting stylised examples.
The remainder of this work is organised as follows: in section 2, we present our model for price formation and we formulate our program as an optimisation problem. Section 3 provides the solution to this problem in the case where individual trades are independent, both in the Gaussian (section 3.1) and stable (section 3.2) frameworks. These computations allow us to explain, in section 4, how actions taken under Gaussian beliefs when the market is in fact governed by stable non-Gaussian movements leads to maximising VaR instead of minimising it. A case where trades are fully correlated instead of being independent is briefly studied in section 5. Section 7 draws some conclusions and proposes perspectives for further studies. Finally, recalls on some basic notions on stable random variables (RV) are gathered in an Appendix.
2 General framework
We formalise the situation as follows: our starting point is a very simple model of price formation which is a particular case of the one in Bayraktar et al. (Reference Al-Darwish, Hafeman, Impavido, Kemp and O’Malley2006). We stress the fact that the contribution of this work is not about a model of price formation, and that this particular model was chosen for convenience. Other models could be considered, which would probably require more convoluted mathematical tools, and thus obscure the main message of this article.
We consider n
A
actors. Over a given time period, each actor i=1, … , n
A
places trades on the market at discrete times. These trades are modelled as RV and are denoted
 $$X_{j}^{{\left( i \right)}} ,\,j\,{\equals}\,1,\,\ldots\,n_{T}^{{(i)}} $$
. A positive (respectively negative)
 $$X_{j}^{{\left( i \right)}} $$
means that the actor is buying (resp. selling). The holding of actor i at the end of the time period is then equal to
 $\mathop{\sum}\nolimits_{j\,{\equals}\,1}^{n_{T}^{{\left( i \right)}} } X_{j}^{{\left( i \right)}} $
and the total activity in the period, or “market imbalance” at the end of the period, is subsumed by the quantity
 $$\mathop{\sum}\nolimits_{i\,{\equals}\,1}^{n_{A} } \mathop{\sum}\nolimits_{j\,{\equals}\,1}^{n_{T}^{{\left( i \right)}} } X_{j}^{{\left( i \right)}} $$
. In the model of Bayraktar et al. (Reference Al-Darwish, Hafeman, Impavido, Kemp and O’Malley2006), market imbalance is the only component driving the dynamics of prices, and it is assumed that all the orders are received by a single market maker who clears the trades and sets prices as to reflect the incoming order flows. The following pricing rule is then considered for the logarithmic price at the end of the period:
 $$S\,{\equals}\,S_{0} {\plus}\mathop{\sum}\limits_{i\,{\equals}\,1}^{n_{A} } \mathop{\sum}\limits_{j\,{\equals}\,1}^{n_{T}^{{\left( i \right)}} } X_{j}^{{\left( i \right)}} $$
As explained in Bayraktar et al. (Reference Al-Darwish, Hafeman, Impavido, Kemp and O’Malley2006), this is the simplest mechanism by which prices reflect the extent of market imbalance, with incoming buy orders increasing the price and sell orders decreasing it. In the sequel, the value of S 0 will be of no importance, and thus we set S 0=0.
We wish to examine the effect of a VaR constraint under various assumptions on the RV
 $$X_{j}^{{(i)}} $$
. Recall that VaR at confidence level p over one period is defined by
 $${\Bbb P}\left( {S\,\lt\,{\minus}{\rm VaR}} \right)\,{\equals}\,1\,{\minus}\,p$$
The confidence level p is fixed once and for all in the sequel, but its particular value is of no relevance for us, as long as it is large enough.
The regulator imposes that financial firms secure an amount of capital that is an increasing function of VaR, and so these firms will try to act in a way that minimises VaR. Of course, an absolute minimum on VaR may be reached by taking no risks at all, that is placing no trades. To avoid such a trivial but unrealistic behaviour, we must take into account the fact that firms must maintain an overall level of activity. A simple way to do so is to impose that the overall mean volume of trades must remain above a certain amount over the considered periodFootnote 1 . Our optimisation program then reads: minimise VaR while ensuring a minimal mean volume of activity. A first but reasonable approximation of the overall volume of activity during the considered period is
 $$V\,{\equals}\,\mathop{\sum}\limits_{i\,{\equals}\,1}^{n_{A} } \mathop{\sum}\limits_{j\,{\equals}\,1}^{n_{T}^{{\left( i \right)}} } \!\mid\!X_{j}^{{\left( i \right)}} \!\mid\!$$
We need to take into account a final fact: the number of trades that may possibly be placed by all actors during the considered period cannot be arbitrarily large. We will then require that n≤n* as a further constraint, where n* is a fixed (large) number that represents a physical limit on the total number of trades. In practice, most portfolio managers typically try to limit the number of their trades in order to reduce transactions costs, and for these managers, a bound like
 $$n_{T}^{{\left( i \right)}} \leq n_{T}^{{\asterisk}} $$
will holdFootnote
2
. In this situation,
 $$n^{{\asterisk}} \,{\equals}\,n_{A} \;n_{T}^{{\asterisk}} $$
, but we will only need a global bound.
To sum up, our program reads:
Minimise VaR defined by (2) under the volume constraint
 $${\Bbb E}$$
(V)≥K and the number of trades constraint n≤n*, where S is given by (1), V is given by (3) and K, n* are positive constants.
In the next sections, we derive the solution to this problem under certain assumptions on the RV
 $$X_{j}^{{\left( i \right)}} $$
. We will assume in a first version (section 3) that all actors have, at all times, the same statistical behaviour, and that all trades are independent. In other words, all the
 $$X_{j}^{{\left( i \right)}} $$
are supposed to be independent and identically distributed (iid). The assumption of identical distribution is not essential, and serves mainly to avoid cumbersome notations. The independence hypothesis is useful so that computations remain at an elementary level. It is well known that it becomes specially unrealistic in period of crises. To account for this fact, we study briefly, in a second version (section 5), the case of “total correlation”, that is, when all investors are fully synchronised so that they behave as a single actor. While a general analysis could be performed incorporating a more reasonable degree of dependence, it would introduce some mathematical complications and would not add much insight.
The core of our work is to contrast two situations for the law of the
 $$X_{j}^{{\left( i \right)}} $$
: in the first one, we assume that they are normally distributed (section 3.1). Not only is this the simplest situation, but also, and more importantly, as the log price then also follows a Gaussian distribution, it corresponds to the general belief among actors and regulators. This is, for instance, witnessed by the widespread use of tools such as RiskMetricsTM, or the very fact that volatility (understood as the instantaneous variance) is widely considered a valid global measure of risk. This aspect is discussed, for example, in Danelsson & Zigrand (Reference Borio2001), Danelsson et al. (Reference Bayraktar, Horst and Sircar2001), Danielsson et al. (2001), Le Courtois & Walter (Reference Le Courtois and Walter2014), Lévy Véhel & Walter (Reference Khindanova, Rachev and Schwartz2014).
In the second situation (section 3.2), we assume that individual trades follow a stable RV with jump intensity α∈(1,2) (see the Appendix for recalls on stable RV). Stable RV and motions were introduced in financial modelling in Mandelbrot (Reference Lévy Véhel and Walter1963) and Fama (Reference Embrechts, McNeill and Strautman1965), and have been studied since in many connections, including pricing (Popovalina & Ritchken, Reference Miyahara and Moriwaki1998; Carr & Wu, 2002; Miyahara & Moriwaki, Reference Mittnik, Rachev and Schwartz2009) and VaR computation (Khindanova et al., 2001; Mittnik et al., Reference Mandelbrot2002).
We would like to emphasise here that the Gaussian/stable assumptions are mainly made for mathematical simplicity: they allow the logarithmic price to follow the same law as individual trades. However, the main conclusions below would remain qualitatively the same if, instead of a dichotomy characterised by the couple (Gaussian/stable) distributions, one would contrast two laws such that the second one displays a significantly fatter left tail than the first one. For instance, one could consider a couple (Poisson jumps + Gaussian component/CGMY RV) (Carr et al., 2002). This would enable to incorporate moderate jumps in the first situation and to deal with RV with moments of all orders in the second one (note that the finite moment log stable process of Carr & Wu (2002), that fits in our present analysis, already has moments of all orders).
3 Computations in the independent case
3.1 Gaussian framework
We assume in this section that
 $$X_{j}^{{\left( i \right)}} \,{\equals}\,N\left( {0,\sigma } \right)$$
, that is, individual trades follow a centred normal law with s.d. equal to σ>0. We will denote the logarithmic price by S
G
to emphasise the fact that we are in the Gaussian case. By assumption, S
G
follows an
 $$N\left( {0,\sqrt n \sigma } \right)$$
law, where
 $$n\,{\equals}\,\mathop{\sum}\nolimits_{i\,{\equals}\,1}^{n_{A} } n_{T} \left( i \right)$$
.
The expectation
 $$V_{G}^{m} $$
of the “Gaussian volume” V
G
reads
 $$V_{G}^{m} \,\colon\!{\equals}\,{\Bbb E}\left( {V_{G} } \right)\,{\equals}\,n\sigma \sqrt {{2 \over \pi }} $$
As is well known, VaR in the Gaussian case is a constant multiple of standard deviation:
 $$\:{\rm VaR}\:_{G} \,{\equals}\,C_{p} \sigma \sqrt n $$
, with C
p
>0. Our optimisation program thus read:
 $$\left\{ {\matrix{ {{\rm minimize}\,\:\sigma \sqrt n } \hfill \cr {{\rm subject}\;{\rm to}\,\:n\sigma \geq K} \hfill \cr {{\rm and}\;\:n\leq n^{{\asterisk}} } \hfill \cr } } \right.$$
The concrete meaning of (5) is as follows: each actor i places trades and he controls the number
 $$n_{T}^{{\left( i \right)}} $$
of these trades as well as their mean value, which is
 $$\sigma \sqrt {{2 \over \pi }} $$
. He then tries to tune these two variables in order to minimise VaR.
Note that, without the constraint on the maximum number of trades, the program would amount to minimising
 $${1 \over {\sqrt n }}$$
. Since n
A is not a variable that actors can influence, this would be the same as maximising n
T
. One could then reach individual zero risk by increasing n
T
without limit.
As is easily seen, the optimum is realised when both constraints bind. This can be proved, for instance, by taking the logarithms of (5), which turns the problem into a linear one.
Minimising VaR while maintaining a fixed minimum mean overall activity is thus achieved by setting
 $$n\,{\equals}\,n^{{\asterisk}} $$
and
 $$\sigma \,{\equals}\,{{{\rm constant}} \over {n^{{\asterisk}} }}$$
that is, the smallest possible σ. This corresponds to the intuitively obvious fact that the smallest risk will be reached by placing “many small” orders rather than a “few large” ones.
To sum up, under a Gaussian assumption, minimising VaR does correspond to minimising volatility: we recover the fact that volatility is indeed implicitly identified with risk by the regulator. We emphasise that, since Gaussianity is common belief, both the regulator and financial actors will typically tend to act in a way that will match the results above.
3.2 Stable framework
We assume now that individuals trades are iid and follow an S α (σ,β,0) law, that is, a stable law with jump intensity α∈(1,2), scale parameter σ>0, skewness parameter β∈[−1,1] and location parameter µ=0 (see the Appendix for recalls on stable RV).
The logarithmic price
 $S_{S} \,{\equals}\,\mathop{\sum}\nolimits_{i\,{\equals}\,1}^{n_{A} } \mathop{\sum}\nolimits_{j\,{\equals}\,1}^{n_{T}^{{\left( i \right)}} } X_{j}^{{\left( i \right)}} $
is now a stable RV
 $$S_{\alpha } \left( {n^{{{1 \over \alpha }}} \sigma ,\,\beta ,\,0} \right)$$
. Using the last formula in Samorodnitsky & Taqqu (Reference Popovalina and Ritchken1994: 18), one computes:
 $$\eqalignno{ V_{S}^{m} \,\colon\!{\equals}\, & {\Bbb E}\left( {V_{S} } \right)\,{\equals}\,n{\Bbb E}\left( {\!\mid\!X_{1}^{{\left( 1 \right)}} \!\mid\!} \right) \cr \,{\equals}\, & {{2n\sigma } \over \pi }\Gamma \left( {1\,{\minus}\,{1 \over \alpha }} \right)\left( {1{\plus}\beta ^{2} \;{\rm tan}^2 {{\pi \alpha } \over 2}} \right)^{{{1 \over \alpha }}} \;{\rm cos}\left( {{1 \over \alpha }\;{\rm arctan}\left( {\beta \;{\rm tan}{{\pi \alpha } \over 2}} \right)} \right) \cr & \hskip-8pt{\equals}\! \,\colon\,{{2n\sigma } \over \pi }H\left( {\alpha ,\beta } \right) $$
To compute VaR, we assume that the confidence level p is large enough and use Formula 1.2.8 in Samorodnitsky & Taqqu (Reference Popovalina and Ritchken1994: 16):
 $$\mathop {\rm lim}\limits_{\lambda \to\infty} \lambda ^{\alpha } \,{\Bbb P}\left( {S_{S} \,\lt\,{\minus}\lambda } \right)\,{\equals}\,C_{\alpha } {{1\,{\minus}\,\beta } \over 2}n\sigma ^{\alpha } $$
where
 $$C_{\alpha } \,{\equals}\,{{1\,{\minus}\,\alpha } \over {\Gamma \left( {2\,{\minus}\,\alpha } \right)\,{\rm cos}\,\left( {\pi \alpha /2} \right)}}$$
Note that, in practice, even for a very large confidence level, we may be still far from the regime where the asymptotic expression (7) holds. Thus, the following computations should be taken as an indication of a general behaviour rather than as strict equalities.
By definition of VaR, one has
 $$\left( {\rm VaR_{S} } \right)^{\alpha } \left( {1\,{\minus}\,p} \right)\,\simeq\,C_{\alpha } {{1\,{\minus}\,\beta } \over 2}n\sigma ^{\alpha } $$
or
 $$\:{\rm VaR}_{S} \,\simeq\,\sigma \left( {{{nC_{\alpha } \left( {1\,{\minus}\,\beta } \right)} \over {2\left( {1\,{\minus}\,p} \right)}}} \right)^{{{1 \over \alpha }}} $$
The minimum mean overall volume of activity constraint reads
 $$\sigma n\,\geq\, {{C_{V} } \over {H\left( {\alpha ,\beta } \right)}}$$
where C V is a positive constant.
In contrast to the Gaussian situation, we have now four variables in our program: n, σ, α and β. We will assume here for simplicity that β is fixed exogenously rather than by the behaviours of investors, and we will consider various values of interest for this parameter. The general case, which will be presented elsewhere, leads to qualitatively similar conclusions. An explanation of how the decisions of actors influence the values of n, σ and α, and in particular how they “choose” the scale parameter and jump intensity, is provided in Samorodnitsky & Taqqu (Reference Popovalina and Ritchken1994: 12).
It is not hard to verify that, as in the Gaussian case, the constraints are binding. Minimising VaR at minimal volume then amounts to minimising the following quantity:
 $${{n^{{{1 \over \alpha }\,{\minus}\,1}} } \over {H\left( {\alpha ,\beta } \right)}}\left( {{{C_{\alpha } \left( {1\,{\minus}\,\beta } \right)} \over {2\left( {1\,{\minus}\,p} \right)}}} \right)^{{{1 \over \alpha }}} $$
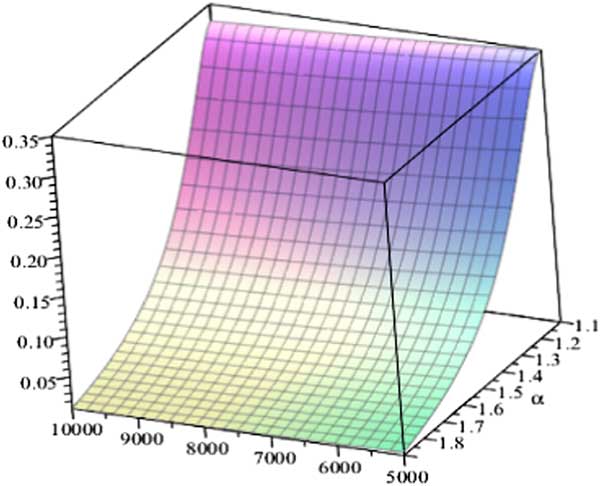
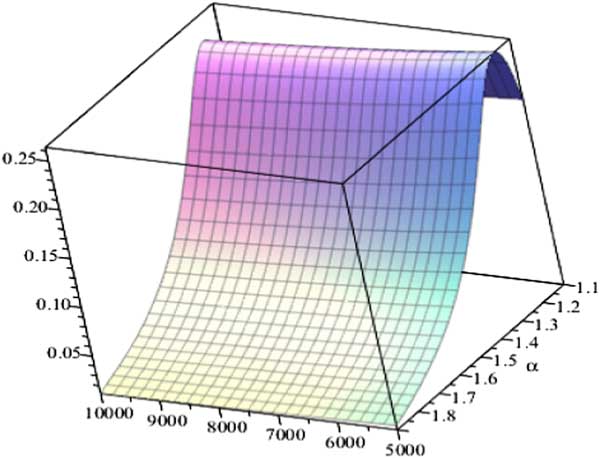
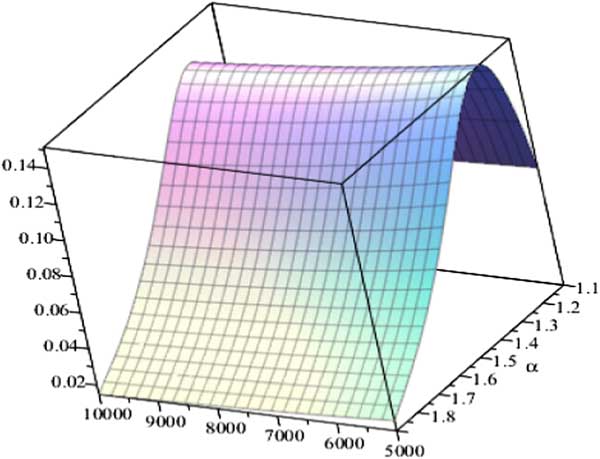
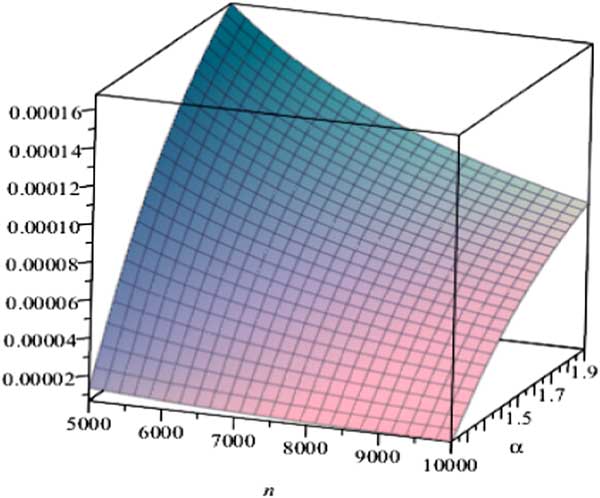
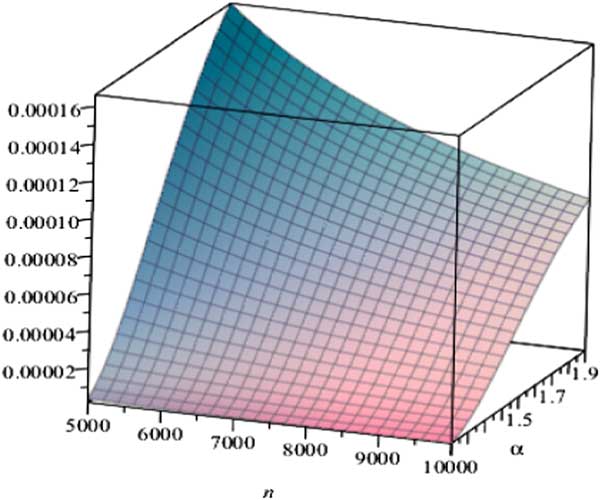
In Figures 1–3, we display isochore VaR – that is (9) – as function of n and α for β=0, −0.3 to 1: the first choice for β corresponds to the symmetric case, while the two other ones are consistent with the negative skewness typically encountered on markets. Putting β=−1 yields the finite moment log stable process (Carr & Wu, 2002). As one can see, VaR is a decreasing function of n (which is obvious) and also a decreasing function of α when α>1.1 in the case β=0, or when α is sufficiently large (about 1.3) when β is negative. More precisely, one can prove that, provided n is sufficiently large, VaR is decreasing as a function of α>1.1. When n is not large enough, VaR increases for 1<α<α* and then decreases, where α* decreases as n tends to infinity and increases as β increases. In practice, n is very large, so we will assume in the sequel that we are in a situation where VaR is indeed decreasing with α.
Isochore Value at Risk as a function of n ranging in [500,10,000] and α ranging in [1.1,1.9] for β=0, p=0.95.

Isochore Value at Risk as a function of n ranging in [500,10,000] and α ranging in [1.1,1.9] for β=−0.3, p=0.95.

Isochore Value at Risk as a function of n ranging in [500,10,000] and α ranging in [1.1,1.9] for β=−1, p=0.95.

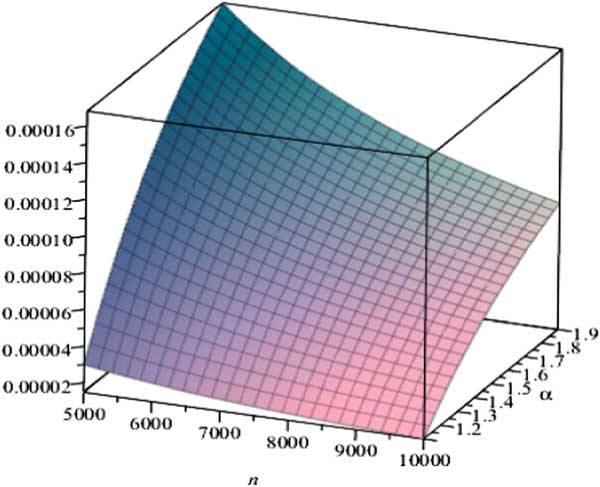
Minimising VaR thus requires to choose the largest possible n and α. As a consequence, one needs to set n=n * as in the Gaussian case. Then, one deduces from Figures 4 to 6, which display isochore σ – that is (8) but with an equal sign rather than an inequality – that this in turn means choosing an intermediate value for the volatility σ: indeed, as is clear from the version of (8) with an equal sign, σ is a decreasing function of n and an increasing function of α.
Isochore σ as a function of n ranging in [500,10,000] and α ranging in [1.1,1.9] for β=0, p=0.95.

Isochore σ as a function of n ranging in [500,10,000] and α ranging in [1.1,1.9] for β=−0.3, p=0.95.

Isochore σ as a function of n ranging in [500,10,000] and α ranging in [1.1,1.9] for β=−1, p=0.95.

To sum up, minimising VaR under a constraint of minimum volume when the distribution of trades are stable requires doing as many trades as possible with largest possible α and intermediate σ: The optimal behaviour consists in maximising the number of trades, as in the Gaussian case, but, this time, instead of minimising the volatility, one minimises the intensity of jumps. Volatility is then fixed by the isochore constraint (i.e. the minimal volume of activity one). Note that this strategy makes intuitive sense: to control risk under a stable market, it is more important to keep the intensity of jumps small, at the expense of letting price movements “breathe” through a medium volatility.
4 Regulation risk: isochore minimisation of VaR with stable log-prices under Gaussian belief
Assume now that actors wrongly believe in a Gaussian market, while the actual dynamics is stable non-Gaussian. As computed above, they will tend to maximise their number of trades, keeping volatility as small as possible. In doing so, they will also select mechanically the smallest reachable α: in the end, this will result in the worst possible VaR for this particular number of trades. Indeed, here is the detail of what will happen in the situation we consider:
A. Gaussian belief
1. Individual trades or log-price movements are believed to be Gaussian.
2. Actors aim at minimising their VaR in a way that preserves a minimum volume of activity. As we have seen, since all constraints are binding, this amounts to an isochore constraint.
3. In that view, they will tend to place “many” trades (i.e. n will be large), and keep σ small (using the notations above), as shown in section 3.1.
B. Stable movements
1. Actual movements are stable non-Gaussian. Although this assumption is certainly wrong, we recall that qualitatively similar results hold as soon as the distribution of movements has sufficiently fat left tails, a fact which is widely recognised both in the literature and by practitioners.
2. Because of Gaussian belief, point A.3 above says that investors tend to trade with a small σ.
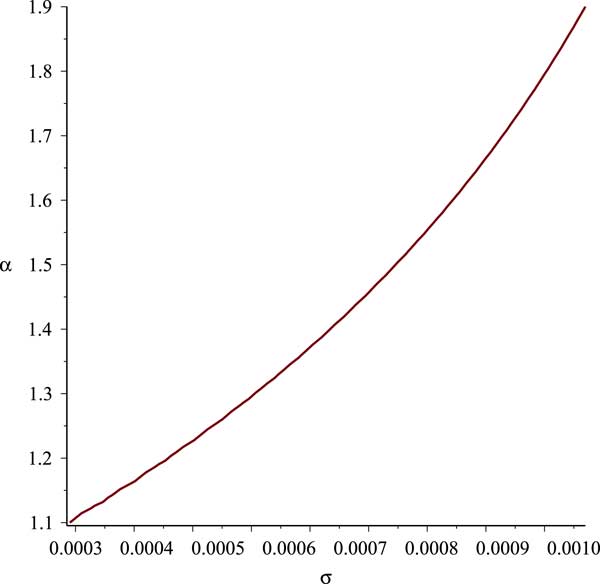
3. As is indicated by Figure 7, the curve α=α(σ) at constant minimal volume (this constraint is binding) is increasing. As a consequence, and because of the isochore constraint, a small σ translates into trades being performed with a small α.
C. Resulting regulation risk
1. Point A.3 tells us that the largest possible n will be chosen.
2. Since investors try to place many trades with a small σ, Point B.3 imposes that also a small α will govern transactions.
3. For n big enough, VaR is a decreasing function of α (see Figures 1–3).
4. As a result, with n=n *, and smallest σ chosen by the investor and consequently smallest α imposed by the isochore constraint, we see from Figures 1–3 that, at the end, the largest possible VaR for this number of trades will occur.
α as a function of σ as constant volume.

It is perhaps worthwhile to comment a little bit on what our results reveal about the behaviour of investors in practice. As we have mentioned, under the common belief in Gaussian dynamics, actors try to place “many small trades”. More precisely, they decide that the typical absolute size of their trades is of the order of σ, where σ is a “small” positive number. Now, if the Gaussian assumption was correct, fluctuations around this value would also be of the order of σ. However, under stable dynamics, while the average value of the trades will still be of the order of σ – because this is the decision taken by the actors (as an example, for α=1.5, β=−0.5, the mean value of a trade is 1.9σ), the fluctuations around it will be extremely large: because of the VaR and minimum volume of activity constraints, investors, who try to put trades with given “small” average absolute value, will be forced to depart very significantly from this value much more often than if, as they believe, the markets were Gaussian. In other words, as soon as the market may jump, the Gaussian beliefs of actors coupled with the minimum volume of activity and VaR constraints will lead to a market with large intensity of jumps: actors trying to fulfil their constraints will try to place trades with small σ, but they will “often” have to put orders with wildly varying magnitude. This is the mechanism through which α is decreased: it is due to positive actions of investors even though they have no intention to fix it in this way. Thus, while σ is governed by the mean value of trades, α is fixed by the way in which the magnitude of these trades varies in time. Alternatively, it may be deduced from the distribution of the iid trades of the various actors at a given time.
5 Case of full correlation
In periods of crises, actors on the markets tend to trade in a correlated way. We briefly examine in this section how our results are modified if, instead of assuming independence of individual trades, we hypothesise to the contrary that they are “fully correlated” in the sense that all actors, at all times, behave exactly in the same way. In other words, during the considered period, each of the n
A
actors places the same trade at each time:
 $$X_{j}^{{\left( i \right)}} \,{\equals}\,X_{j}^{{\left( {i'} \right)}} $$
for all
 $$i,i'\,{\equals}\,1,\,\ldots\,,n_{A} $$
. We shall denote their common value by X
j
. Admittedly, this is a rather extreme case of correlation, but it allows us to understand in which direction the results above get modified in situations of crises. (1) transforms into
 $$S\,{\equals}\,S_{0} {\plus}n_{A} \mathop{\sum}\limits_{j\,{\equals}\,1}^{n_{T} } X_{j} $$
where
 $$n_{T} \,{\equals}\,n_{T}^{{\left( 1 \right)}} $$
, and (3) becomes
 $$V\,{\equals}\,n_{A} \mathop{\sum}\limits_{j\,{\equals}\,1}^{n_{T} } \!\mid\!X_{j} \!\mid\,$$
Though successive trades are probably also correlated during crises, we ignore this fact below.
In the Gaussian case, the log-price now follows an
 $$N\left( {0,\sqrt {n_{T} } n_{A} \sigma } \right)$$
law. As a consequence, VaR is proportional to
 $$\sqrt {n_{T} } n_{A} \sigma $$
. However, the expected volume is still
 $$n\sigma \sqrt {{2 \over \pi }} $$
, where, in keeping with the notations of the independent case, n=n
A
n
T
. Isochore minimisation of VaR amounts to minimisation of
 $${1 \over {\sqrt {n_{T} } }}$$
: here again, the optimal solution is to maximise the number of trades, that is, to set
 $$n_{T} \,{\equals}\,n_{T}^{{\asterisk}} $$
, as in section 3.1. The minimum volume constraint then yields as before that actors choose the smallest possible σ.
Let us turn to the case where individual trades follow a stable law. The log-price is then distributed as an
 $$S_{\alpha } \left( {n_{T}^{{{1 \over \alpha }}} n_{A} \sigma ,\,\beta ,\,0} \right)$$
RV. The volume still reads
 $$V_{S} \,{\equals}\,{{2n\sigma } \over \pi }H\left( {\alpha ,\beta } \right)$$
while
 $$\:{\rm VaR}_{S} \,{\equals}\,n_{A} \sigma \left( {{{n_{T} C_{\alpha } \left( {1\,{\minus}\,\beta } \right)} \over {2\left( {1\,{\minus}\,p} \right)}}} \right)^{{{1 \over \alpha }}} $$
Constraints are still binding. At constant minimum volume, minimising VaR S then amounts to minimising the quantity
 $${{n_{T}^{{{1 \over \alpha }\,{\minus}\,1}} } \over {H\left( {\alpha ,\beta } \right)}}\left( {{{C_{\alpha } \left( {1\,{\minus}\,\beta } \right)} \over {2\left( {1\,{\minus}\,p} \right)}}} \right)^{{{1 \over \alpha }}} $$
Not surprisingly, this is the same as (9) except that n is replaced by n T . Comparing with the Gaussian case, we see that the dichotomy in the particular situation of correlation considered here is the same as in the independent framework of section 3 with the only difference that n has to be substituted everywhere with n T . Thus the analysis of section 4 holds without modification: correlations do not qualitatively alter our conclusions.
6 Expected Shortfall (ES) instead of VaR as a measure of risk
VaR is simple to understand, and it reflects adequately certain aspects of risk. It does, however, present some well-known shortcomings (Embrechts et al., Reference El Mekeddem and Lévy Véhel1999; Danielsson et al., 2001; International Actuarial Association (IAA), Reference Fama2010). First, it is not a coherent measure of risk, in the sense that it is in particular not sub-additive: in general, the VaR of X T +Y T is not necessarily smaller than or equal to the sums of the VaRs of X T and of Y T . This is counter-intuitive, for instance, because it does not account for the reduction in risk typically entailed by diversification. In this respect, we note, however, that, in our frame where X T follows an α-stable distribution, this problem does not arise: as shown in Sy (Reference Sato2006), VaR is a coherent risk measure for sums of independent stable RV when α≥1.
Another significant limitation of VaR is that it does not give any indication of what happens beyond VaR, although this is crucial information. This is why various other risk measures are used to complement it. We consider briefly in this section if and how our analysis is modified if we consider the risk measure called ES instead of VaR. ES was recommended by the IAA (Reference Fama2010) report and has recently been adopted by the Basel regulation (Basel Committee on Banking Supervision, 2010). ES at confidence level 1−p and horizon T is defined as:
 $$\:{\rm ES}\,{\equals}\,{\Bbb E}\left( {X_{T} \!\mid\!X_{T} \,\lt\,{\minus}{\rm VaR}} \right)$$
In words, ES gives the mean loss beyond VaR. It is a coherent risk measure.
In the stable case, and assuming α>1, it can be shown (Zhu & Li, Reference Carr and Wu2010; Le Courtois & Walter, Reference Le Courtois and Walter2014) that, when p tends to 1
 $${\rm ES}\,\sim\,{\alpha \over {\alpha \,{\minus}\,1}}\:{\rm VaR}$$
Armed with this formula, the interested reader will easily convince himself that results qualitatively similar to those of section 4 still hold for ES. In other words, measuring risk with ES rather than with VaR does not make the situation any better: even though individual actors try to minimise ES, an erroneous Gaussian assumption on price movements will lead them to take actions that in fact maximise it if those movements are stable.
7 Conclusions and perspectives
In the previous sections we arrived at the result that minimisation of VaR under a constraint of minimum volume of activity and Gaussian belief, when actual movements are stable, results in maximising VaR. Let us stress again that the Gaussian/stable assumptions are not strictly required for the mechanism sketched above to hold. A similar scenario occurs as soon as trades/log-prices have significantly fatter left tails than is commonly believed. Moreover, the more robust ES measure of risk does not lead to qualitatively different conclusions. Since (a) the VaR constraint is thought of essentially in a Gaussian universe in the current regulations and (b) it is commonly acknowledged that actual price movements display jumps and follow skewed distributions, it is likely that today’s markets are indeed in a configuration that fits our analysis. Indeed, fundamentally, our contribution is summarised as follows:
∙ regulations are typically conceived under an (often hidden) postulate that market dynamics obey a geometric Brownian motion (or, more generally, a continuous diffusion with “moderate ” – e.g. Poisson – jumps);
∙ the actual dynamics contains jumps of all sizes and are fat left-tailed;
∙ this discrepancy between actual and modelled dynamics, plus the fact that regulations are model-based, propagates model risk to a regulation risk.
In the situation analysed here, the propagation is mediated by the constraint on VaR. Other elements in the prudential rules may also give rise to regulation risk, such as, for instance, the particular value of the confidence level or the length of the holding period. Undertaking studies in this direction may be worthwhile.
From a broader perspective, we would like to stress that not only regulations, but also many actions taken by financial authorities are designed in a conceptual framework where volatility is all there is to risk. As we show in this work, incorporating at least another dimension related to jumps is essential for proper control. In this respect, it would certainly be interesting to analyse quantitatively what is the impact on market stability of the various measures taken by central banks in recent years, such as Zero Interest Rates Policies, Large Scale Assets Purchases, Forward Guidance or Long Term Refinancing Operations, when one takes into account the jump dimension of risk. Such measures led to typically very low volatility on the markets. But, as C. Borio of Bank for International Settlements (BIS) recently stated, “history teaches us that low volatility and risk premia are not the signs of smaller risk, but rather that investors are ready to take large risks. The less investors fear risk, the more dangerous the situation is” (Reference Sy2014). In terms of our analysis above, recent monetary policies seem to lower σ at the expense of decreasing also α. This view is supported by a number of studies in recent years by the BIS. For instance, BIS Monetary and Economic Department (Reference Zhu and Li2014) argues that the accommodative monetary policy pushed volatility to low levels in various ways: directly by reducing the amplitude of interest rate movements and by removing to a large extent uncertainty about interest rate changes; and indirectly because an environment of low yields on high-quality benchmark bonds favours risk-taking. Investors then tend to have a lower perception of risk, and thus be inclined to take riskier positions. Again, in our framework, this corresponds to a situation with potentially smaller scale parameter (or volatility) but larger intensity of jumps. It would certainly be worthwhile to pursue further work on a quantitative modelling of the mechanisms just mentioned that tend to diminish both σ and α using the apparatus set in this article.
Acknowledgements
The author is grateful to SMABTP for financial support. This work has benefited from many stimulating exchanges of ideas with P. Desurmont, O. Le Courtois, H. Rodarie and C. Walter.
Appendix: Stable RV
The use of stable RV allows us to take into account jumps in movements of prices. Indeed, almost surely, a stable motion (i.e. a stochastic process with iid increments following a stable law) have everywhere dense jumps. Stable motions, and more generally, pure jumps processes with infinite activity (infinite number of jumps), offer an alternative way to model activity on markets as compared to continuous diffusions such as Brownian motion. Indeed, in practice, prices do evolve in a discrete, discontinuous fashion, with most jumps being “small ones”. This is exactly how pure jumps processes considered in financial modelling move. These are thus fitted to describe the dynamics both in “calm” as well as in “agitated” periods.
Recall that a RV follows a stable law if its characteristic function
 $$\varphi $$
reads(sign(u) denotes the sign of u) (Sato Reference Sato1999):
 $$\varphi \left( u \right)\,{\equals}\,\left\{ {\matrix{ {{\rm exp}\left\{ {i\mu u\,{\minus}\,\sigma ^{\alpha } \left| u \right|^{\alpha } \left[ {1{\minus}i\beta \:{\rm sign}\:\left( u \right){\rm tan}\left( {{{\alpha \pi } \over 2}} \right)} \right]} \right\}\;{\rm if}\,\alpha \,\ne\,1} \hfill \cr {{\rm exp}\left\{ {i\mu u\,{\minus}\,\sigma \left| u \right|\left[ {1{\plus}i\beta \:{\rm sign}\:\left( u \right){2 \over \pi }{\rm ln}\left( u \right)} \right]} \right\}\;\;{\rm if}\,\alpha \,{\equals}\,1} \hfill \cr } } \right.$$
Choosing α=2 above yields the characteristic function of a Gaussian RV, a case we exclude from now on. As the definition of
 $$\varphi $$
shows, stable laws are characterised by four parameters:
1. The number α ranges between 0 and 2, and it quantifies the distribution of the size of jumps: within a given period of time, and for any integer j, the mean number of jumps of a stable motion, whose increments follow a stable law with parameter α, that are of size of order 2 j is proportional to 2 −jα . In particular, the mean number of jumps larger than any non-zero threshold is always finite: “most” jumps are “small” as announced above. Besides, when α is large (close to 2), the mean number of jumps decreases fast when their size increases, while, when α is close to 0, it decreases slowly: a large α corresponds to a small jump intensity, and vice-versa.
2. The positive real σ is a scale parameter: multiplying the RV by a>0 transforms σ into aσ (in the Gaussian case, 2σ 2 is the variance). One may thus identify σ as governing volatility.
3. The real number µ is a location parameter: adding a to the RV transforms µ into µ+a. Also, when α>1, µ coincides with the expectation of the RV.
4. The real number β, which ranges in [−1,1], is a skewness parameter. A distribution that is symmetric around µ has β=0.
Finally, we recall that the sum of n independent stable RV X
i
with parameters (α, σ, β, 0) is again a stable RV with parameters
 $\big( {\alpha ,\big( {\mathop{\sum}\nolimits_{i\,{\equals}\,1}^n \sigma _{i}^{\alpha } } \big)^{{{1 \over \alpha }}} ,\beta ,0} \big)$
.
Our main focus in this work is on the parameters α and σ, which we recall account, respectively, for the jump intensity and the volatility. We also briefly analyse the influence of β, which controls the skewness found in empirical returns.