


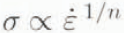
 was used to describe the response to strain rate of S1 ice loaded across the columns at –10° C. The rate exponent, n, decreased with increasing strain from about 4.6 at an observed peak on the load displacement curve to approximately 2.6 at a shortening of 2%. Analysis of these results and of the results of other authors on different forms of ice deformed at the same temperature suggests that the power law exponent, n is proportional to F
During an investigation of the ductile compressive failure of S1 ice (designation of Reference Michel, and Ramseier,Michel and Ramseir, 1971), we performed a series of experiments to determine the strain-rate sensitivity, n, of the flow stress

The Sl ice was grown unidirectional as a sheet from fresh water. The procedure and the material are fully described elsewhere (Reference Manley,Manley. 1996). The ice consisted of columnar-shaped grains about 8 mm in diameter whose crystallographic c axes were parallel to the long axes of the columns to within ±5° . Plate-like specimens (159 mm x 159 mm x 25 mm) were milled from the sheet, with the columns perpendicular to the large faces. Five specimens were then compressed uniaxially across the columns (i.e. along a direction more or less within the basal plane) using a servo-hydraulic loading frame, at a temperature of –10 ± 0.2° C. Each specimen was initially strained at a constant but different rate (


The ice kinked in every experiment, owing to the load being applied in the basal plane. An analysis is given elsewhere (Reference Manley, and Schulson,Manley and Schulson, 1997). This feature, however, did not prevent the rate sensitivity from being determined. The stress–strain curves are given by Reference Manley,Manley (1996). Upon analysis, they showed that the sensitivity decreased from n = 4.6 at an axial strain of 0.003 to n = 2.6 at a strain of 0.02 (Fig. 1). The vertical bars denote the spread in values obtained from the different specimens.
The exponent, n, from the relation


To rationalize this dependence, we assumed that the ice deformed by both the glide of dislocations in the basal plane and the climb of dislocations out of the basal plane, following Reference Duval,, Ashby, and Andermn,Duval and others (1983) and Reference Weertman,Weertman (1983). We then calculated the ratio of the climb force, F e, to the glide force. F g, on the dislocations within the kink band, by knowing the lattice rotation from the optical analysis given elsewhere (Reference Manley, and Schulson,Manley and Schulson, 1997) and by making the transformation given in the Appendix. We found that n increased more or less linearly with the ratio F e/F g (Fig. 2a). We made a similar calculation for S2 fresh-water ice (where the c axes are randomly oriented within a plane more or less perpendicular to the long axis of the columnar grains (Reference Michel, and Ramseier,Michel and Ramseier. 1971: Reference Michel, and Ramseier,Michel. 1978) deformed at –10° C by compressing biaxially across the long axis of the columns (Reference Schulson, and Buck,Schulson and Buck, 1995), as shown in the Appendix (Fig. 5). The results fit the same curve (Fig. 2a). Finally, we made the analysis for S2 saline ice of 4–5 ppt salinity, also loaded biaxailly across the columns at –10° C (Reference Kuchn,Kuchn, 1993; Reference Schulson, and Nickolayev,Schulson and Nickolayev, 1995). Again, n increased more or less linearly with increasing F e/F g (Fig. 2b).
Plots of n values at –10° C vs F e/F g for (a) fresh-water columnar ice and (b) saline columnar ice. Although five points are shown the present work in (Fig. 1, only three points are shown here, because we determined the kink reorientation for the S1 ice in only three cases (Reference Manley, and Schulson,Manely and Schulson, 1997).

Thus, it appears that to a first approximation n=n o+kF c/F g where n o is about 2 and 2.8 for fresh-water and salt-water ice, respectively, and к is around 0.2 for both materials at –10° C.
We suggest that this relationship reflects a transition from essentially two-dimensional (glide) to three-dimensional (glide plus climb) dislocation motion as n increases from 2 to 3. The higher n values may reflect a non-linear dependence of dislocation velocity on stress. It is interesting to note, however, that our criterion predicts that n = 2.2 for uniaxially loaded single crystals whose basal planes are inclined 45° to the direction of loading. This is in agreement with the value n = 2.1 obtained by Reference Kuchn, and Glen,Homer and Glen (1978) who crept such crystals at –10°C.
Hopefully, this note will stimulate further discussion.
Acknowledgements
We would like to thank E. Gratz and J. Mellon for their help with laboratory equipment. Also, we acknowledge the helpful comments by the anonymous reviewers. The work was supported by the U.S. Army Research Office, grant No. DAAL03-92-G-0187.
Appendix Calculations of F c/F g
Consider an edge dislocation within a volume element (Fig. 3). The climbing force is related to the normal stress by F c=bσn, where b is the Burger’s vector. The glide force is related to the shear stress by F g=bσs. So

Calculation for S1 ice loaded uniaxially
Assuming a uniform applied stress (Fig. 4), the stresses on a volume element containing a basal edge dislocation on the


and

where θ is the tilting angle of the basal planes within the kink band (Reference Manley, and Schulson,Manley and Schulson, 1997). Using Equation (Al), the ratio is

The ratio decreases as θ increases from near zero to π/4. The ratio approaches infinity θ = 0. At this point basal glide cannot occur.
Sketch of glide and climb forces on an edge dislocation.

Sketch showing reorientation of basal slip plane within kink.

Calculation for S2 ice loaded biaxially
For this case the basal planes (shown as lines crossing the columns; Fig. 5) of individual columns are oriented randomly with respect to the principal stresses (the columns are pointing out of the page in the figure). For an individual column having its basal plane oriented at some angle α with respect to the maximum principal stress axis (σι) the ratio is

For a given angle (>0) the function increases as R 21 increases to near unity. The ratio approaches infinity at ∝=0, π/2 and also when R 21=1. A global ratio for a given specimen was found by assuming the average angle is α = 19.5° . A single crystal placed at this angle with respect to the loading direction would have the same average Schmidt factor as the average factor (0.32) for S2 ice.
Sketch showing across-column biaxial loading of S2 ice. Traces of the basal planes are shown.



