1. Introduction
In developing countries, microfinanceFootnote 1 is one of the main drivers for financial inclusion (Labie and Montalieu, Reference Labie and Montalieu2019) and has grown considerably since the beginning of the 21st century. Figure 1 shows that between 2010 and 2018, the size of credits granted each year by microfinance institutions (hereafter MFIs) has soared from 54 Mds in 2010 to 124 Mds in 2018 worldwide. Meanwhile, the number of borrowers has risen from 105 M in 2010 to 140 M in 2018.Footnote 2 This impressive expansion is mainly explained by the lack of access to conventional financial services in many developing countries. By facilitating access to credit, the microfinance sector allows the poorest households to invest in productive projects (Dalla Pellegrina (Reference Dalla Pellegrina2011)) and to get access to a better education (Adjei et al. (Reference Adjei, Arun and Hossain2009)). Thus, microfinance contributes to the financial inclusion of populations that are excluded.
In response to the rapid growth of MFIs, an increasing number of studies have started examining the economic effects of microfinance. Since the initial objective of microfinance was to improve the well-being of poor people, these works are mainly concerned with the effects of microfinance on poverty, inequality, education, health, and, to a lesser extent, the empowerment of women. The large majority of these studies use survey data and provide analysis at the microeconomic level. Among the most interesting are the works of Karlan and Zinman (Reference Karlan and Zinman2010) on South Africa, Karlan and Zinman (Reference Karlan and Zinman2011) on the Philippines, Augsburg et al. (Reference Augsburg, De Haas, Harmgart and Meghir2015) on Bosnia and Herzegovina, Tarozzi et al. (Reference Tarozzi, Desai and Johnson2015) on Ethiopia, Angelucci et al. (Reference Angelucci, Karlan and Zinman2015) on Mexico, and Banerjee et al. (Reference Banerjee, Duflo, Glennerster and Kinnan2015) on India. The conclusions of these studies are mixed. Some find that microfinance improves the socioeconomic status of poor people by reducing poverty and inequality, some find no effect, and some even find that microfinance increases poverty (Banerjee and Jackson, Reference Banerjee and Jackson2017).
Due to the lack of large databases on microfinance institutions until very recently, there has been much less work at the macroeconomic level. However, contrary to microeconomic studies, these works globally conclude that microfinance contributes to reducing inequality and poverty (Imai et al. (Reference Imai, Gaiha, Thapa and Annim2012), Hermes (Reference Hermes2014), and Bangoura et al. (Reference Bangoura, Mbow, Lessoua and Diaw2016)). Therefore, even if microfinance does not reduce inequality and poverty in all countries—given the specific constraints and structural framework within which each of these economies operates—it nevertheless reduces inequality and poverty at a global level. According to Bangoura et al. (Reference Bangoura, Mbow, Lessoua and Diaw2016), this could be explained by the fact that microfinance would stimulate growth, thus reducing poverty.
Existing literature presents contrasting perspectives on the link between microfinance and economic development. Cull and Morduch (Reference Cull and Morduch2018) provide a comprehensive overview of the literature to analyze the heterogeneous effects of microfinance institutions (MFIs) on poverty reduction, highlighting persistent debates about their transformative efficacy. In particular, while Donou-Adonsou and Sylwester (Reference Donou-Adonsou and Sylwester2017) observe, using a panel of 85 developing countries, a positive correlation between microfinance loans and economic growth-attributed primarily to gains in total factor productivity rather than capital accumulation Smolo (Reference Smolo2023) identifies an asymmetric and predominantly negative long-term relationship in the specific context of Bosnia and Herzegovina, limiting the generalizability of these findings. Moreover, Abrar et al. (Reference Abrar, Hasan and Kabir2021) demonstrate that MFIs enhance financial development and the efficiency of commercial banks through competitive effects, acting as complements to the formal banking sector1. However, to date, no clear cross-country empirical evidence exists on the structural role of microfinance markets in promoting economic growth, particularly regarding its channels and optimal configuration.
Evolution of the size of the microfinance sector over time.

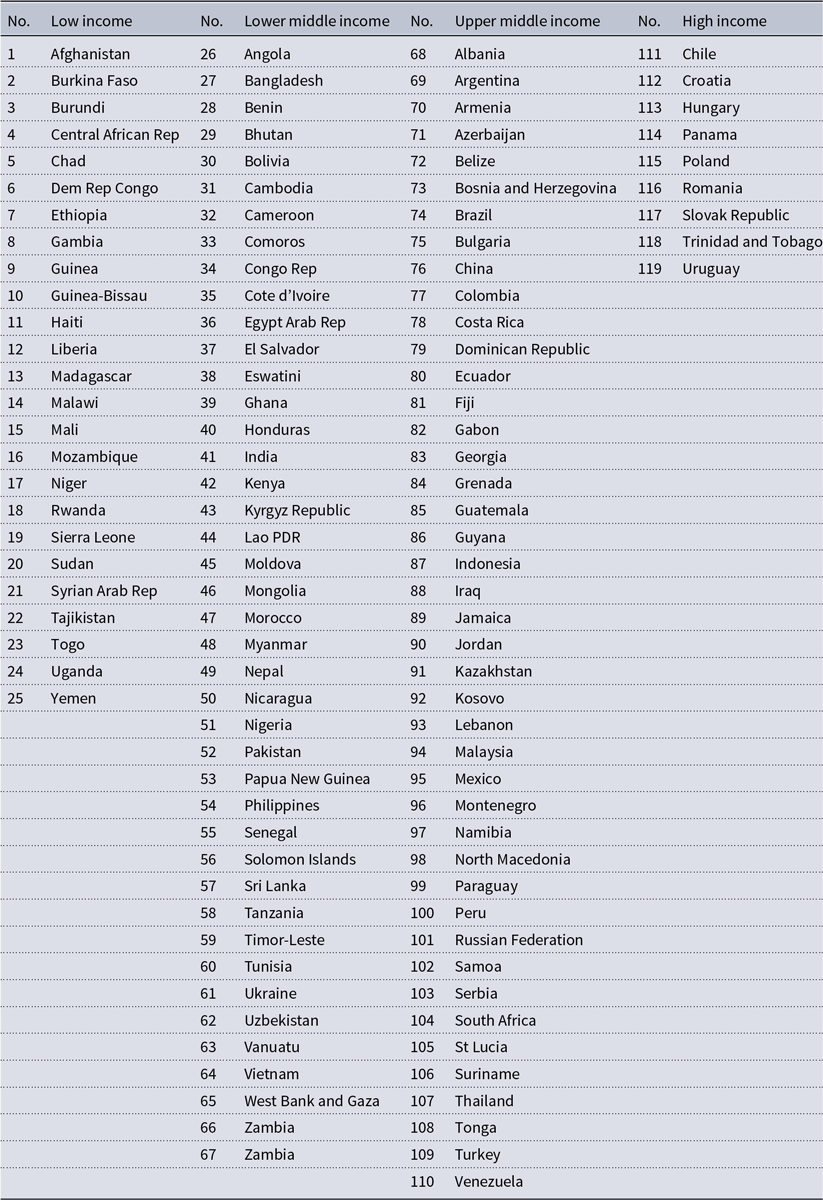
The purpose of this paper is to fill this gap in the literature and to assess the relationship between microfinance, competition, and growth in developing countries. To this end, we use a large panel of 119 emerging and developing countries over the 1999–2018 period (Tables 1–19).
Our contribution to the literature is fourfold. First, our results show that microfinance strongly contributes to increase growth, in particular in low- and middle-income countries. Second, we study the channels through which microfinance positively affects growth. In particular, we show that microfinance boosts investment and consumption which are essential determinants of economic growth. Third, we also analyze the substitutability/complementary between the microfinance sector and the conventional financial sector. In this respect, we show that both sectors are substitutes and not complements. Fourth, compared to the paper of Lacalle-Calderón et al. (Reference Lacalle-Calderón, Chasco, Alfonso-Gil and Neira2015), this study offers a reflection on the optimal structure of the microfinance market and highlight a negative relationship between the degree of concentration of the microfinance sector and growth. In other words, the more concentrated the microfinance sector is, the lower its impact on growth. From a policy perspective, encouraging the development of a competitive microfinance sector must therefore be a top priority in developing countries with low access to the conventional financial sector.
The remainder of the paper is organized as follows. The next section describes the data. Section 3 discusses the relation between microfinance and economic growth. Section 4 examines the optimal structure of the microfinance sector. Section 5 concludes.
2. Data
We conduct an empirical analysis on a large unbalanced panel of 119 emerging and developing countries over the period 1999-2018. The selection of countries is based on the availability of data. Specifically, all countries for which microfinance data were available have been included in our sample.Footnote 3
Our data on microfinance stem from the Microfinance Information Exchange (MIX) database. MIX is a nonprofit organization whose purpose is to promote financial inclusion by providing easily accessible data and specialized information services. MIX contains the largest and the most accurate collection of microfinance data. It provides information on more than 3000 MFIs and 100 millions borrowers in more than 100 emerging markets worldwide. All in all, MIX is the most used dataset in the recent literature on microfinance (Ahlin et al. (Reference Ahlin, Lin and Maio2011), Hermes et al. (Reference Hermes, Lensink and Meesters2011), Bauchet and Morduch (Reference Bauchet and Morduch2013), Imai et al. (Reference Imai, Gaiha, Thapa and Annim2012), Wagner and Winkler (Reference Wagner and Winkler2013), and D’Espallier et al. (Reference D’Espallier, Goedecke, Hudon and Mersland2017)).
In order to measure the size of the microfinance sector in a given country, we use the logarithm of the Gross Loan Portfolio (GLP) per capita indicator. This variable includes all outstanding principals due for all outstanding client loans. This encompasses current, delinquent, and renegotiated loans, but not loans that have been written off. In other words, this index can be considered as a good proxy of the size of the microfinance sector. Moreover, MIX provides microfinance data at the country level but also at the institution level. In our study, country-level data are used to examine the relation between microfinance, investment, and economic growth and institution level data are used to study the growth-maximizing structure of the microfinance sector in terms of competition and concentration.
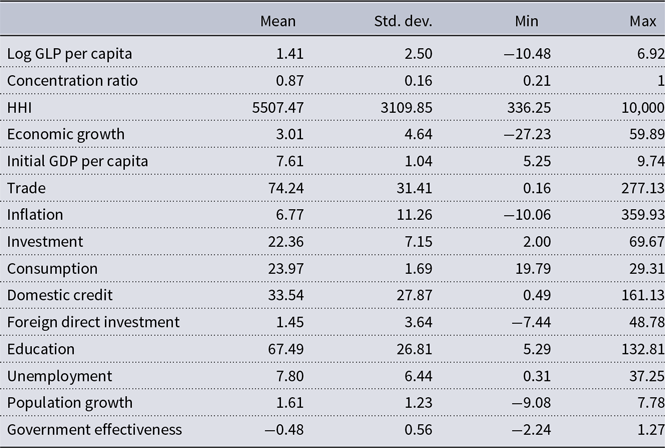
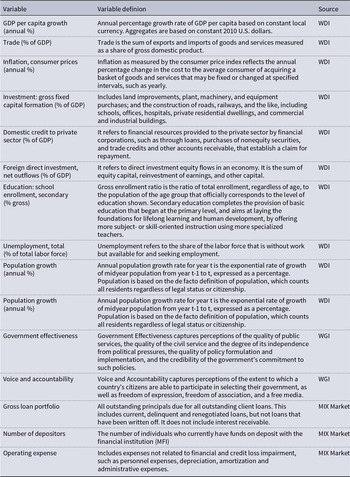
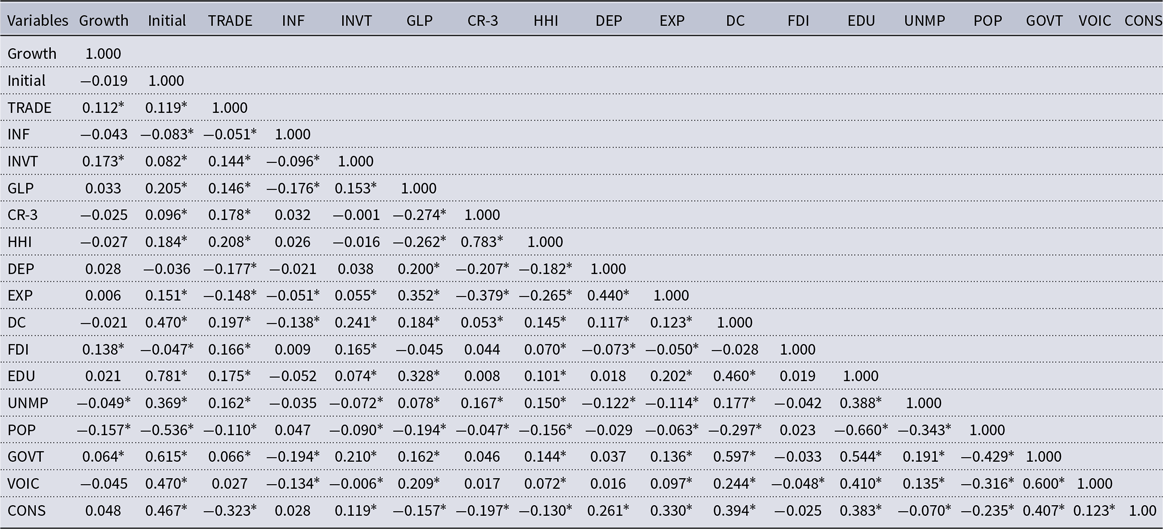
Other variables include the usual determinants of economic growth. All come from the World Development Indicators (WDI) and the World Governance Indicators (WGI) databases of the World Bank. We include investment (Khan and Reinhart (Reference Khan and Reinhart1990)), openness (Harrison (Reference Harrison1996)), and inflation (De Gregorio (Reference De Gregorio1993)), and we use the logarithm of the initial level of real GDP per capita (Barro (Reference Barro1991)) to control for conditional convergence. Moreover, for robustness purposes, we successively include domestic credit (King and Levine (Reference King and Levine1993)), foreign direct investment (Borensztein et al. (Reference Borensztein, De Gregorio and Lee1998)), government effectiveness (Alam et al. (Reference Alam, Kiterage and Bizuayehu2017), Marakbi et al. (Reference Marakbi, Turcu and Villieu2021)), unemployment (Eriksson (Reference Eriksson1997)), education (Barro (Reference Barro1996)), and population growth (Solow (Reference Solow1956)) as additional control variables.Footnote 4 Table 1 displays some descriptive statistics of our sample, Table 16 (in Appendix) exposes the correlation matrix between regressors and Table 13 (in Appendix) summarizes the variables and sources of information used.
Descriptive statistics

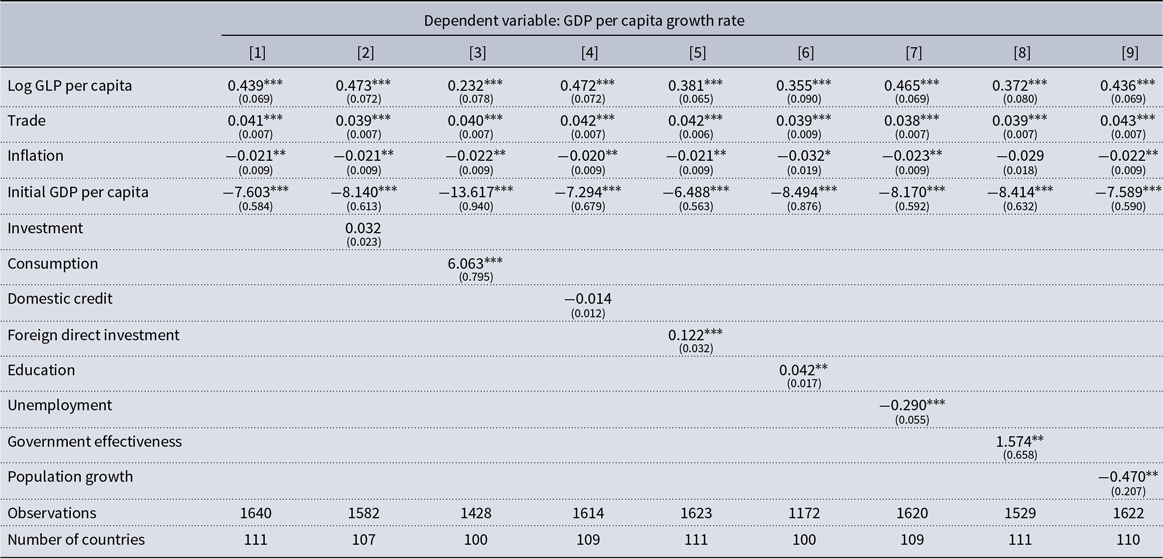
Fixed-effects regressions before endogeneity correction
Standard errors are in parentheses. Significance Codes, *** : 0.01; ** : 0.05; * : 0.1.
3. How does microfinance affect growth?
In this section, our analysis is organized around three major issues. First, we explore the relation between the size of the microfinance sector and economic growth. Second, we focus on the of the main channels that may explain the impact of microfinance on growth, namely investment and consumption. Third, we investigate if microfinance is a substitute or a complement to the conventional financial sector. The general empirical strategy consists in estimating fixed-effects regressions and to address the endogeneity problem using instrumental variables.
3.1 Microfinance and Growth
As a preliminary step in our analysis, we first estimate the following regression model
 \begin{equation} Growth_{it}=\alpha _1GLP_{it}+\alpha _2'X_{it}+\varepsilon _{it} \end{equation}
where
 $Growth_{it}$
corresponds to the GDP per capita growth rate in country
 $i$
at time
 $t$
,
 $GLP_{it}$
is the logarithm of the gross loan portfolio per capita variable that measures the size of the microfinance sector,
 $X_{it}$
is a vector of control variables and
 $\varepsilon _{it}$
is the error term.
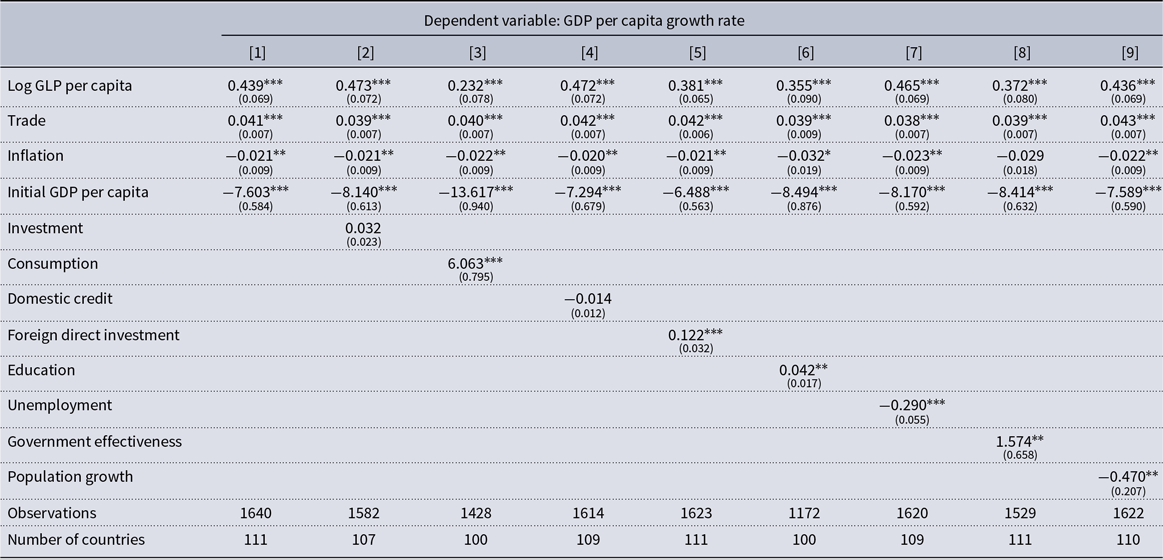
This first step allows us to study the direct impact of microfinance on growth before controlling for potential endogeneity. The results of this first regression are reported in Table 2. The coefficients associated with the logarithm of the GLP per capita are always positive and highly significant. Therefore, any increase in the size of the microfinance sector leads to an increase in the GDP per capita growth rate. This result is robust to the inclusion of a number of additional control variables. In addition, the other determinants of growth have the expected sign and are significant.
Further, as usual in growth regressions, we need to address the endogeneity of the explanatory variables. To this end, we re-estimate Equation 1 using a 2SLS approach. We regress the endogenous regressor on specific instrumental variables and we then regress the GDP per capita growth rate on control variables and the predicted values of the endogenous regressor derived from the first regression. The instruments we use to control endogeneity are of two types. We use internal instruments for all variables except the GLP and external instruments for the GLP. To address the endogeneity of the usual determinants of growth, we use their lagged values in the 2SLS model. For the GLP variable, we resort to two instrumental variables: the number of depositors and the operating expenses. The number of depositor represents the number of individuals who currently have funds on deposit within a microfinance institution. The operating expenses variable includes all expenses which are not related to financial and credit loss impairment, such as personnel expenses, depreciation, amortization, and administrative expenses. Both variables come from the MIX Market database and are expected to constitute good instruments for controlling the endogeneity of microfinance.
The number of depositors is a proxy for the resource base of a microfinance institution. A larger number of depositors typically means the institution has more funds available to lend, which should be closely correlated with the size of its loan portfolio. However, the number of depositors is determined by institutional features (such as outreach, reputation, network) rather than by short-term macroeconomic conditions. Thus, while it is correlated with GLP, it is unlikely to be directly influenced by economic growth, fulfilling the exclusion restriction.
Similarly, operating expenses reflect the scale and administrative capacity of microfinance institutions. Institutions with larger portfolios incur higher operational costs (for staff, infrastructure, risk management, etc.). So again, these expenses are strongly linked to GLP size. At the same time, these costs do not influence GDP growth directly; they are internal to the MFI and not part of macroeconomic policy or aggregate demand. Therefore, they constitute a good instrument for controlling the potential endogeneity of microfinance.
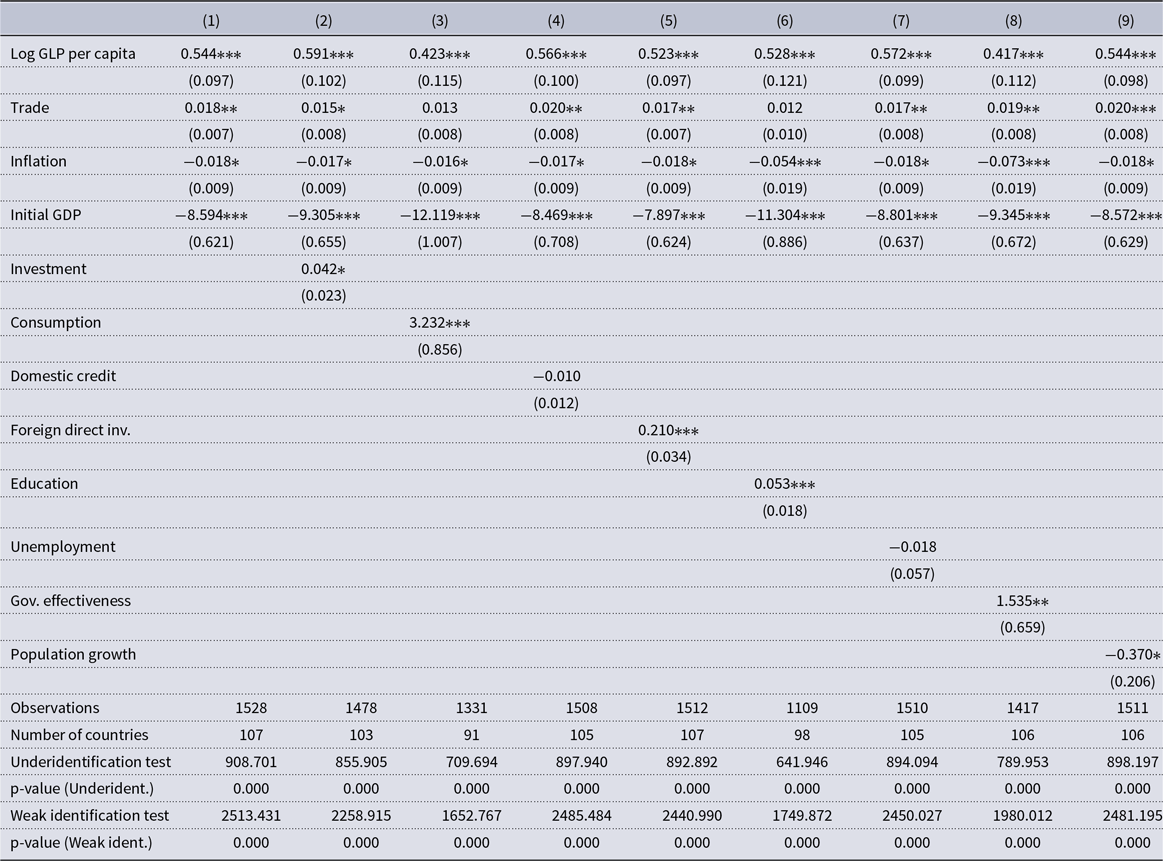
For robustness purposes, we also control the endogeneity of the GLP variable using its lag. Results are shown in Table 19 in Appendix. They show that the effects remain qualitatively unchanged.
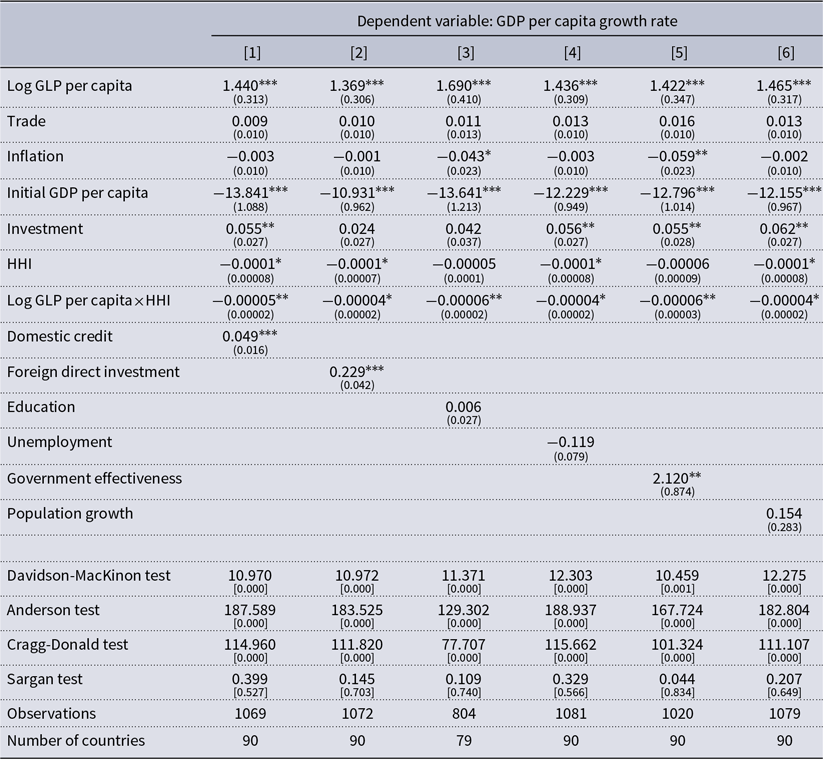
Fixed effects regressions with endogeneity correction

Standard errors are in parentheses. Significance Codes, *** : 0.01; ** : 0.05; * : 0.1. p-value are in brackets.
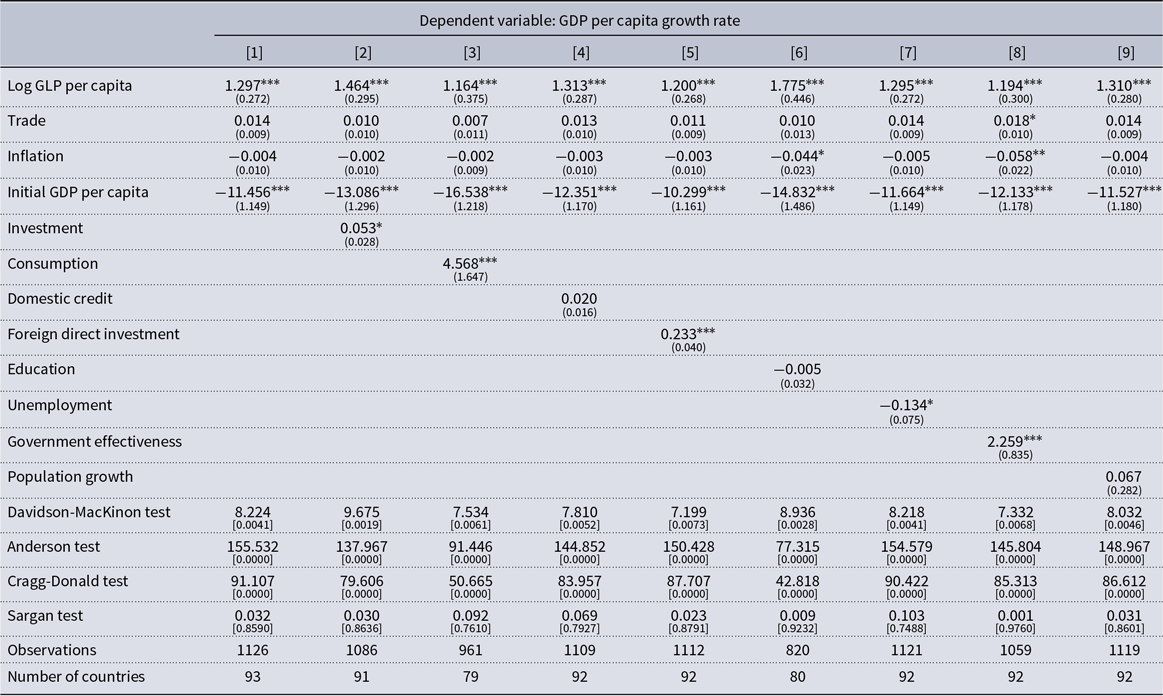
Table 3 reports the results of the second stage estimation.Footnote 5 Overall, they are qualitatively similar to those of Table 2. The values of the GLP coefficients are even higher after correcting for endogeneity and their level of significance remains very high. In addition, Table 3 shows that our selected instruments are statistically valid.Footnote 6 The Anderson and Cragg-Donald tests lead to reject the null hypothesis of underidentification and weak identification. Moreover, regarding overidentification, we do not reject the null hypothesis of the Sargan test. This implies that all excluded instrumental variables are exogenous. Finally, the p-value of the Davidson-MacKinnon test indicates that we should reject the null hypothesis of exogeneity between microfinance and growth, thereby justifying the need for a 2SLS approach. From Table 3, we can then argue that microfinance robustly and significantly contributes to increase economic growth.
3.2 The Channels of the Microfinance-Growth Nexus
In this subsection, we explore the channels through which microfinance can influence economic growth, focusing specifically on two key variables: investment and consumption. According to Buera et al. (Reference Buera, Kaboski and Shin2021), who analyzed data from India and Thailand, approximately 51% of micro-loans are allocated to consumption, while the remaining 49% finance investments. Therefore, the aim of this subsection is to investigate whether microfinance contributes to economic growth via these two channels.
3.2.1 Microfinance and Investment
How does microfinance foster economic growth? In his famous book entitled Creating a World Without Poverty, Muhammad Yunus wrote: “Microcredit is supposed to describe loans offered with no collateral to support income-generating businesses aimed at lifting the poor out of poverty.” Footnote 7 In these lines, the father of modern microfinance expressed his wish to see the poor investing in productive projects. Have microcredits really contributed to boosting investment? If so, it could be one of the main channels through which microfinance positively affects economic growth in addition to reducing to poverty (Imai et al. (Reference Imai, Gaiha, Thapa and Annim2012)).
On this issue, a number of studies of limited scope have already analyzed the behavior of borrowers with regard to the money they have borrowed. Most conclude that microcredits are often used, at least partially, for productive purposes. For instance, Dalla Pellegrina (Reference Dalla Pellegrina2011) has shown that microfinance loans are mainly channeled toward productive and non-agricultural activities. Similar results are found by Imai et al. (Reference Imai, Arun and Annim2010) in India, Imai and Azam. (Reference Imai and Azam2012) in Bangladesh or Schicks (Reference Schicks2014) in Ghana.
The objective of this subsection is to investigate if microfinance programs have contributed on a global scale to increasing investment in productive projects, thus explaining the positive effect of microfinance on growth highlighted in the previous subsection. To do this, we estimate the following model
 \begin{equation} INV_{it}=\beta _1GLP_{it}+\beta _2'Z_{it}+\varepsilon _{it} \end{equation}
where
 $Z_{it}$
is a vector that contains the same control variables as
 $X_{it}$
except investment. To adress the endogeneity issue, we use the lagged values of the regressors.
Fixed effects regressions with endogeneity correction for investment

Standard errors are in parentheses. Significance Codes, *** : 0.01; ** : 0.05; * : 0.1.
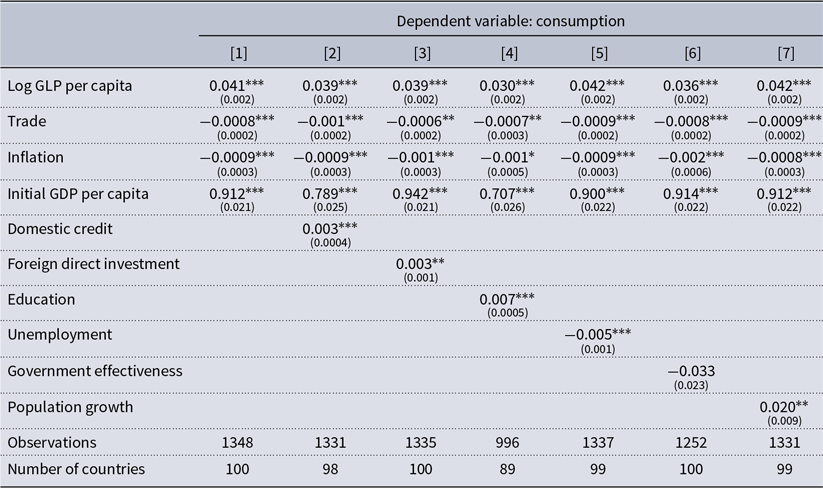
Fixed effects regressions with endogeneity correction for consumption

Standard errors are in parentheses. Significance Codes, *** : 0.01; ** : 0.05; * : 0.1.
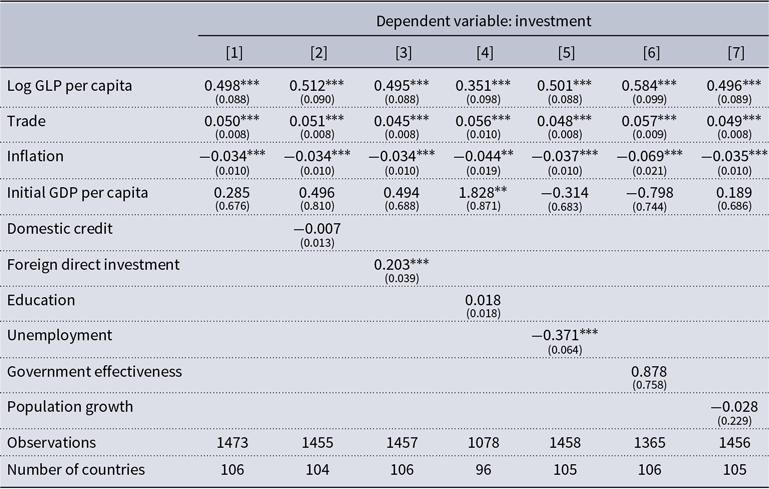
Table 4 generalizes the results of micro studies at the macro level and shows that microfinance programs globally promote investment. The logarithm of the GLP per capita is always positive and significant at the 1% level, regardless of the additional variables introduced into the model. This means that microloans are used in investment projects and not only for consumption purposes. Moreover, all the tests carried out confirm the validity of our instruments. Therefore, since investment is positively related to growth (see Table 3), this variable can be considered as a channel through which microfinance positively affects growth.
3.2.2 Microfinance and Consumption
We have shown that microfinance positively affects growth through the investment channel. Let us now look at whether another channel, namely consumption, can also explain the beneficial effect of the development of the microfinance sector on economic growth.
To do this, we use exactly the same method as above. We regress consumption on GLP and on a set of control variables.
 \begin{equation} CONS_{it}=\beta _1GLP_{it}+\beta _2'Z_{it}+\varepsilon _{it} \end{equation}
As with investment, we can observe that consumption has a positive and significant effect on microfinance. Therefore, we can argue that consumption is a second channel through which microfinance positively affects economic growth. Nevertheless, when comparing the coefficients of the consumption regression with those of the investment regression, we can see that the effect of consumption on microfinance is much smaller than the effect of microfinance on investment. Thus, investment remains the main channel through which microfinance affects growth and consumption, certainly through a mechanism of household wealth generation following the growth of wealth generated by microfinance, also makes it possible to boost economic activity.
3.3 Are the Microfinance and the Conventional Financial Sectors Substitutes or Complements?
For a long time, the development of the conventional financial sector has been considered beneficial for growth (see e.g., King and Levine (Reference King and Levine1993) ; Levine and Zervos (Reference Levine and Zervos1998), Beck et al. (Reference Beck, Levine and Loayza2000)). However, several studies have recently nuanced this opinion. Arcand et al. (Reference Arcand, Berkes and Panizza2015) have shown a negative effect of financial development when credit to the private sector reaches 100% of the GDP. In the same vein, Benczúr et al. (Reference Benczúr, Karagiannis and Kvedaras2019) have found a threshold effect in the finance-growth nexus. According to Summer (Reference Summer2013) and Piketty (Reference Piketty2013), the increase of the size of the financial sector can lead to real negative returns to capital and inequality which, in turn, slow down economic growth. Another explanation is that the majority of credit allocation is no longer directed towards productive investment projects but towards the investment in financial assets (Bezemer et al. (Reference Bezemer, Grydaki and Zhang2014)). Thus, we want to explore if microfinance is a complement or substitute to the conventional financial system.
This question deserves to be explored because the development of the conventional financial sector, in both developed and developing countries ((Arcand et al. Reference Arcand, Berkes and Panizza2015), Ibrahim and Alagidede (Reference Ibrahim and Alagidede2018)), has shown its limits in limiting growth if the capital is not invested in productive activities. We have shown that microfinance stimulates growth through investment. Therefore, it is quite possible that the microfinance sector should be used as a substitute for the conventional financial sector in developing countries in order to maximize its effects on growth.
To address this issue, we introduce an interaction term in Eq. (1) between the logarithm of the GLP per capita and the domestic credit variable
 \begin{equation} Growth_{it}=\gamma _1GLP_{it}+\gamma _2DC_{it}+\gamma _3DC_{it}\times GLP_{it}+\gamma _4'X_{it}+\varepsilon _{it}, \end{equation}
where
 $DC_{it}$
represents the domestic credit used as a proxy of the size of the conventional financial sector.Footnote
8
Note that we control endogeneity using the same instruments as in the previous subsection.
Hence, we can respectively obtain, ceteris paribus, the marginal effects of GLP and domestic credit on growth
 \begin{equation} \frac {\partial Growth_{it}}{\partial GLP_{it}}=\gamma _1+\gamma _3DC_{it} \;\;\;\;\;\; \text{and} \;\;\;\;\;\; \frac {\partial Growth_{it}}{\partial DC_{it}}=\gamma _2+\gamma _3 GLP_{it}. \end{equation}
As shown in Eq. (5), this specification with an interaction term implies that the impact of microfinance on growth depends on the depth of the conventional financial sector and that the impact of domestic credit on growth depends on the depth of the microfinance sector.
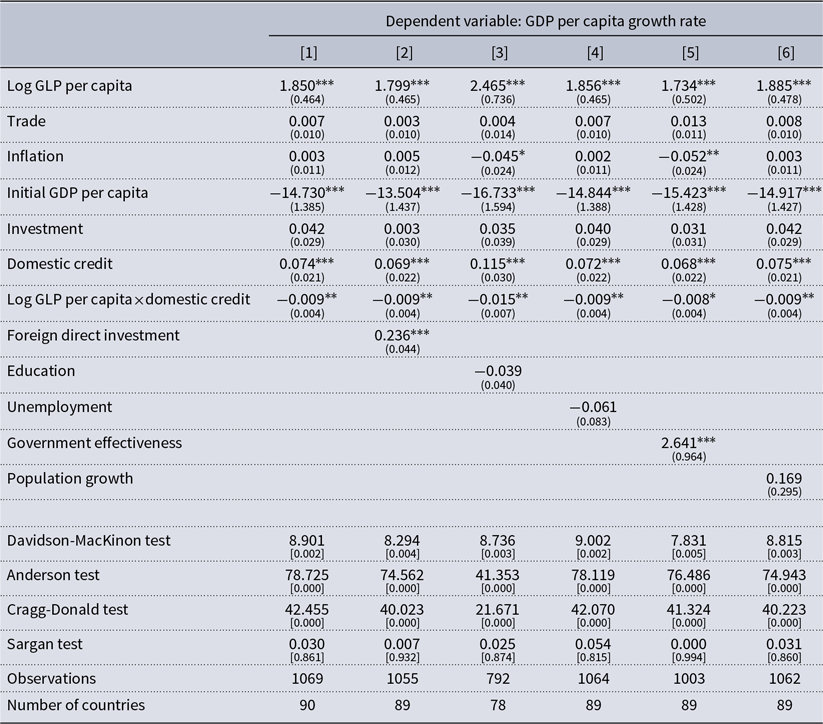
Panel data estimation (IV): substituability of the microfinance and the conventional financial sectors

Standard errors are in parentheses. Significance Codes, *** : 0.01; ** : 0.05; * : 0.1. p-value are in brackets.
Table 6 reports the results of parameter estimation in regression (4). The coefficient associated with the log of GLP per capita and domestic credit are positive and significant, which is consistent with both the previous subsection and the literature on financial development. However, the interaction term between the two variables is significantly negative. Therefore, when the depth of the conventional financial sector increases, the effect of microfinance on growth becomes less and less beneficial. Similarly, a deeper microfinance sector mitigates the impact of a more developed conventional financial sector. Consequently, the conventional financial sector and the microfinance sector can be viewed as substitutes from a growth-maximizing strategy perspective.
4. The optimal market structure of the microfinance sector
In this section, we study the optimal structure of the microfinance sector. To this end, we construct two indicators to measure the degree of concentration of the microfinance sector, namely the concentration ratio (CR-3) and the Herfindahl-Hirschman Index (HHI).
The concentration ratio corresponds to the sum of market shares measured in total outstanding loans of the three largest microfinance institutions (CR-3).Footnote 9 In addition, the HHI is determined by summing the squared market shares of all active microfinance institutions in the market
 \begin{equation} HHI = \sum _{i=1}^{n} s_{i}^{2} \end{equation}
where
 $s_{i}$
is the market share of the microfinance institution
 $i$
and
 $n$
is the number of MFIs. We should note that contrary to the previous section where the data used were national, we resort in this section to institution data. As for national data, they stem for the MIX market database.
4.1 Direct and Indirect Effects of Microfinance Concentration: Preliminary Results
To examine the direct and indirect effects of microfinance concentration on economic growth, we estimate the following regression
 \begin{equation} \small Growth_{ it} = \beta GLP_{it} + \lambda MC _{it} + \gamma X _{it} + \theta GLP_{it} \times MC_{it} + \varepsilon _{it}, \end{equation}
where
 $MC_{it}$
corresponds to the microfinance indicator (CR-3 or HHI),
 $X_{it}$
is a vector of control variables and the interaction term captures the indirect effect of concentration.
Panel data estimations

Standard errors are in parentheses. Significance Codes, *** : 0.01; ** : 0.05; * : 0.1. p-value are in brackets.
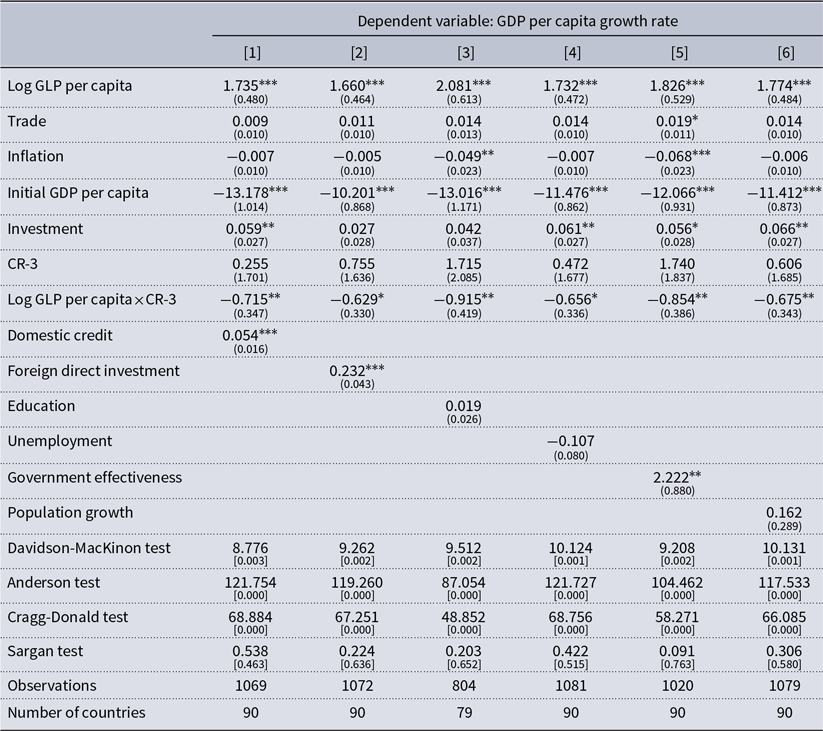
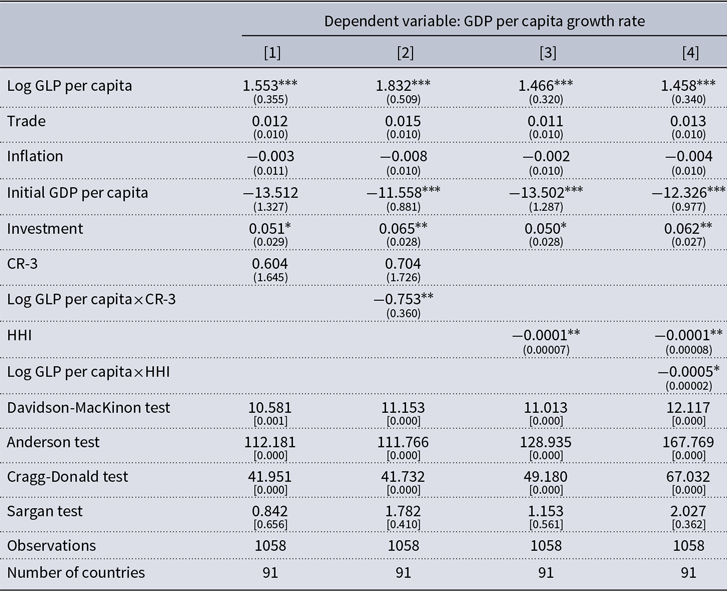
Results of fixed effects estimations with additional explanatory variables (Concentration index: CR-3)

Standard errors are in parentheses. Significance Codes, *** : 0.01; ** : 0.05; * : 0.1. p-value are in brackets.
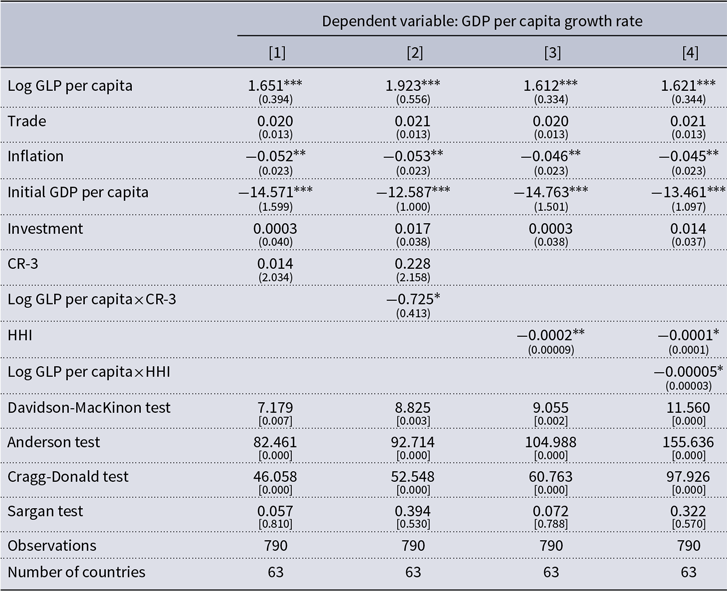
Results of fixed effects estimations with additional explanatory variables (Concentration index: HHI)

Standard errors are in parentheses. Significance Codes, *** : 0.01; ** : 0.05; * : 0.1. p-value are in brackets.
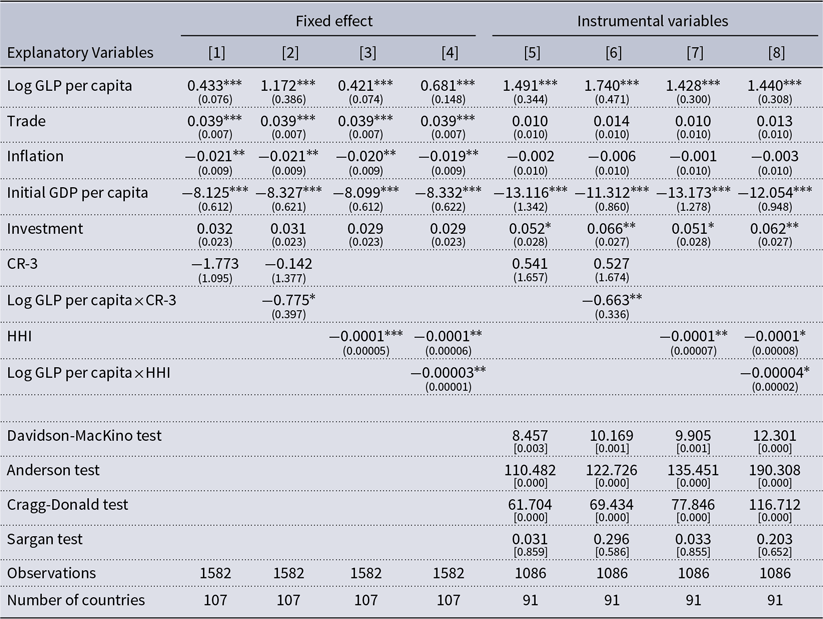
The preliminary estimations are reported in Table 7 (columns 1 to 4). Before correcting for endogeneity, this table provides evidence that microfinance competition is beneficial for growth. Since the signs associated with the concentration ratios are negative, the higher the concentration of the microfinance sector, the lower economic growth.
In columns 5 to 8, we control for endogeneity. The instruments are the same as those used in the previous section, i.e., operating expense and the number of depositors in MFIs for the GLP and the one-year lags for the other determinants of economic growth. The results of the first-stage regression show that the selected instruments are statistically valid. First, the coefficients of our instruments are statistically significantly different from 0. Second, the Anderson and Cragg-Donald tests lead to reject the null hypothesis of underidentification and weak identification. Moreover, regarding overidentification, we do not reject the null hypothesis of the Sargan test. This implies that all excluded instrumental variables are exogenous. Finally, the p-value of the Davidson-MacKinnon test indicates that we should reject the null hypothesis of exogeneity between microfinance and growth, thereby justifying the need for a two-stages least squares approach.
The results of the second stage estimation displayed in Table 7 (columns 5 to 8) show no direct effect of the concentration degree of the microfinance sector for CR-3 but a significant and negative effect for HHI. Therefore, the conclusions regarding the direct effect of concentration on growth are mixed. However, the impact of the GLP per capita on growth depends on the market structure of the microfinance industry. Indeed, we can see that the interaction between the GLP per capita and the concentration index is always negative and significant, regardless of the index used (CR-3 or HHI). This means that the positive impact of microfinance on growth is mitigated as the sector becomes less competitive. As a result, a growth-maximizing government should promote competitive microfinance markets in order to enhance economic growth.
4.2 Robustness Checks
In this subsection, we carry out four types of robustness checks. First, we examine the sensitivity of our results to additional explanatory variables. Second, we analyze the microfinance sector competition-growth nexus using alternative instruments. Third, since our results may hide some disparities between countries, we split our sample and focus on the low- and middle-income economies. Fourth, we run the regressions using five-year growth periods to control for potential fluctuations.
Results of fixed effects estimations with an additional instrument

Additional instrument = voice and accountability Standard errors are in parentheses. Significance Codes, *** : 0.01; ** : 0.05; * : 0.1. p-value are in brackets.
The first set of robustness extends the results of Table 7 using other determinants of growth. The additional variables are domestic credit, foreign direct investment, education, government effectiveness, unemployment, and population growth. The results are reported in Table 8 when we use the concentration ratio CR-3 and Table 9 when we use the HHI index. Note that we only report the results after correcting for endogeneity. Overall, the results are similar to those reported in Table 7. Nevertheless, we can observe that when we add other control variables, we can sometimes obtain a significant and negative direct effect of microfinance concentration. Therefore, under some conditions, a concentrated microfinance market can directly and indirectly lead to a reduction of growth. Moreover, Tables 8 and 9 highlight that all additional explanatory variables are on the whole, statistically significant and their signs are consistent with theory.
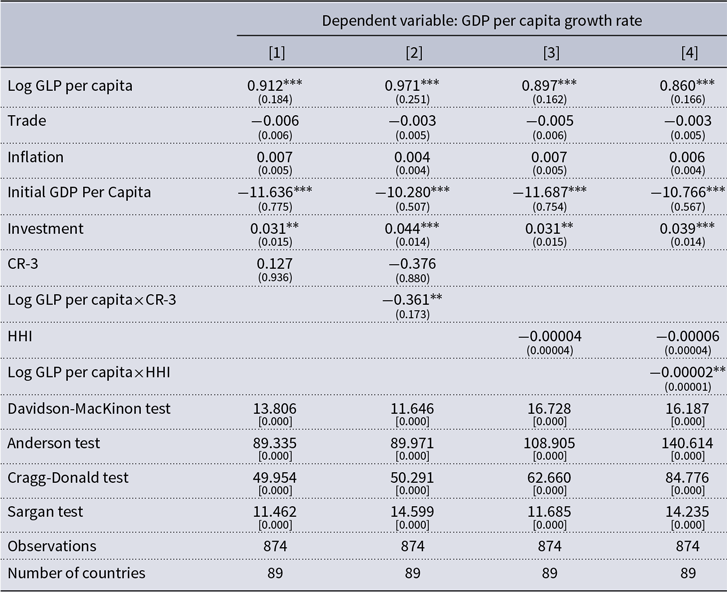
Results of fixed effects estimations - low and middle income countries

Results of fixed effects estimations (with five-year forward moving average of growth)

Second, we consider another instrumental variable. In addition to the use of the number of depositors and operating expense in MFIs, we add an institutional variable, namely voice and accountability, as a third instrumental variable. Table 10 exhibits similar results as those presented before and the use of three instrumental variables instead of two does not have any impact on the validity of our instruments, as shown by the endogeneity, Davidson-Mackinon, Cragg-Donald, and Sargan tests.
In Table 11, we remove high-income countries from our sampleFootnote 10 to make sure that our results remain robust in low- and middle-income countries which are the most concerned countries by microfinance. This removing does not lead to any qualitative change in the results.
Finally, the literature that analyzes the relationship between financial development and growth in panel sometimes uses five-year (or ten-year) periods. In the other regressions in our study, we decided not to focus on five-year (or ten-year) periods because of the limited time span of our sample. However, for the sake of robustness, we present in Table 12 some results showing that our results remain significant when we use five-year forward-moving average variables.
In sum, all these robustness checks enable us to state with confidence that there is a strong relationship between microfinance and growth and that competition between MFIs reinforces this beneficial effect.
5. Conclusion
This study contributes to the empirical literature that analyzes the macroeconomic effects of microfinance at a global level. Using a sample of 119 countries over the period 1999-2018, we have examined the impact of microfinance on growth and the role of investment in this relation. We also proposed a discussion on the substitutability between the microfinance sector and the conventional financial sector. Finally, we have investigated the growth-maximizing structure of the microfinance sector by looking at the relation between competition/concentration and economic growth.
Our results are fourthfold. First, we have shown that microfinance is strongly correlated with increased growth. This result is robust to the inclusion of additional explanatory variables and additional instrumental variables. Second, we have identified investment and consumption as fundamental variables through which the effect of microfinance on growth is channeled. Third, we have highlighted the substitutability of the microfinance sector with the conventional financial sector. Fourth, our analysis provides policy recommendations for countries in which microfinance constitutes a relatively large part of the financial sector. In order to maximize growth, governments should promote systems where the microfinance sector is highly competitive rather than systems where the microfinance sector is concentrated among only a few institutions.
This study calls for further research on the macroeconomic effects of microfinance. In particular, it would be interesting in the future to refine the analysis of the transmission channels of the effects of microfinance by using more disaggregated national data. In addition, further analysis of the structure of financial systems in which microfinance plays a prominent role should be undertaken. A final aspect that will need to be closely investigated is the risks related to microfinance. As it is well documented, microfinance can generate chaotic dynamics of indebtedness which could lead in the long run, if the phenomenon is not controlled, to effects antagonistic to those we observe today on economic growth and development. Therefore, an analysis of public policies that could sustain the virtuous circle of microfinance and growth must be investigated.
Appendix A: Varibale definitions and sources
Variable definitions and sources

Appendix B: List of Countries
List of countries by income classification

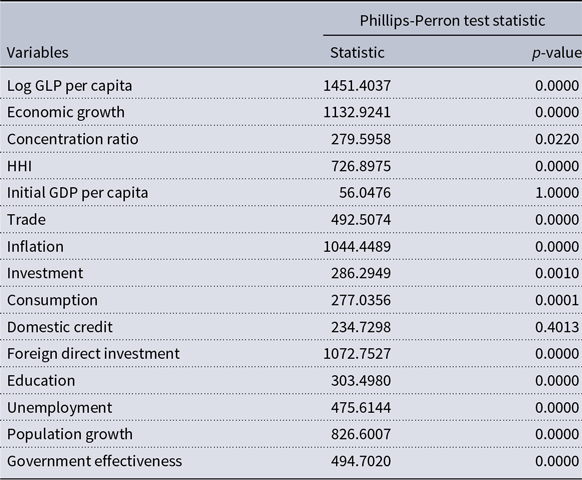
Appendix C: Unit root test
Panel unit root test

Appendix D: Correlation matrix
Correlation matrix

Notes: Growth = Economic growth; Initial = Initial real GDP per capita; TRADE = Trade; INF = Inflation; INVT = Investment; GLP = Log GLP per capita; DEP = Number of depositors; EXP = Operating expense; DC = Domestic Credit; FDI = Foreign direct investment; EDU = Education; UNMP = Unemployment; POP = Population growth, GOVT = Government effectiveness; VOIC = Voice & accountability; CONS = Consumption * Significant at 5%.
Appendix E: Some robustness checks on the transmission channels
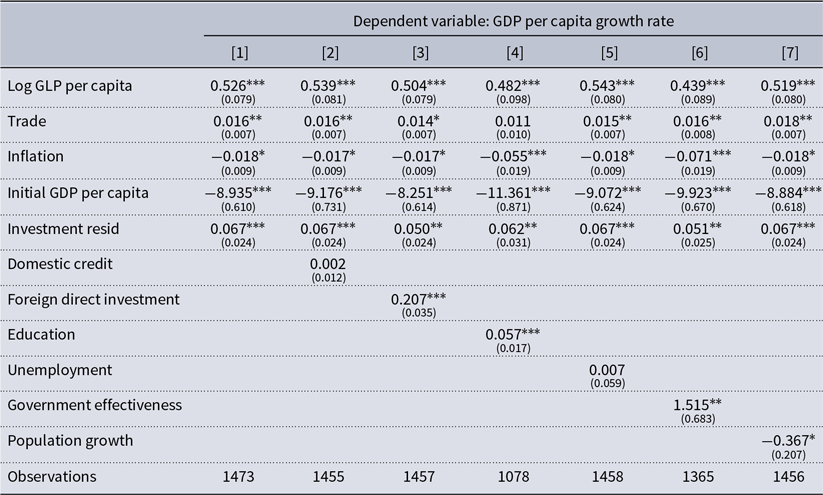
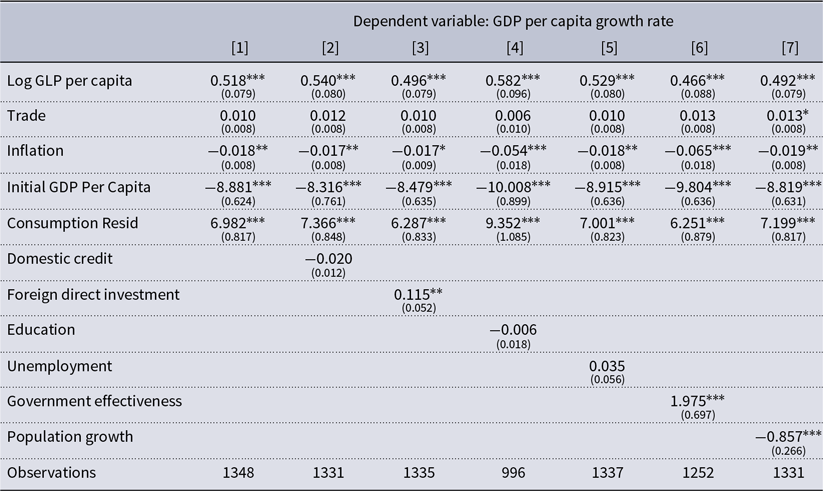
In order to establish the robustness of our results, we have examined whether the impact of microfinance on growth through the investment and consumption channels remains when investment and consumption are decomposed into two parts: a part that affects growth directly through the investment and consumption channels and a part that affects growth via other factors.
To this end, we have followed a two-step estimation procedure. First, we estimate the impact of the development of the microfinance sector on the transmission channels (investment and consumption).
The estimation results are reported in Tables 17 and 18. After recovering the residuals from the estimation of the positive relationship between microfinance and the two transmission channels, we find that microfinance still has a positive effect on growth. We also show that the share of investment (Table 17) and consumption (Table 18) that is not explained by microfinance also has a positive and significant effect on economic growth. In sum, we have been able to robustly demonstrate the existence of two channels in the microfinance-growth nexus, namely private investment and consumption.
Microfinance and growth through the investment channel

Standard errors are in parentheses. Significance Codes, *** : 0.01; ** : 0.05; * : 0.1.
Microfinance and growth through the consumption channel

Standard errors are in parentheses. Significance Codes, *** : 0.01; ** : 0.05; * : 0.1.
Appendix F:
Fixed effects regressions with endogeneity correction (2SLS: insturment=LagGLP)

Standard errors are in parentheses. Significance Codes, *** : 0.01; ** : 0.05; * : 0.1.