


INTRODUCTION
What type of foreign rule generates greater resistance, one where the foreign power retains governing authority or one where it devolves authority to native elites and institutions? This question—crucially important to debates about foreign occupation, insurgency, and colonialism—remains contested. While some studies suggest that the identity of those in control should be of little significance so long as they possess strong coercive capacity (Kalyvas Reference Kalyvas2006; Liberman Reference Liberman1996), others suggest that devolution can play a key role in limiting resistance to foreign rule (Edelstein Reference Edelstein2008, Hechter, Matesan, and Hale Reference Hechter, Matesan and Hale2009). Even if devolving authority does reduce resistance, the causal mechanisms remain unclear, with some scholars arguing that native rule dampens nationalist motivations to resist (Edelstein Reference Edelstein2008, Hechter, Matesan, and Hale Reference Hechter, Matesan and Hale2009), while other work stresses native advantages in counterinsurgency (Lyall Reference Lyall2010, MacDonald Reference MacDonald2013). These disagreements are not limited to academia. Indeed, during the U.S. occupations of Iraq and Afghanistan, officials clashed over the wisdom of turning over greater governing authority to natives and empowering local security forces (Dobbins et al. Reference Dobbins, Jones, Runkle and Mohandas2009; Jones Reference Jones2008).
The lack of consensus can be partially attributed to challenges that researchers face when seeking to identify a causal relationship between resistance and characteristics of foreign rule. As in most political science settings, the assignment of the variable of interest—in this case, the extent of authority devolved to natives—is usually nonrandom. Indeed, the decision to retain or devolve authority is often highly strategic in nature, depending on factors such as the pre-existing political organization of the subordinate territory (Gerring et al. Reference Gerring, Ziblatt, Van Gorp and Arevalo2011). Perhaps more importantly, the decision to grant greater authority to natives can itself be an endogenous response to prior resistance against more direct forms of rule (Licklider Reference Licklider1995; Hartzell, Hoddie, and Rothchild Reference Hartzell, Hoddie and Rothchild2001; Mamdani Reference Mamdani1999). As a result, observed relationships between the extent of native authority and levels of resistance may be spurious.
Researchers would have the strongest basis for inference if the extent of native authority were randomly assigned to units of a particular region under foreign rule. In this article, we examine a historically prominent case that approximates this condition: the division of occupied France into German- and Vichy-governed zones during World War II. Specifically, we examine the November 1942–September 1944 period, when German forces occupied the whole country but the extent of native governance differed between zones. By gathering data on resistance events within localities assigned on a quasi-random basis to the Vichy or German zones, we identify the causal relationship between the degree of native authority and levels of violent resistance.
After reviewing the extant literature and situating the case, we implement a regression discontinuity design to estimate the causal effect. Our results suggest that devolving greater authority to natives significantly reduced resistance within the Vichy zone. Evaluating the findings, we outline a new theoretical approach based on the political cooptation of domestic groups and test it against two mechanisms prominent in the extant literature: dampened nationalism and effective native counterinsurgency. Although the evidence suggests that native counterinsurgency may have played a limited role in reducing violence under Vichy, we find little support for the dampened nationalism mechanism and strong support for a process of political cooptation. The higher degree of devolution in the Vichy zone significantly reduced resistance in politically coopted right-wing localities, but had a limited effect in left-wing localities. In contrast, in the German-zone where authority was less devolved, political affiliation was not a significant predictor of resistance activity. While the literature has predominantly focused on nationalism or structural factors to explain resistance, these findings suggest that the relative empowerment or exclusion of domestic political groups is critical for explaining variation in resistance to occupation.
FOREIGN RULE AND RESISTANCE
How does the degree of devolution affect resistance to foreign rule? One prominent perspective suggests that the question is misplaced: the identity of the power-holders should be irrelevant as long as the rulers have substantial coercive capacity. According to Liberman (Reference Liberman1996, 4–5), for example, “superior coercive capabilities” allow occupiers to deter resistance even in the face of nationalism. Similarly, when examining the civil war that began during the occupation of Greece by Nazi Germany, Kalyvas (Reference Kalyvas2006) finds that collaboration and violence was primarily a function of the extent of territorial control exercised by the warring party, regardless of whether the actor was German or Greek and irrespective of the prewar allegiances of the territory.
In contrast, another group of scholars argue that the extent of native authority is critical for explaining levels of resistance. Specifically, this literature suggests that an increase in native authority should limit resistance by (1) producing more effective counterinsurgents or by (2) dampening nationalist reactions to foreign rule.
First, an increasing number of studies suggest that resistance should be more difficult where natives hold greater power due to comparative advantages in counterinsurgency. This contention—that coethnics are more effective counterinsurgents than foreigners—is well supported in the extant literature. Examining Chechnya, Lyall (Reference Lyall2010) finds that Chechen counterinsurgent sweeps were more effective at reducing insurgent violence when compared to sweeps carried out by Russians. This is consistent with MacDonald (Reference MacDonald2013)’s emphasis on the importance of native collaborators in colonial counterinsurgency efforts, as well as recent evidence that suggests that civilian defense units increase the probability of counterinsurgent success (Peic Reference Peic2014). Coethnics may be particularly effective as counterinsurgents because informational advantages allow them to be more selective (Lyall Reference Lyall2010), avoiding the negative repercussions created by indiscriminate violence (e.g., Kalyvas Reference Kalyvas2006; Kalyvas and Kocher Reference Kalyvas and Kocher2007).Footnote 1
Whereas the counterinsurgency argument focuses on native advantages in combatting ongoing resistance, a second school of thought focuses on initial motivations to resist. Building on the notion that nationalism is the primary motivation for resistance to foreign occupation (Liberman Reference Liberman1996), these scholars have suggested that granting greater native authority to elites under foreign occupation serves to dampen nationalist motivations that would otherwise spur resistance. For example, although Edelstein (Reference Edelstein2008, 11–14) notes that “the greatest impediment to successful military occupation is the nationalism of the occupied population,” he argues that occupiers may be able to co-opt “political elites within the occupied society who can control the nationalist instincts of the population.” Likewise, Hechter, Matesan, and Hale (Reference Hechter, Matesan and Hale2009, 44) argue that utilizing native elites may reduce resistance under foreign rule because these elites “are already endowed with at least a modicum of legitimacy.”
AN ALTERNATIVE MECHANISM: POLITICAL COOPTATION
In this article, we propose an alternative causal process to explain how the devolution of authority affects resistance activity. This mechanism, which we term political cooptation, rests on three premises: (1) domestic political groups seek to maximize their immediate governing power under foreign occupation, irrespective of ideology or their pre-occupation position in the political hierarchy, (2) when the occupier is willing to devolve authority, collaboration is a relatively cheap pathway to political power, and (3) resistance is a highly costly strategy.Footnote 2 Thus, where authority is devolved, collaboration should be the optimal strategy for political groups.Footnote 3 Meanwhile, because of its high cost (occurring in an environment of asymmetric capabilities), violent resistance is only likely to develop when groups must fight for political survival; in other words, when groups are repressed or excluded from political power under the occupation.Footnote 4 In this framework, resistance therefore emerges not from threats to the nation but from active threats to the standing of particular domestic groups.Footnote 5
Our approach builds on scholarship that argues that occupation and foreign intervention can fuel grievances by displacing ruling groups, increasing subsequent motivations to resist (Downes Reference Downes2009; Petersen Reference Petersen2001).Footnote 6 The political cooptation approach is also consistent with an emerging literature that questions the role of nationalism in explaining resistance and instead highlights domestic political factors. For instance, Collard-Wexler (Reference Collard-Wexler2013) finds that measures of nationalism are not significant predictors of cross-national variation in resistance to occupation. And based on an analysis of the French case, Kocher, Lawrence, and Monteiro (2013) argue that nationalism can motivate both resistance and collaboration and therefore can adequately explain neither. Instead, they argue that domestic political competition gives previously marginalized domestic groups strong incentives to collaborate in order to repress their domestic rivals, particularly when the international balance of power suggests the occupier will prevail.
The political cooptation mechanism differs from these existing arguments in several respects. First, in contrast to Collard-Wexler and Kocher et al., the mechanism holds that domestic political cleavages are only activated when the occupier devolves power in an asymmetric fashion, which provides group-level incentives for domestic factions to either collaborate or resist. Where the occupier does not devolve authority, groups will not be able to meaningfully increase their governing power and should refrain from large-scale collaboration.Footnote 7 Second, our theoretical framework holds that domestic groups seek political power in the present and respond to immediate threats to political survival; mass behavior under occupation is thus driven by short-term incentives rather than long-term strategic calculations concerning the international balance of power. Last, and relatedly, we argue that in the context of foreign occupation, domestic groups seek political power and not revenge. Accordingly, a group’s position in the pre-occupation status hierarchy is immaterial: groups that are offered governing authority are likely to collaborate and those that are excluded or threatened are likely to resist, regardless of whether a group was previously ruling or marginalized. This contrasts both with Kocher et al’s focus on marginalized groups and Petersen’s and Downes’ emphasis on displaced ruling groups.
If the political cooptation mechanism is active, it should generate two observable outcomes. First, the aggregate level of resistance should be lower in territories where authority is meaningfully devolved, because some groups that would otherwise resist will be effectively coopted by the asymmetric devolution of political power. Second, greater devolution should be associated with subnational variation in resistance according to domestic political cleavages: areas in which empowered groups are strong should display little resistance activity, while areas dominated by excluded groups should be associated with significant levels of resistance. Conversely, in territories where authority is not significantly devolved, aggregate resistance should be higher since more groups are excluded and threatened. Moreover, in these territories, subnational variation in resistance should not be strongly associated with domestic political allegiances. This variation, which is unique to our theory, provides a testable set of predictions for the political cooptation mechanism.
FOREIGN RULE IN OCCUPIED FRANCE
The occupation of France during World War II provides a prominent empirical case with which to evaluate the effect of native authority on resistance to foreign rule. The French resistance movement was one of the largest in occupied Europe; according to Eisenhower, it was worth 10 to 15 military divisions by the time Allied forces landed in Normandy (Jackson Reference Jackson2003). The conflict easily meets the 1,000 battle-death threshold to be classified as an insurgency: the French Department of Defense lists approximately 26,500 confirmed resistance deaths,Footnote 8 while other conservative estimates have cited 8,000 direct battle fatalities and 4,000 to 25,000 executions (Besse and Pouty Reference Besse and Pouty2006; Lyall and Wilson Reference Lyall2009; Simonnet Reference Simonnet2004). The French case is also particularly significant with respect to our understanding of collaboration under foreign rule. Indeed, the use of the term collaboration to denote cooperation with a foreign occupier originated with this case, and a major historiographical debate exists over the extent to which France was a “nation of collaborators” or a “nation of resisters” (see Paxton Reference Paxton1972 ; Rousso Reference Rousso1991; Sweets Reference Sweets1986; Wright Reference Wright1962).
The most significant aspect of the occupation of France for our research strategy is the fact that native- and foreign-governed zones coexisted within French territory. After Germany defeated France on 22 June 1940, an armistice divided the country into an occupied zone in the north and west ruled by a German military administration and an unoccupied zone in the south ruled by the Vichy government under the right-wing Marshal Philippe Petain, to whom the French assembly voted full powers in July 1940 (Paxton Reference Paxton1972). German military forces quickly imposed a boundary between the two zones by designating and policing a demarcation line, which severely restricted communications and travel between the two zones (Gildea Reference Gildea2002, 142–3). While the broad contours of the line were strategic in nature—i.e., capturing the Atlantic coast for the German zone—it followed an arbitrary course at the local level, cutting across preexisting administrative borders and splitting departments (provinces), cantons (counties), and communes (municipalities) (see Fig. 1).Footnote 9
Map of the Demarcation Line across Intersected French Departments

According to Article III of the armistice, in the occupied zone, “the German Reich exercises all rights of an occupying power. . .All French authorities and officials of the occupied territory, therefore, are to. . .comply with the regulations of the German military commanders.”Footnote 10 Thus, while the Vichy government was nominally responsible for administering the whole of France (Kedward Reference Kedward1978, 17–18), the German authorities ensured that Vichy’s powers were largely restricted to the unoccupied zone. According to Gildea, the “administration in the occupied zone was very much isolated from Vichy and left to fend for itself” (2002, 36). Paxton similarly notes how French sovereignty was “never effectively exercised by Vichy” in the occupied zone (1972, 226), and Gordon concurs that the “Germans rapidly excluded Vichy from any effective control there” (Gordon Reference Gordon1980, 64).
Because of this division, life in the two zones was quite different. Apart from the presence of German soldiers, in the occupied zone the Germans harnessed French industry for the German war effort, instituted a curfew, and banned many civic associations and public gatherings (Gildea Reference Gildea2002, 35–36, 120–1, 136, 145, 212–214; Paxton Reference Paxton1972, 55–56). The Germans also instituted a collective punishment policy, executing and deporting hundreds of hostages and prisoners in retaliation for attacks on German personnel (Fontaine Reference Fontaine2007, 10–14). In the Vichy zone, meanwhile, officials were not subject to German military commands. The native government under Petain—largely a coalition of right-wing and conservative groups—was thus autonomous, allowing it to implement its right-wing program of “National Revolution” (Kedward Reference Kedward1978, 83–4; Paxton Reference Paxton1972, 48–49, 143). If Vichy’s political leanings were in any doubt, they were made clear by the end of 1940, when the government disbanded all municipal councils with left-wing majorities and abolished elections in large towns (Kedward Reference Kedward1978, 19–20). This latter policy “gave Vichy the opportunity to go through local government with a fine-toothed comb and purge its political enemies” (Gildea Reference Gildea2002, 167). Of the 117 legislators ultimately removed from local office, 84% belonged to left-wing parties (Wieviorka Reference Wieviorka2009, 112).
In November 1942, German military forces crossed into the Vichy zone in anticipation of the Allied invasion of Europe. This brought the whole country under German military occupation and resulted in the dissolution of the French army (Paxton Reference Paxton1972, 280–1); however, the formal administrative division between the zones was maintained (Fontaine Reference Fontaine2007, 3; Kedward Reference Kedward1993, 14; Sweets Reference Sweets1986, 177–185;). This is the period we analyze in the article (November 1942–September 1944), when German military forces were present in the entire country but the extent of native authority continued to differ between the two zones. We focus on this time span rather than the July 1940 to November 1942 period for two reasons. First, the vast majority of resistance events in both zones occurred after 1943. Second, the fact that German military forces were present in each zone increases the comparability of communes on either side of the demarcation line, given that German military targets were available in both zones.
Although the German occupation of the Vichy zone effectively ended the Vichy government’s claim to international sovereignty and significantly reduced its autonomy, the Vichy regime nonetheless retained a degree of political and administrative authority in its zone post-1942. At a formal level, the Armistice remained in place: French and German authorities were careful to call the presence of German troops an “operation” and not an “occupation,” and Vichy was assured that “German military authorities should in no manner become involved in the civil administration” in the Vichy zone (Sweets Reference Sweets1986, 177–181). French officials were able to use the text of Armistice to deflect German demands, and although they often were forced to obey German directives, they ensured that Vichy officials were responsible for implementing policy (Sweets Reference Sweets1986, 178–180). For instance, Vichy was able to use its greater authority to limit forced labor deportations to a level significantly lower than in the German zone; the deportations that did eventually occur explicitly excluded Vichy supporters (Kedward Reference Kedward1993, 14, 50–51; Laub Reference Laub2010). Thus, while both zones utilized French civil servants at the local and regional level (see Gildea Reference Gildea2002, 33), in the Vichy zone these officials retained greater authority, while in the German zone French officials remained bound by German demands—a policy Gildea refers to as “Diktat” (Reference Gildea2002, 300).
With respect to particular policy dimensions, greater native authority in the Vichy zone was reflected in the politicization of daily life and the emergence of mass political organizations banned in the German zone (Gildea Reference Gildea2002, 122–124). For example, Vichy established the Legion Francaise des Combattants, a large veterans’ organization that was used to enforce government policies at the local level (Kedward Reference Kedward1978, 85–6). The Legion ultimately expanded eligibility to all men in the Vichy zone and “membership in the Legion became a required qualification for certain jobs, offices, and privileges” (ibid.). Far from apolitical, the Legion was a key mechanism through which Vichy coopted its right-wing constituency: it was headed by politicians from right-wing parties (Wieviorka Reference Wieviorka2009, 134), participated in repression against the left, and ultimately generated the paramilitary organization known as the Milice (Gordon Reference Gordon1980, 175, 334; Kedward Reference Kedward1978, 86–7).
Second, and related, the involvement of French citizens in counterinsurgency differed across the two zones. Although the French police were nominally under Vichy control and operated under similar agreements with the Germans in each zone by 1943 (Paxton Reference Paxton1972, 297), the situation with respect to paramilitary units was different. By 1944, the French police were proving highly unreliable and ineffective at counterinsurgency, leading Vichy to rely more and more on the Milice (Sweets Reference Sweets1986, 217–218). Founded in January 1943, the Milice ultimately grew to be 30,000 strong in the Vichy zone; it was only authorized for expansion into the German zone in January 1944, where it “never achieved much success” (Gordon Reference Gordon1980, 177–185). According to one German official, the Milice “was too weak to be of any use in the north” (Gordon Reference Gordon1980, 305). However, in the Vichy zone, the Milice “were a powerful offensive force” that “mixed infiltration and victimization with direct conflict” (Kedward Reference Kedward1993, 72, 125). One resister in Vichy France recalls how in 1944, “the gendarmes [police] turned a blind eye for the most part. But the Milice were far more dangerous, infiltrating in plain clothes” (ibid., 258).
In sum, French communes in each zone were subject to substantially different levels of native authority, a distinction that persisted (albeit in attenuated form) after German military forces fully occupied the country in November 1942. Because French officials were involved in governance at the local and regional level in both zones, and because Vichy had nominal (but little actual) authority in the German zone, the discrepancy between the two zones does not conform to an ideal-type distinction between limited and full native authority. Nevertheless, there was a definite discontinuity in the degree of native authority between the two zones, which produced significant differences in cumulative wartime experiences. By analyzing the effect of this cumulative treatment via a causal inference framework, we can identify the relationship between a relative increase in native rule and levels of resistance. The fact that this difference is in degree and not kind should bias against finding a significant difference in resistance between zones.
IDENTIFYING THE CAUSAL EFFECT
Although a simple count of resistance activity would reveal whether resistance was more common in the German or Vichy zone, this method is problematic because it overlooks the possibility that factors causally unrelated to German or Vichy rule affected levels of resistance. For instance, given that the Vichy zone contained more rugged terrain, it may have been easier for resistance groups to operate. Thus, while many of the largest actions by the Resistance took place in the Vichy zone—e.g., the Battle of Mont Mouchet or Battle of Vercors—it is difficult to determine whether the scale of these operations can be attributed to the effect of Vichy rule, or simply to the favorable terrain of the French Alps. As a result, an analysis that simply compares aggregate levels of resistance in each zone is likely to be biased. Even an analysis that adjusts for covariates like terrain would be subject to bias unless all relevant confounders were measured and included.
In order to avoid bias generated by these confounders, we exploit a natural experiment. Although the German army had certain priorities when determining the boundaries between the German and Vichy zone—most notably, seizing the Atlantic coast and capturing large provincial capitals—the line was demonstrably arbitrary at the local level. Seemingly blind to existing boundaries, the demarcation line cut across political units such as departments, cantons, and communes as well as geographic features such as mountain ranges and rivers. As a result, the assignment of a commune to either the German or the Vichy zone in areas close to the line may be plausibly viewed as quasi-random. Indeed, as we will demonstrate, communes located close to the demarcation line are statistically indistinguishable from their counterparts across the border. By taking advantage of the fact that similar communes were exposed to differential levels of native authority, we can identify the causal effect of the type of foreign rule on resistance. After using GIS to identify the location of the line, we leverage a regression discontinuity design—examining spatially proximate communes and testing whether resistance activity shifts abruptly at the demarcation line. After conducting the initial analysis, we control for the possibility that the placement of the line was nonrandom in certain locations by using matching with variable bin sizes around the line.Footnote 11 Last, we explore three potential mechanisms linking the type of foreign rule with levels of resistance.
DATA
To our knowledge no existing study has identified the location of the demarcation line at a local level across every French department. To accomplish this task, we consulted a variety of archival and secondary sources and mapped the demarcation line using ArcGIS software.Footnote 12 When we encountered discrepancies between sources, we used a geo-database on historical markers to identify the location of the line.Footnote 13 The resulting dataset allows us to identify whether a commune was located in the Vichy or the German zone, as well as the distance between the center of the commune and the demarcation line.
Since the majority of historical data is accessible only within departmental archives and it would not be feasible to digitize data for every commune within all intersected departments, we selected a subsample using the following criteria. First, we excluded departments that bordered Spain, Italy, or Switzerland in order to avoid the possibility that a foreign border served as a safe haven. Second, we chose departments with a substantial number of communes on each side of the demarcation line. Last, we chose areas in which the demarcation line was relatively smooth to further minimize the possibility of strategic selection. Four departments met these criteria: Charente, Cher, Saône-et-Loire, and Vienne. Using the selected departments, we constructed a commune-level dataset containing 1371 observations after dropping communes directly intersected by the line.Footnote 14
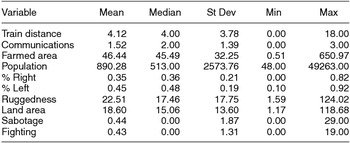
Although data at the commune level for this period are scarce, we were able to obtain information on several covariates relevant to resistance activity. Summary statistics are presented in Table 1. Drawing from a prewar survey, our dataset includes information on Population from the 1936 census, as well as an index variable indicating whether a given commune possessed a a telephone bureau, a telegraph station, or a post office in 1939 (Communications). The dataset also includes the distance to the nearest train station in kilometers (Train Distance). These measures are the best available proxies for local state capacity, which the literature suggests should be negatively associated with insurgency (Fearon and Laitin Reference Fearon and Laitin2003), although it may be positively associated with sabotage activity (by providing more targets). They also serve as proxies for local German presence, since German troops were garrisoned in major towns in both zones (Sweets Reference Sweets1986). From pre-war agricultural surveys, we include the number of actively farmed hectares as a proxy for forest cover and urbanization (Farmed Area). Like weak state capacity, rural areas and regions with rough terrain are generally thought to be conducive to insurgency (e.g., Toft Reference Toft2002–2003; Fearon and Laitin Reference Fearon and Laitin2003, Kalyvas Reference Kalyvas2006). The dataset also contains geographic data on the Ruggedness of terrain, an important control because of the established link between mountainous terrain and insurgency (Fearon and Laitin Reference Fearon and Laitin2003).Footnote 15 Rugged terrain, while likely to be positively associated with guerrilla attack, may be negatively associated with sabotage, which tends to target more urbanized areas. Last, we include political vote shares from the 1936 national legislative elections (% Right and % Left). While much of the literature on insurgency and civil war focuses on the importance of ethnic cleavages (e.g., Posen Reference Posen1993; Cederman, Wimmer, and Min Reference Cederman, Wimmer and Min2010), in France political ideology constituted the primary cleavage.Footnote 16 The election results are critical in the French case due to the widespread belief that leftists dominated resistance activity (e.g., Kedward Reference Kedward1993; Wright Reference Wright1962), and also to help us to determine whether right-wing areas were comparatively less violent in the Vichy zone, where conservatives were locally empowered.
Summary Statistics

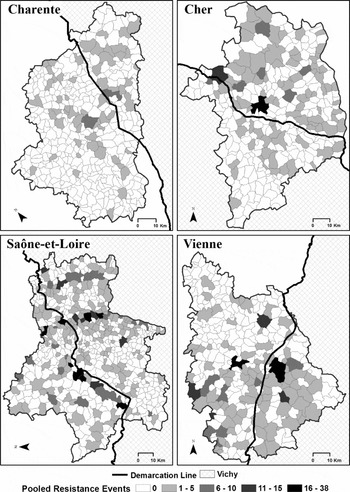
Resistance activity is measured with commune-level event count data from December 1942 to September 1944, drawn from French military archives.Footnote 17 We utilize two dependent variables: Sabotage, which includes all attacks against infrastructure (largely railroad and communications), and Fighting, which aggregates resistance-initiated attacks on German and Vichy personnel.Footnote 18 Across the 1371 communes in our sample, we measure 1214 distinct resistance events. As shown in Figure 2, which displays the spatial location of events across each of the four departments, resistance activity was not isolated to a single geographic area. However, despite being geographically widespread, resistance events were significantly dispersed, with many communes unlikely to experience any resistance events over the course of the war.
Resistance Events across Departments

RESULTS
In order to test the hypothesis that the type of occupation influenced the level of resistance, we leverage a regression discontinuity design. Examining communes in close proximity to the demarcation line, we measure differences in levels of resistance activity between the two zones. We define the estimand as follows:
 \begin{eqnarray*}
\tau &=& \lim_{z\downarrow c} E[Y_{i,D=1} | X_{i}<=z] \\
&&-\, \lim_{z\uparrow c} E[Y_{i,D=0} | X_{i}>=z],
\end{eqnarray*}
where τ identifies the effect of the type of rule on levels of resistance,Yi is the number of observed resistance events observed in each commune, D is the treatment indicator and is 1 when the commune is located in the German zone, Xi is the distance from the geographic center of each commune to the demarcation line, c is the location of the line, and z is a bandwidth.Footnote 19
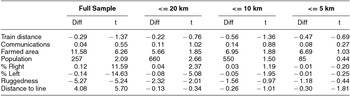
In order to estimate τ without bias, the location of the line must be exogenous to characteristics of the communes. To some degree this assumption is testable; if it holds and the location is truly arbitrary, differences between units should decrease as one approaches the demarcation line. Accordingly, Table 2 displays the average difference in covariates between communes in Vichy and German zones at specified distances from the line.Footnote 20 Although the full sample is not balanced, as we move closer to the line, covariate balance markedly improves. Communes close to the demarcation line are statistically and substantively indistinguishable from their counterparts across the line.Footnote 21 This result provides strong evidence that the assignment of communes to either zone may be plausibly viewed as quasi-random, with balance on observed covariates providing us with confidence that unobserved covariates are likely to be balanced as well.
Covariate Balance at Various Bandwidths

Note: Difference-in-means calculated as (German zone–Vichy zone).
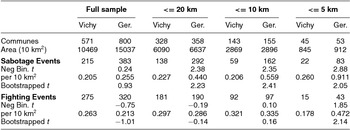
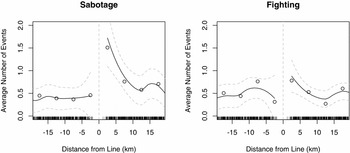
Although communes located close to the demarcation line are statistically indistinguishable from their neighbors across the border, they experienced markedly different levels of resistance activity. As can be seen in Table 3, resistance activity was elevated across the entire German Zone, with communes close to the border experiencing a roughly fourfold increase in levels of Sabotage activity over their Vichy counterparts. These differences are statistically significant at the 95% level when using nonparametric bootstrapped difference-in-mean estimates or a simple negative binomial model.Footnote 22 As can be seen in Figure 3, which models the distribution of the resistance activity using a local polynomial, Fighting activity is distributed more evenly across both zones. However, the average number of events remains elevated in the German zone and the difference-in-means is statistically significant at the 95% level in bandwidths close to the line, where the result is most clearly identified.
Resistance Activity by Bandwidth

Notes: The subsamples contain all nonintersected communes with a centroid at the specified distance or less from the demarcation line. Within each bandwidth, the neg bin t statistic is from the simple negative binomial regression y = D + α, where D is the treatment indicator, and α is a logarithmic offset for land area. The nonparametrically bootstrapped (n = 1000) t statistic is for the following: (∑Y i, D = 1/∑L i, D = 1) − (∑Y i, D = 0/∑L i, D = 0) for all i in bandwidth z, where L is the land area of the commune in 10 km2.
LOESS: Events per Commune

To obtain a point estimate for the observed increase in resistance activity, we adopt a nonparametric approach and utilize local linear regression (Imbens and Lemieux Reference Imbens and Lemieux2009; Lee and Lemieux Reference Lee and Lemieux2009).Footnote 23 Given the distribution of the data, we use a rectangular kernel:Footnote 24
 \begin{equation*}
Y = \alpha + \tau D + \beta _{1}L + \beta _{2} (X - c ) + \beta _{3} D( X-c )+ \epsilon ,
\end{equation*}
where c − z < =X < =c + z, and L is a vector containing the land area of each commune.Footnote 25 Since regression discontinuity designs are highly sensitive to the choice of bandwidth, we run the model with several bandwidths ranging from a distance of 10 km to 25 km from the demarcation line.Footnote 26
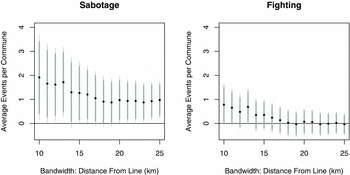
Figure 4 displays the results after bootstrapping (n = 1000).Footnote 27 At every bandwidth, the expected Sabotage rate is higher in the German zone, with the majority of estimates statistically significant at the 95% level. Although the rate of Fighting is higher in the German zone when examining communes within very narrow bandwidths (see Table 3), the point estimate is not statistically significant at the 95% level. However, it remains significant at the 90% level for several bandwidths.Footnote 28
Local Linear Regression: Difference in Resistance Activity

Taken together, the results suggest that resistance activity was lower in the Vichy zone when analyzing comparable communes. Based on the estimates obtained for the smallest bandwidth, a commune reassigned from the Vichy to the German zone would experience an increased resistance rate of, on average, 1.9 Sabotage and 0.8 Fighting events.Footnote 29 Given the small size of communes in France (an average of 18.6 km2 within our sample) and the fact that measured resistance events entail either the consequential destruction of infrastructure or combat deaths, this result is substantively significant, especially at higher levels of aggregation.
COUNTERARGUMENTS AND ROBUSTNESS CHECKS
Before discussing the possible mechanisms driving the findings, we address three potential concerns: (1) that the difference in resistance activity is due to a differential number of targets, (2) that spillover across zones may have contaminated the results, and (3) that our approach is susceptible to a false positive.
With respect to the first claim, it is unlikely that resistance was higher in the German zone because there were more numerous or important targets to attack. First, we control for the availability of targets to a large degree. After November 1942 German troops were concentrated in major towns in both zones, “especially along main lines of communication” (Sweets Reference Sweets1986, 192–3), and along the border between the two zones (Leleu et al. Reference Leleu, Passera, Quellien and Daeffler2010), which we control for with population size and communications infrastructure as well as each commune’s distance from the border. Moreover, the majority of resistance activity in our dataset was not targeted directly at German or Vichy personnel, but rather was mainly sabotage against railway targets, which we control for with train stations and distances to train stations.Footnote 30
On the second count, while there is no denying that individuals may have made limited forays into neighboring zones, the data do not provide support for a strong spillover effect. While resistance activity is elevated close to the demarcation line, the results are robust to the exclusion of all communes within 3 km of the line on either side.Footnote 31 Moreover, although the resistance rate in the German zone does fall after 5 km, the rate rises again after 10 km (see Figure 3). This bimodal distribution is not consistent with the hypothesis that elevated levels of resistance were driven purely by limited incursions by resistance fighters operating from the Vichy zone. Indeed, the level of sabotage events remains uniformly higher on the German side of the line up to 20 km, despite the fact that decreased covariate balance at this distance biases against such a finding.Footnote 32 Finally, if some spillover did occur due to increased motivation to resist in the German zone, this would be consistent with our larger argument. Because effective insurgency requires the aid of the local population (e.g., Kalyvas Reference Kalyvas2006; Petersen Reference Petersen2001), the location of attacks provides us with important information about locations in which there was local support for resistance. Indeed, the historical literature on the French resistance is very clear that this was the case. As Kedward (Reference Kedward1993) notes, “in most areas,” members of the resistance, “were forced to make their descent . . .into friendly local villages . . .the denser the cover provided by the supportive structures, the more protected was the precise locality and movements of the maquisards” (88). The local element extended beyond just providing cover for mobile insurgents: “It only slowly became apparent after the war just how many maquis units were composed . . .of men from the immediate rural vicinity” (Kedward Reference Kedward1993, 147).
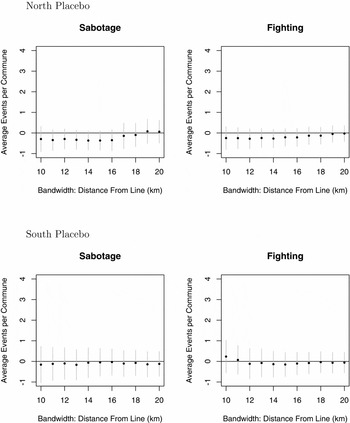
One final possibility worth addressing is whether our findings represent a false positive. To assess the robustness of the result, we include two additional checks. First, we conduct a placebo test to ensure that the regression discontinuity design is unable to uncover effects at a location that differs from the true demarcation line (Imbens and Lemieux Reference Imbens and Lemieux2009). To do so, we subdivide the sample into communes in the German and Vichy zones and introduce a false demarcation line at the median distance within each zone. We then use the same model as in Figure 4, testing for differences across several different bandwidths and bootstrapping all estimates. The results are presented in Figure 5; none of the estimates are statistically significant at the 95% level and the point estimates are quite small.Footnote 33
Robustness Check: Placebo

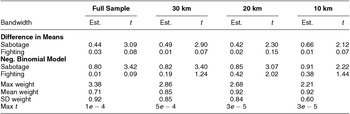
Second, although our sample is balanced on all measurable covariates at distances close to the line and the regression discontinuity approach is therefore identified, we also implement a design to explicitly improve the comparability of the Vichy and the German zones. Within a given bandwidth, we use entropy balancing to construct a sample in which control units are weighted to match treated units using the covariates listed in Table 2 (Hainmueller Reference Hainmueller2012).Footnote 34 Using the rebalanced sample, we analyze the difference in Sabotage and Fighting events across the zones using a simple difference-in-means as well as a negative binomial model with a logarithmic offset for land area. As seen in Table 4 , although the difference in fighting activity between the two zones is no longer significant, the results for Sabotage are in agreement with the previous analysis and suggest that sabotage activity was significantly more likely in the German zone. As a robustness check, we use nearest-neighbor matching and obtain similar results (Appendix Table A2).
Robustness Check: Matching (Entropy Balancing)

Notes: Control units within the specified bandwidth were reweighted using entropy balancing. Treatment = Vichy (signs inverted for consistency). Communes were balanced on all covariates in Table 2, as well as mean elevation. After balancing, results are presented as a simple difference-in-means or as a negative binomial with a logarithmic offset for land area. Observed differences in covariates were small after matching; the largest t statistic of the difference-in-means across covariates was recorded under “Max t.”
WHAT EXPLAINS LOWER LEVELS OF RESISTANCE IN THE VICHY ZONE?
The results from the regression discontinuity design establish a robust causal relationship between the nature of foreign rule and the level of resistance. However, they do not reveal the specific process driving this outcome. Vichy and German governance differed along several important dimensions, each of which may have influenced the level of resistance observed within each zone. Although it is difficult to precisely estimate the effect of a particular dimension in the absence of random assignment of these policies, we can nevertheless determine whether patterns of resistance activity are consistent with observable theoretical implications. Accordingly, in this section we evaluate whether the lower level of resistance activity under Vichy is most consistent with (a) an increase in the effectiveness of native counterinsurgency, (b) dampened nationalism, or (c) a process of political cooptation.
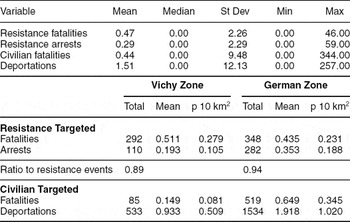
First, it is possible that Vichy counterinsurgent activities were more effective than their German counterparts due to the heavier involvement of the Milice. The literature suggests that native counterinsurgency forces possess informational advantages over foreign forces, and this should produce more accurate targeting of insurgents, less indiscriminate violence, and thereby more effective counterinsurgency (see Lyall Reference Lyall2010. On the deleterious effects of indiscriminate violence, see Kalyvas and Kocher Reference Kalyvas and Kocher2007; Wood Reference Wood2003). In order to evaluate this hypothesis, we draw from records maintained by the French Department of Defense and Institut d’Histoire du Temps Present (IHTP) to assess whether the characteristics of counterinsurgency in the two zones differed in the hypothesized manner. The resulting dataset measures four types of events at the commune level: Resistance Fatalities,Footnote 35 Resistance Arrests, Civilian Fatalities, and Forced Labor Deportations. When time stamps are available, we restrict measured events from December 1942 to September 1944 to provide comparability with the regression discontinuity analysis.Footnote 36
Table 5 displays the number of observed events, scaled by the number of communes and land area within each zone. Although the relationship between resistance and counterinsurgency is inherently endogenous and it is difficult to draw robust conclusions,Footnote 37 we nevertheless present the ratio of resistance combat fatalities and arrests to the number of total resistance events in order to approximate the casualty rate associated with resistance operations in each zone.
Descriptive Data on Counterinsurgency Events

The results suggest that the intensity of counterinsurgent activity did not differ markedly between the two zones. The rate of resistance fatalities and arrests in each zone is statistically indistinguishable, with a mean difference of 0.08 per commune and a t statistic of 0.39. However, there does appear to be substantial evidence that the form of counterinsurgent activity differed between the two zones. Although Vichy actions were conducted primarily against resistance targets, with resistance arrests and fatalities outnumbering civilian executions, German forces were much more indiscriminate. This pattern coincides with the historical evidence: throughout the occupation the Germans utilized a policy of mass executions and deportations against civilians as a deterrent to resistance activity (Fontaine Reference Fontaine2007).
The higher degree of brutality and the indiscriminate nature of targeting observed in the German zone likely contributed to subsequent levels of resistance. However, this factor does not appear to fully account for the differing levels of resistance across the two zones. Including the number of civilians killed or deported from a particular commune as an additional covariate in the main model attenuates but does not eliminate the observed discrepancy: revised estimates for the 10-km bandwidth suggest an increase of 1.4 sabotage and 0.6 fighting events per commune within the German zone.Footnote 38 Although these estimates should be viewed as noncausal due to the highly endogenous relationship between counterinsurgency and resistance, the results suggest that brutality and resistance activity are not tightly correlated and additional factors are needed to explain the observed discrepancy in resistance activity across zones.
Accordingly, we next assess the support for two alternative mechanisms that may have reduced motivations to resist under Vichy: dampened nationalism or political cooptation. Empirically, if the extension of greater native authority dampened nationalist motivations to resist in the Vichy zone, we would expect to see little variation in the level of resistance across communes in the Vichy zone after controlling for relevant covariates, regardless of a commune’s prior political allegiances. In contrast, if the extension of native authority reduced motivation to resist only among coopted domestic political groups, we should expect levels of resistance to vary according to prewar political cleavages, with lower resistance in the Vichy zone restricted to areas of right-wing support. In left-wing areas, meanwhile, we should expect similar levels of resistance in both zones since left-wing groups were excluded and repressed in each region.
To evaluate these hypotheses, we first fit a negative binomial model with all available covariates on the full sample and introduce an interaction term between the percent of votes cast for right wing parties in the 1936 election (% Right Wing) and the treatment variable.Footnote 39 Holding all variables at their means, we then plot the predicted level of pooled resistance activity (Sabotage and Fighting) and Sabotage activity for the Vichy and German zones as a function of the 1936 election results (Figure 6). The results suggest, contra the dampened nationalism mechanism, that domestic cleavages mattered: communes with a higher proportion of votes for right-wing parties in 1936 experienced significantly less resistance activity.Footnote 40 Furthermore, and in alignment with the political cooptation mechanism, right-wing communes within the Vichy zone have a statistically and substantively significant lower expectation of resistance events when compared to similar right-wing communes in the German zone. Indeed, for communes in the Vichy zone with a high percentage of right-wing votes in 1936, the expected number of sabotage events during the war approaches zero.Footnote 41
Predicted Resistance Events per 10 km2

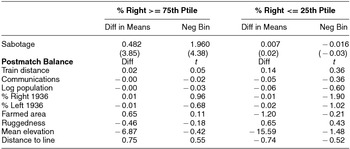
To control for the possibility that model dependence stemming from the interaction term may have biased the results, we restrict the sample to communes in which the percentage of votes for right-wing parties was above the 75th percentile, and less than the 25th percentile, respectively, and use entropy balancing to balance communes across zones (Table 6). For the subset of communes with comparatively high support for right-wing parties, the estimated difference in the rate of resistance activity between the two zones (0.48 additional events per commune, plus or minus 0.23) is statistically significant and substantively large.Footnote 42 For the subset with comparatively low right-wing support, the estimate switches signs and is statistically insignificant. Given that the estimate is calculated on a small subset of the data, care should be taken in extrapolating these results. Nevertheless, the findings lend strong support to the political cooptation mechanism, with devolution decreasing the tendency of right-wing groups to resist in the zone in which they were locally empowered.
Robustness Check: Subset Matching

Notes: Subsamples include all nonintersected communes with the specified level of % Right vote share in 1936. Within each subsample, control units were reweighted on the basis of all covariates in the lower half of the table using entropy balancing. Using the balanced sample, the difference in sabotage activity between the two zones was measured with a simple difference-in-means and negative binomial model with a logarithmic offset for land area. t statistics in parentheses.
This empirical pattern is consistent with the historiography of the French Resistance. Within the Vichy zone, scholars have noted that the Resistance was driven by left-wing insurgents, with comparatively little resistance in right-wing areas (Kedward Reference Kedward1993, 153–4). Indeed, the four main resistance organizations that developed in the Vichy zone—Combat, Liberation, Franc-Tireur, and Front National—were all leftist or left-leaning (Kedward Reference Kedward1978, 235). Moreover, resistance groups within the Vichy zone reported substantial difficulties in finding support in right-wing areas, where relations “were restrained for political reasons” (Farmer Reference Farmer1985, 100–101). According to a member of the Resistance in Haute-Vienne, the reason was that “the maquis were not liked by a certain population. . . The right-wing population was for Petain and Vichy” (quoted in ibid.), who labeled the resistance groups as “terrorists.”Footnote 43
The continued persistence of political cleavages suggests that a process of political cooptation played a strong role in reducing motivations to resist among those groups empowered by the Vichy Regime. But there is also strong evidence that left-wing groups did not resist Vichy reflexively due to past grievances against the right; rather, they only did so when they were actively excluded by the regime. In July 1940, a large majority of left-wing legislators voted full powers to Petain (Wieviorka Reference Wieviorka2009, 97).Footnote 44 Even some Communists sought a modus vivendi with the Vichy government and initially “signed declarations of good intent” (Kedward Reference Kedward1978, 53–54). However, “any lingering illusion the Communists might have held were dispelled in October 1940 when the Vichy police carried out a series of raids against Communists suspected of restarting party activity” (ibid., 53–4). Shortly thereafter, Communists commenced efforts to build underground resistance networks and made their opposition to Vichy clear through clandestine publications (ibid., 60). After their leaders were arrested and purged in 1940–41, many Socialists began resisting as well, founding the major resistance movement Liberation-Sud; as Kedward notes, “Vichy set out to destroy the record and reputation of the Popular Front. . .in so doing it provoked the opposition of those Socialists who felt threatened or victimized and thus created political conflict” (Reference Kedward1978, 99–104).
In contrast, the occupiers in the German zone granted little independent power to major French political groups. Indeed, the primary German requirement for local authorities was not right-wing allegiance, but simply that they maintain order (Gildea Reference Gildea2002, 37). While it is true that there were collaborators in the German zone, particularly in Paris with the well-known fascist “Ultras” like Jacques Doriot and Marcel Deat, these elite collaborators represented small, extremist groups rather than the more mainstream, traditional right of Vichy, and they were given no governing authority. As Gordon describes, “Hitler and his chief aides recognized that the [fascist] collaborationists could not match the popularity and esteem of Marshal Petain. . . Collaborationists were useful as a threat to induce official Vichy to toe the line, but he had no intention of helping them to power” (Reference Gordon1980, 24–25). Moreover, while repression in the Vichy zone was disproportionately targeted at left-wing individuals and groups (Sweets Reference Sweets1986, 205), the historical evidence suggests that German repression was levied more broadly (Fontaine Reference Fontaine2007, 7). For example, in reprisals for attacks on German soldiers, the Nazi authorities initially adopted a policy of taking hostages and executing local notables, not just those from the left (Fontaine Reference Fontaine2007, 11; Gildea Reference Gildea2002, 235). Indeed, of the 51 French legislators that the Germans deported, two-thirds were from left-wing and one-third were from right-wing parties; these numbers closely match the share of legislators held by each bloc before the war (Wieviorka Reference Wieviorka2009, 129–130, 277).
As predicted by the political cooptation mechanism, resistance in the German zone was thus a politically diverse phenomenon. As Wright (Reference Wright1962, 339–340) notes:
The political outlook of the resistance. . .was sharply slanted to the left. But this generalization holds better for the south than for the north, since right-wing Frenchmen reacted differently in the two zones. In the unoccupied south, where almost all rightists supported Petain in the early years, the left had the field pretty much to itself in organizing an underground. In the north, on the other hand, the presence of the Germans partially insulated rightist Frenchmen against Petain’s appeal and many conservatives joined the resistance as a kind of patriotic reflex.
Whereas resistance movements founded in the Vichy zone were all left-leaning, in the German zone important resistance organizations were of largely right-wing extraction (in particular, Ceux de la Liberation, and L’Organization Civile et Militaire). This pattern is consistent with the political cooptation logic: since German authorities excluded all major political groups and repressed broadly, each group was threatened by the occupation and was motivated to engage in resistance activity.
In sum, the evidence suggests that the devolution of authority in the Vichy zone reduced incentives to engage in resistance activity. Compared to the German zone, Vichy governance was characterized by a more selective counterinsurgency effort and the widespread cooptation of right-wing groups. Although both of these mechanisms likely played a role, the available evidence indicates that the political cooptation mechanism was predominant. Controlling for observed differences in the form of counterinsurgency attenuates but does not eliminate the discrepancy between zones. In contrast, no significant difference in resistance activity is visible after controlling for the divergent behavior of right-wing communes in each zone (see Table 6). While these results should be viewed as correlational rather than causal, the findings are consistent with the historical record. By choosing to recognize and maintain the authority of a regime closely tied to preexisting right-wing politics in the French Republic, the German occupiers appear to have activated political cleavages and reduced motives to resist across a significant portion of the Vichy zone.
CONCLUSION
This analysis provides perhaps the first causally identified evidence that extending political authority to natives can reduce levels of resistance. In contrast to the correlational studies that dominate the study of resistance to foreign rule and civil conflict more broadly—which either assume the exogeneity of key causal variables or attempt to adjust for confounding factors via multivariate regression—we utilize a natural experiment where our key causal variable (devolution of authority) is plausibly exogenous at the local level, thereby making regression-based adjustments superfluous. Indeed, as we empirically demonstrate, matching, regression-based approaches, and difference-in-mean estimates provide essentially the same result close to the demarcation line. This should provide increased confidence in the empirical results relative to other approaches.Footnote 45
The results of this study have important implications for the study of foreign rule, occupation, and insurgency. First, the study provides additional, albeit limited, support for the argument that counterinsurgency efforts under natives differ in terms of form and efficiency from those conducted by foreign powers. Second, the finding that domestic political factors play a key role in conditioning responses to foreign rule suggests the importance of moving beyond macro-level variables that affect the occupied territory equally, such as nationalism, and towards an awareness of political factors that may discourage or stimulate resistance at the local level. When coupled with other recent literature (Collard-Wexler Reference Collard-Wexler2013; Kocher, Lawrence, and Monteiro Reference Kocher, Lawrence and Monteiro2013; Miller Reference Miller2013), the evidence suggests an emerging consensus: political divisions within occupied territories matter and play a critical role in determining subsequent levels of resistance.
While our findings contribute to the theoretical development of the literature on nationalism, occupation, and foreign rule, two important caveats are necessary. First, while the causal relationship between greater native authority and reduced levels of resistance appears to be robust, the subsequent exploration of the mechanisms driving this outcome should not be viewed as causally identified.Footnote 46 As a result, additional studies that apply the political cooptation mechanism to other contexts may be needed to fully establish the causal process.
Second, our analysis focuses on micro-level dynamics within occupied France. Although the resulting research design has strong internal validity, it is important to proceed with caution when seeking to generalize the results to other cases. For instance, unlike recent foreign occupations such as Iraq and Afghanistan, France is characterized by a lack of ethnic cleavages and strong state capacity—factors that may conceivably influence the effect of devolution on levels of resistance. However, while these factors may be potential scope conditions for the theoretical approach outlined in this article, we believe the political cooptation mechanism should remain relevant even in contexts characterized by weak state capacity. While it is certainly the case that lower state capacity should be associated with higher levels of resistance, governing through locals should nevertheless produce, ceteris paribus, less resistance than foreign governance. The absence of devolution should generate greater motivations for resistance by (1) providing incentives to domestic groups to engage in resistance to secure their political survival and relevance, and (2) leading foreign occupiers to engage in indiscriminate counterinsurgency in their effort to “substitute” for pre-existing state weakness. Indeed, evidence from Afghanistan or Iraq under U.S. occupation reveals patterns consistent with the political cooptation mechanism in spite of lower state capacity, with resistance highest in the Pashtun and Sunni populations that were marginalized by the occupations and much lower in regions inhabited by groups coopted by the occupiers: Shiites and Kurds in the case of Iraq, Tajiks, Hazaras, and Uzbeks in the case of Afghanistan (Cordesman and Davies Reference Cordesman and Davies2007; Johnson and Mason Reference Johnson and Mason2008). Similarly, the fact that violence in Iraq began to decline after Sunnis were brought into the security forces (Biddle, Friedman, and Shapiro Reference Biddle, Friedman and Shapiro2012) is consistent with the political cooptation argument, in which groups only engage in resistance when their political survival is in question.
Although future work is needed to fully evaluate the scope of the argument, the findings outlined in this article nevertheless have important policy implications. The results provide causal evidence that the devolution of authority in the context of foreign occupation can be an effective strategy for staving off or reducing armed resistance. But perhaps more importantly, the results also imply that we should expect this to be the case only for groups to whom power is entrusted or who are not threatened by the occupation. Thus, while delegating greater authority to natives may be an effective policy for reducing resistance to foreign rule, the results of this study suggest that foreign powers should be inclusive in this delegation and should be careful not to unnecessarily marginalize and threaten domestic groups within occupied states. Nevertheless, the devolution of authority does not ensure that native authorities will faithfully and efficiently comply with the occupier’s preferred policies. This tradeoff—between limiting resistance and maintaining control—has often led occupying powers to choose the latter.
SUPPLEMENTARY MATERIAL
To view supplementary material for this article, please visit http://dx.doi.org/10.1017/S0003055414000240
DATA SOURCES
Archives Départementales de la Charente. Angouleme, France.
Archives Départementales de la Vienne. Poitiers, France.
Archives Départementales de Saône et Loire. Macon, France.
Départementales et Patrimoine du Cher. Bourges, France.
Bibliothèque de l’Institut d’Histoire du Temps Présent. Paris, France.
Dictionnaire des Communes. 1939. Paris: Berger-Levrault.
Général de la Barre de Nanteuil. 1974. Historique des Unités Combattantes de la Résistance (1940-1944): Charente, Charente Maritime. Ministère des Armees, État Major de l’Armée de Terre, Service Historique, Chateau de Vincennes.
— Cher.
— Saône et Loire.
— Vienne.
Lachapelle, Georges. 1936. Élections Législatives, 26 Avril and Mai, 1936. Paris: Le Temps.
Memoire des hommes: Morts pour la France 39/45. Secretariat General Pour L’Administration, Ministere de la Defense. Accessible at http://www.memoiredeshommes.sga.defense.gouv.fr






Comments
No Comments have been published for this article.