Introduction
Efficient control and generation of spin-triplet states are essential for the understanding and advancement of current technologies, especially in regard to applications in photovoltaic (PV) devices. The processes of singlet fission (SF) and triplet fusion, or triplet–triplet annihilation upconversion (TTA-UC) depend on spin-triplet states to interconvert the wavelengths of the incident light and the resulting emission. The SF process involves the splitting of a higher-lying singlet state into two triplet states that can be harvested as photocurrent in PV devices,[Reference Lee, Jadhav, Reusswig, Yost, Thompson, Congreve, Hontz, Van Voorhis and Baldo1–Reference Einzinger, Wu, Kompalla, Smith, Perkinson, Nienhaus, Wieghold, Congreve, Kahn, Bawendi and Baldo5] whereas the opposite process of TTA-UC combines two triplet states to a higher-lying singlet state in a spin-allowed process that results in upconverted emission upon relaxation of the resultant singlet state.[Reference Singh-Rachford and Castellano6–Reference Schulze and Schmidt8] TTA is commonly observed in heavily conjugated organic molecules, such as polyacenes. Here, the electronic interactions between two triplet states on adjacent molecules allow for “annihilation” to a single higher lying singlet state.
In general, UC as a result of TTA has wide-ranging applications which include overcoming the Shockley–Queisser limit in single-junction solar cells,[Reference Shockley and Queisser9,Reference Rühle10] photocatalysis,[Reference Zhou, Liu, Feng, Sun and Li11–Reference Häring, Pérez-Ruiz, von Wangelin and Díaz14] three-dimensional displays,[Reference Deng, Qin, Chen, Huang, Hong and Liu15] bioimaging,[Reference Zhang, Zhang, Wei, Wu, Liu, Zhao and Huang16] and sub-bandgap sensitization of silicon-based devices for infrared (IR) imaging.[Reference Mailoa, Akey, Simmons, Hutchinson, Mathews, Sullivan, Recht, Winkler, Williams, Warrender, Persans, Aziz and Buonassisi17] However, as transitions from the singlet ground state to excited spin-triplet states are “spin-forbidden,” the triplet state must be indirectly populated, or sensitized, in order to efficiently harness their energy. This sensitization process can occur through a spin-allowed Dexter triplet energy transfer (TET) mechanism,[Reference Dexter18] where the triplet state of the acceptor molecule can be populated by a direct excitonic energy transfer from the sensitizer or through charge transfer of independent carriers to the bound triplet state.[Reference Nienhaus, Correa-Baena, Wieghold, Einzinger, Lin, Shulenberger, Klein, Wu, Bulović, Buonassisi, Baldo and Bawendi19–Reference Wieghold, Bieber, VanOrman and Nienhaus21] For the past years, metal–organic complexes with high spin–orbit coupling constants have commonly been used, which allow for the generation of triplet states through intersystem crossing (ISC).[Reference Singh-Rachford and Castellano6] However, large energy losses due to exchange energies up to 300 meV can still occur during the ISC process and limit the overall energy gained by the UC process.[Reference Singh-Rachford and Castellano6,Reference Amemori, Sasaki, Yanai and Kimizuka22] To overcome this limitation in the achievable UC efficiency, semiconducting nanocrystals (NCs) have been explored as sensitizers. NCs have several advantages over the previous metal–organic complexes: (i) strong spin–orbit coupling results in their unique wavefunction which exhibits both singlet and triplet character and (ii) small exchange energies, resulting in minimal energy losses in the triplet sensitization process.[Reference Kim, Wong and Scholes23–Reference Scholes and Rumbles25] In addition, NCs are prime candidates to be used as sensitizer materials in TTA-UC systems[Reference Huang, Li, Mahboub, Hanson, Nichols, Le, Tang and Bardeen26–Reference Wu, Congreve, Wilson, Jean, Geva, Welborn, Van Voorhis, Bulović, Bawendi and Baldo28] due to their facile synthetic bandgap tunability as well as exceptional photophysical properties.[Reference Kovalenko, Manna, Cabot, Hens, Talapin, Kagan, Klimov, Rogach, Reiss, Milliron, Guyot-Sionnnest, Konstantatos, Parak, Hyeon, Korgel, Murray and Heiss29] However, bulky surface ligands are required for both colloidal stability and surface passivation of NCs and can limit the UC efficiency,[Reference Huang and Tang30] as they pose an additional tunneling barrier for TET.[Reference Dexter18,Reference Huang and Tang30–Reference Huang, Li, Mahboub, Hanson, Nichols, Le, Tang and Bardeen33] When incorporated into solid-state devices, the performance of NC-based UC devices has also been low due to low optical absorbance based on film thickness limitations. These limitations mostly result from inefficient exciton diffusion,[Reference Geva, Nienhaus, Wu, Bulovic, Baldo, Van Voorhis and Bawendi34] making application and compatibility of UC devices to state-of-the-art PV devices still relatively far away.[Reference Geva, Nienhaus, Wu, Bulovic, Baldo, Van Voorhis and Bawendi34] In this perspective, we briefly introduce TTA-UC, followed by a review of materials used in state-of-the-art UC devices. In the last section of this perspective, we discuss new approaches to triplet sensitization that expands beyond semiconductor NCs, such as bulk perovskite sensitization of rubrene triplet states through a charge transfer process.
Threshold intensity for efficient upconversion
The goal is to implement TTA-UC in state-of-the-art PV devices requiring the UC process to be efficient at solar, or even sub-solar fluxes. In general, the UC efficiency, denoted as η UC, is defined as the percentage of low energy photons absorbed that contribute to UC, and result in higher-energy emissive states in the acceptor molecule.[Reference Singh-Rachford and Castellano6,Reference Zhou, Liu, Feng, Sun and Li11] η UC can be obtained from the product of the energy transfer efficiency (η ET) from the sensitizer to the annihilator, the TTA efficiency of the annihilator (η TTA), and the photoluminescence quantum yield (PLQY) of the annihilator/emitter (η ann).[Reference Mahboub, Maghsoudiganjeh, Pham, Huang and Tang35]
 $$\eta _{{\rm UC}} = \eta _{{\rm ET}}\cdot \eta _{{\rm TTA}}\cdot \eta _{{\rm ann}}.$$
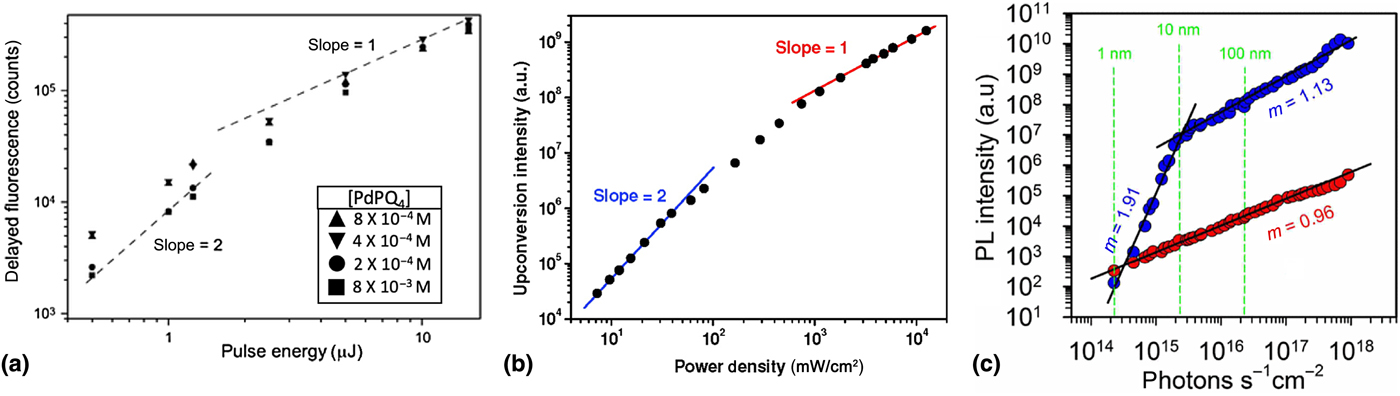
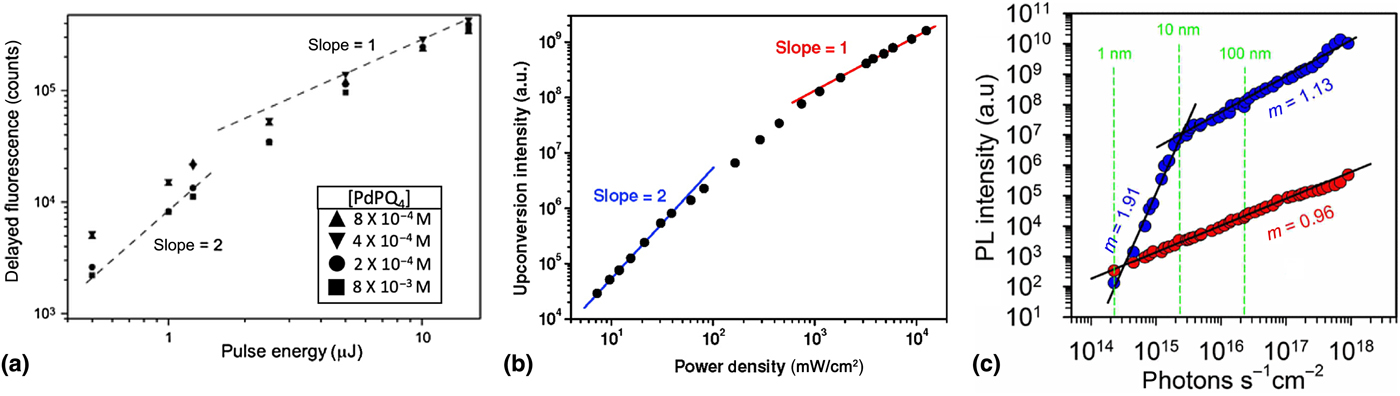
The UC efficiency η UC is power dependent and a commonly accepted method of determining the efficiency threshold of TTA resulting in singlet states relies on the power dependence of the UC PL. In a log–log plot of PL intensity versus laser excitation density, the intensity threshold I th at which TTA becomes efficient can be observed (Fig. 1).[Reference Cheng, Khoury, Clady, Tayebjee, Ekins-Daukes, Crossley and Schmidt36–Reference Monguzzi, Mezyk, Scotognella, Tubino and Meinardi38] In the region where TTA is inefficient, a quadratic power dependence is observed: slope of α = 2. The quadratic region denotes a quasi-first order triplet recombination pathway involving phosphorescence, quenching, and nonradiative relaxation to the ground state. Above the threshold I th, a linear dependence can be observed (slope α = 1), which results from the recombination of the triplet population primarily through the desired TTA pathway creating high-energy singlets.[Reference Cheng, Khoury, Clady, Tayebjee, Ekins-Daukes, Crossley and Schmidt36–Reference Monguzzi, Mezyk, Scotognella, Tubino and Meinardi38]
(a) The PL power dependency of different sensitizer concentrations of a solution-based palladium(II)tetrakisquinoxalinoporphyrin (PQ4Pd)/rubrene upconversion system where both maximized performance is observed above the intensity threshold (linear dependence, slope = 1), as well as a quadratic dependency (slope = 2) below the threshold intensity I th. Adapted from Ref. [Reference Cheng, Khoury, Clady, Tayebjee, Ekins-Daukes, Crossley and Schmidt36] with permission from the PCCP Owner Societies. (b) PL power dependence of a palladium(II)octaethylporphyrin (PdOEP)/DPA mixture. Adapted from Ref. [Reference Haefele, Blumhoff, Khnayzer and Castellano37] with permission. Copyright 2012 The American Chemical Society. https://doi.org/10.1021/jz300012u. Further permissions related to the material excerpted should be directed to the ACS. (c) PL power dependency of a platinum(II)octaethylporphyrin (PtOEP)/DPA mixture. The upconverted emission is shown as blue circles where the phosphorescent emission from PtOEP is shown as red circles. Adapted with permission from Ref. [Reference Monguzzi, Mezyk, Scotognella, Tubino and Meinardi38]. Copyright 2008 American Physical Society.
Metal–organic complexes as triplet sensitizers
For the past decade, metal–organic complexes have been widely studied as sensitizers in TTA-UC systems.[Reference Singh-Rachford and Castellano6] The heavy metals in these complexes, e.g., Pt,[Reference Singh-Rachford and Castellano39,Reference Singh-Rachford and Castellano40] Pd,[Reference Singh-Rachford and Castellano41,Reference Islangulov, Lott, Weder and Castellano42] or Ru[Reference Kozlov and Castellano43,Reference Islangulov, Kozlov and Castellano44] enhance spin–orbit coupling, thereby mediating efficient ISC to the triplet excited state. In a metal–organic-sensitized system, the metal–organic complex sensitizer is excited from its ground state to an excited singlet state followed by ISC to a triplet state. TET to the acceptor molecule populates the triplet state of the acceptor enabling TTA-UC.
Although “delayed fluorescence” as a result of TTA was first discovered by C.A. Parker in 1962,[Reference Parker, Hatchard and John45] metal–organic-sensitized TTA was not observed until much later. In one of the first reports of metal–organic-sensitized TTA in 2004,[Reference Kozlov and Castellano43] the following complex was used: [Ru(dmb)2(bpy-An)]2+, where dmb is 4,4′-dimethyl -2,2′-bipyridine and bpy-An is 4-methyl-4′-(9-anthrylethyl)-2,2′-bipyridine. UC emission resulted via metal–organic-sensitized TTA upon 450 nm excitation. The excitation of the system produces a metal-to-ligand charge transfer (MLCT) triplet state that can efficiently sensitize the anthracene triplet state, resulting in TTA-UC. This sensitization scheme relies on the alignment of energy levels, as the triplet energy level of anthracene is lower than the triplet MLCT excited state, but the singlet excited state of anthracene is higher in energy than the singlet MLCT excited state.[Reference Boyde, Strouse, Jones and Meyer46]
Subsequent reports of green-to-blue UC by Castellano and co-workers[Reference Islangulov, Kozlov and Castellano44] using 9,10-diphenylanthracene (DPA) as a triplet acceptor in the place of anthracene resulted in a significant increase in the intensity of the observed UC emission, which also allowed for lower incident excitation powers.[Reference Islangulov, Kozlov and Castellano44] This was attributed partly to the increased QY of DPA as compared to anthracene (Φ = 0.95 and 0.27, respectively)[Reference Murov, Hug and Carmichael47] but also due to the decreased likelihood of dimerization in DPA as compared to anthracene.
Singh-Rachford et al.[Reference Singh-Rachford and Castellano39,Reference Singh-Rachford and Castellano40] achieved red-to-blue TTA-UC using platinum(II) tetraphenyltetrabenzoprophyrin (PtTPBP) as their sensitizer. An energy gain of 0.80 eV in the UC process was observed when coupled with the acceptor molecule perylene, a polycyclic aromatic hydrocarbon.[Reference Singh-Rachford and Castellano40] The UC efficiency was determined to be only 0.00065 ± 0.0001% for this system. This low efficiency was suggested to be from competing nonradiative pathways such as electron transfer quenching or perylene excimer formation.[Reference Singh-Rachford and Castellano40]
However, many challenges still exist for metal–organic sensitizers. Some key limitations include large energy losses in ISC, low relative photostability, and the difficulty to efficiently operate beyond the near-infrared (NIR) region.[Reference Huang, Li, Mahboub, Hanson, Nichols, Le, Tang and Bardeen26] In particular, the energy gap law[Reference Henry and Siebrand48] predicts an increase in the nonradiative recombination rate for decreasing energy of the S0–S1 transition.[Reference Shi, Izquierdo, Oh, Park, Milián-Medina, Roca-Sanjuán and Gierschner49] For UC to add efficiency to PV devices, it is crucial to upconvert IR light below the bandgap of silicon.[Reference Schmidt, Gholizadeh, Prasad, Teh, Ishwara, Norman, Petty, Anthony and Huang50]
Another challenge for metal–organic sensitizers is the UC of visible-to-ultraviolet (UV) light. Currently, there have only been a limited number of reports of efficient visible-to-UV UC by Castellano and others.[Reference Duan, Yanai and Kimizuka51–Reference Deng, Blumhoff and Castellano55] One detrimental issue is the parasitic reabsorption of the UC emission. Since the UC emission is within the absorption of the sensitizer, there is also singlet–singlet energy back-transfer.[Reference Duan, Yanai and Kimizuka51] This greatly hinders the UC QY and thus results in very high excitation powers required for efficient TTA.
Quantum dot sensitization
Another class of material is semiconductor NCs or quantum dots (QDs), which present an alternative sensitization route that offers several advantages over metal–organic systems. Strong spin–orbit coupling in these NCs mixes wavefunctions with singlet and triplet character, allowing for efficient coupling of the exciton to a molecular triplet state. Facile synthetic and compositional bandgap tuning enables NCs to function as sensitizers over a large spectral range spanning the visible and short-wave IR allowing for the selection of a UC wavelength far beyond 800 nm.[Reference Huang, Li, Mahboub, Hanson, Nichols, Le, Tang and Bardeen26] Commonly used NCs for sensitization of TTA-UC systems are based on either cadmium or lead chalcogenides, including CdSe,[Reference Huang, Li, Yip, Rubalcava, Bardeen and Tang56–Reference Mongin, Garakyaraghi, Razgoniaeva, Zamkov and Castellano58] PbSe,[Reference Huang, Li, Mahboub, Hanson, Nichols, Le, Tang and Bardeen26] and PbS.[Reference Nienhaus, Wu, Geva, Shepherd, Wilson, Bulović, Van Voorhis, Baldo and Bawendi32,Reference Lauth, Grimaldi, Kinge, Houtepen, Siebbeles and Scheele59–Reference Huang, Xu, Mahboub, Liang, Jaimes, Xia, Graham, Tang and Lian61]
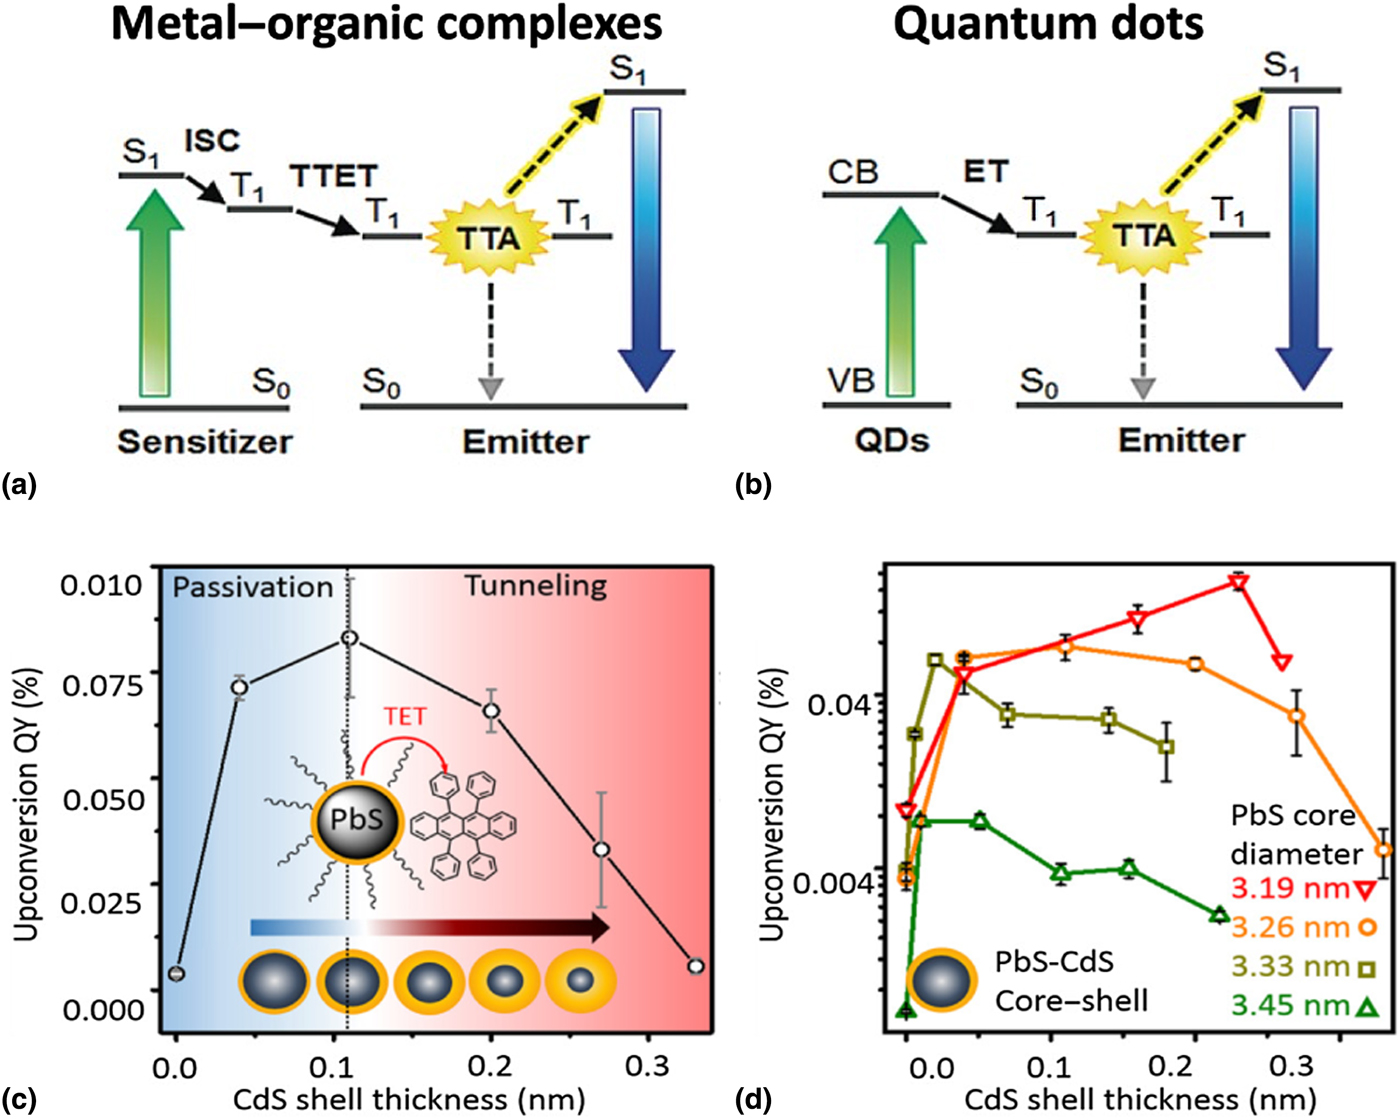
The triplet character of the wavefunction of semiconductor NCs was initially shown to be able to create singlet oxygen (1O2) by TET, which is a competing pathway to the TTA-UC desired here.[Reference Mongin, Garakyaraghi, Razgoniaeva, Zamkov and Castellano58,Reference Samia, Chen and Burda62 , Reference Zenkevich, Sagun, Knyukshto, Stasheuski, Galievsky, Stupak, Blaudeck and von Borczyskowski63] The use of NCs in photon interconversion applications was first discovered by the reverse process of SF in 2014,[Reference Thompson, Wilson, Congreve, Brown, Scherer, Bischof, Wu, Geva, Welborn, Voorhis, Bulović, Bawendi and Baldo64,Reference Tabachnyk, Ehrler, Gélinas, Böhm, Walker, Musselman, Greenham, Friend and Rao65] but it was reported soon after that, that such semiconductor NCs can also function as efficient sensitizers for TTA-UC applications.[Reference Huang, Li, Mahboub, Hanson, Nichols, Le, Tang and Bardeen26–Reference Wu, Congreve, Wilson, Jean, Geva, Welborn, Van Voorhis, Bulović, Bawendi and Baldo28,Reference Mahboub, Maghsoudiganjeh, Pham, Huang and Tang35, Reference Mongin, Garakyaraghi, Razgoniaeva, Zamkov and Castellano58, Reference Nienhaus, Wu, Bulović, Baldo and Bawendi66, Reference Mase, Okumura, Yanai and Kimizuka67] Figures 2(a) and 2(b) detail the process of TTA-UC in the two different systems, namely metal–organic and NC sensitization, respectively.[Reference Okumura, Mase, Yanai and Kimizuka27] Figure 2(a) shows the basic mechanism for TTA-UC utilizing metal–organic sensitization as discussed in the previous section: the initially excited singlet exciton undergoes ISC to the triplet state T1. This triplet state is then transferred to the annihilator via triplet–triplet energy transfer (TTET). Electronic interactions of two adjacent triplet states can result in TTA, creating the higher energy emissive singlet state. In NC-sensitized UC [Fig. 2(b)] on the other hand, the loss due to the exchange energy can be reduced as their strong spin–orbit coupling results in wavefunctions exhibiting both singlet and triplet character.[Reference Kim, Wong and Scholes23] The optically excited exciton in the NC is transferred directly to the triplet state of the annihilator, and TTA results in the generation of an emissive high-energy singlet state.
(a) Metal–organic-sensitized TTA-UC: intersystem crossing (ISC) from the singlet to the triplet state, followed by triplet–triplet energy transfer (TTET). Subsequent TTA of two triplets T 1 yields the higher-energy emissive singlet state. (b) Quantum dot-sensitized TTA-UC: energy transfer (ET) from the conduction band (CB) to the triplet state T1. The collision of two triplet states leads to TTA and emission from a higher energy singlet state. Adapted with permission from Ref. [Reference Okumura, Mase, Yanai and Kimizuka27]. Copyright 2016 John Wiley and Sons. (c) In a PbS core QD with a CdS shell, the UC QY when coupled with rubrene initially increases when the thickness of the CdS shell is increased. However, after reaching a maximum, the upconversion QY diminishes with increasing shell thickness, as the shell imposes an additional tunneling barrier. (d) Upconversion QY of four different PbS–CdS core–shell QD systems as a function of the CdS shell thickness and the PbS core dimension. Adapted with permission from Ref. [Reference Mahboub, Huang and Tang68]. Copyright 2016 American Chemical Society. https://doi.org/10.1021/acs.nanolett.6b03503. Further permissions related to the material excerpted should be directed to the ACS.

Although this alternative route of employing semiconducting NCs as sensitizers in TTA-UC systems readily showed an improved UC efficiency over metal–organic complexes, there is still a need to further improve the systems QY. Here, a path towards improving the efficiency of NC semiconductor-sensitized systems involves the use of core–shell NCs, where the surface of the NC is passivated by a shell composed of a wider bandgap material [Fig. 2(c)].[Reference Okumura, Mase, Yanai and Kimizuka27] The shell reduces defect sites where nonradiative recombination can occur hence, the photophysical properties are greatly improved. However, as shown in Figs. 2(c) and 2(d), the addition of a shell presents another problem: an additional tunneling barrier hindering efficient TET.[Reference Mahboub, Huang and Tang68] As can be seen, the UC QY increases initially when creating a passivating shell but then sharply decreases with increasing shell thickness since Dexter transfer is exponentially dependent on the donor–acceptor spacing.[Reference Dexter18] This indicates that shells must be kept thick enough to limit nonradiative recombination on the NC surface but thin enough to enable efficient TET to the transmitter ligand or acceptor molecule. In Fig. 2(c), for a PbS QD core with a CdS shell, this interplay between the thickness of the shell and UC QY is shown. In the first regime between a CdS shell thickness of 0 and 0.1 nm, the UC QY increases to a maximum. Beyond that point, the UC QY decreases as a function of the shell thickness. However, the thickness of the shell alone is not the only factor relevant to the UC QY. As shown in Fig. 2(d), the size of the QD core also has an impact on the UC QY, as a smaller core QD requires a larger shell to passivate an increased number of surface traps relative to its size.[Reference Liu, Gibbs, Puthussery, Gaik, Ihly, Hillhouse and Law69] Nevertheless, the same trend as in Fig. 2(c) is still observed for all core diameters.
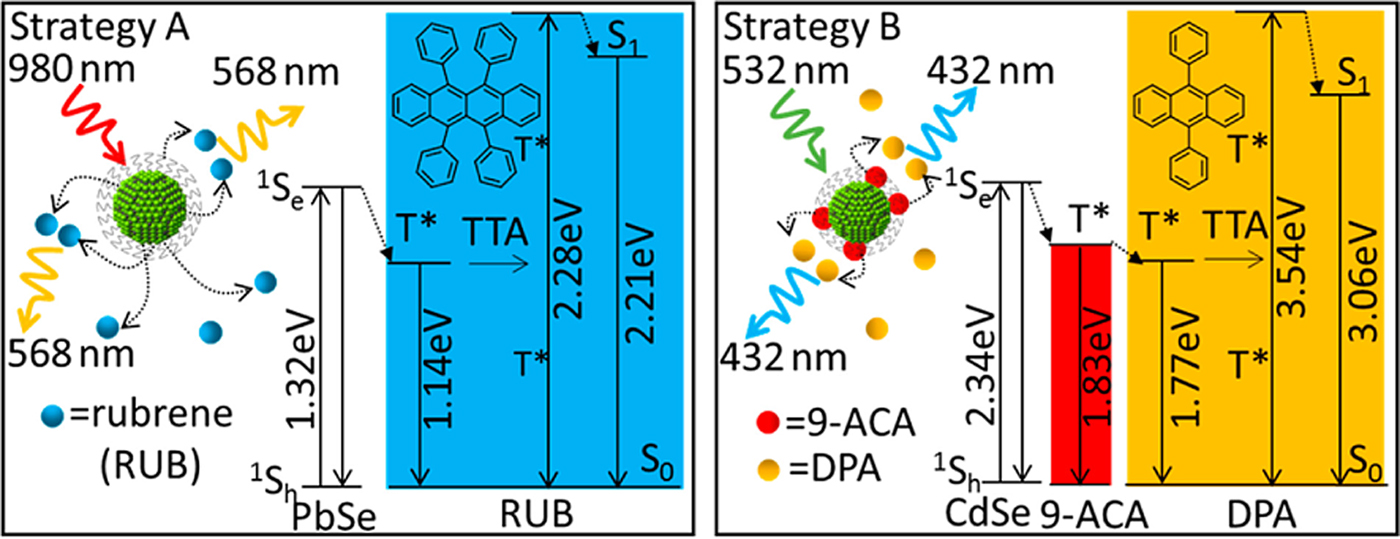
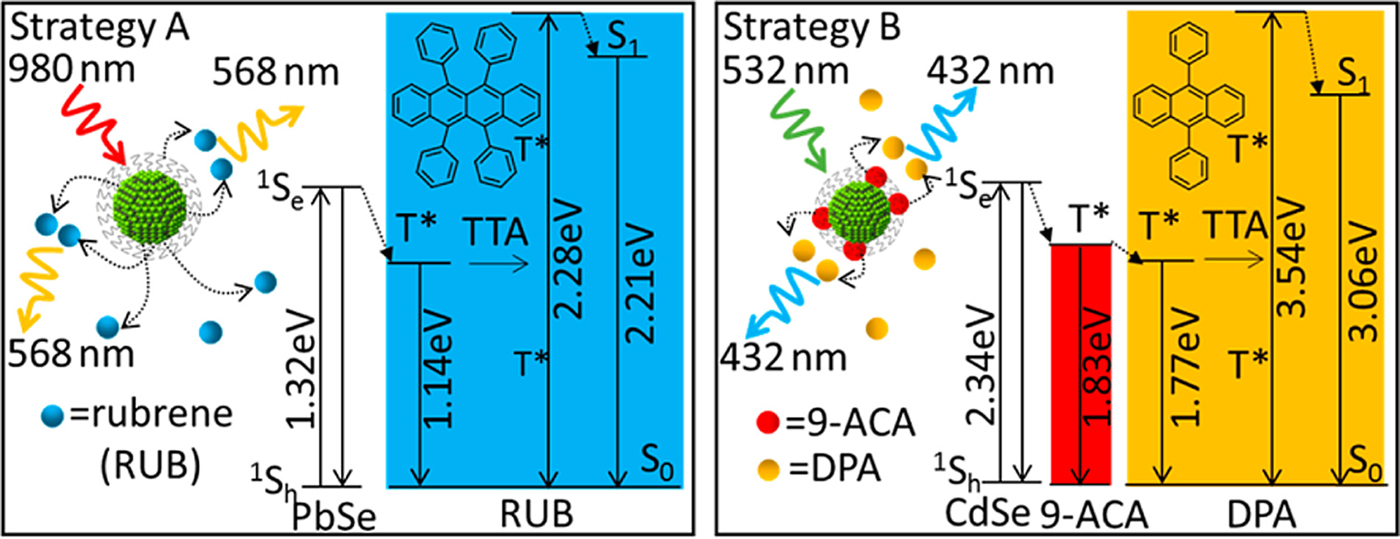
However, one significant challenge remains, which limits the UC efficiency of these NC-sensitized TTA systems. Semiconductor NCs rely on bulky ligands required to passivate their surface and for colloidal stability. These ligands can significantly limit the TET efficiency between sensitizer and acceptor, due to the exponential distance dependence of the Dexter energy transfer mechanism.[Reference Dexter18] By implementing transmitter ligands, which funnel the triplet to the outer ligand shell, the TET efficiency can be greatly increased.[Reference Huang and Tang30,Reference Huang, Li, Mahboub, Hanson, Nichols, Le, Tang and Bardeen33] Strategy A (Fig. 3) details a PbSe NC sensitizer, which is simply mixed with the acceptor rubrene in solution. Here the exciton must overcome the tunneling barrier posed by the ligands prior to TET. Strategy B (Fig. 3), however, adds a transmitter ligand. In using CdSe as a sensitizer modified with a 9-anthracenecarboxylic acid (9-ACA) transmitter ligand and a DPA acceptor, DPA exhibits emission ~103 times higher than without the transmitter ligand.[Reference Huang and Tang30]
Schematic detailing two approaches toward QD sensitization. Strategy A is the direct sensitization of the acceptor triplet state (T*), whereas strategy B uses sensitization of a transmitter ligand (9-ACA) that consequently performs triplet energy transfer to the acceptor. Reproduced from Ref. [Reference Huang, Li, Mahboub, Hanson, Nichols, Le, Tang and Bardeen33] with permission. Copyright 2015 American Chemical Society. https://doi.org/10.1021/acs.nanolett.5b02130. Further permissions related to the material excerpted should be directed to the ACS.
This approach is also implemented in work done by Okumura et al.[Reference Okumura, Mase, Yanai and Kimizuka27] where a CdSe NC is modified with a ZnS shell prior to the addition of transmitter ligands. In this work, the I th value and the UC efficiency η UC were monitored for three systems: a core–shell NC, a core–shell NC modified with transmitter ligands, and a NC with no shell but modified with a transmitter ligand. The addition of transmitter ligands to the core–shell NC increased both the I th and η UC largely, but the core–shell NC also outperformed the NC with no shell modified with transmitter ligand, highlighting the role of NC surface defects on both the I th and the overall efficiency of UC.
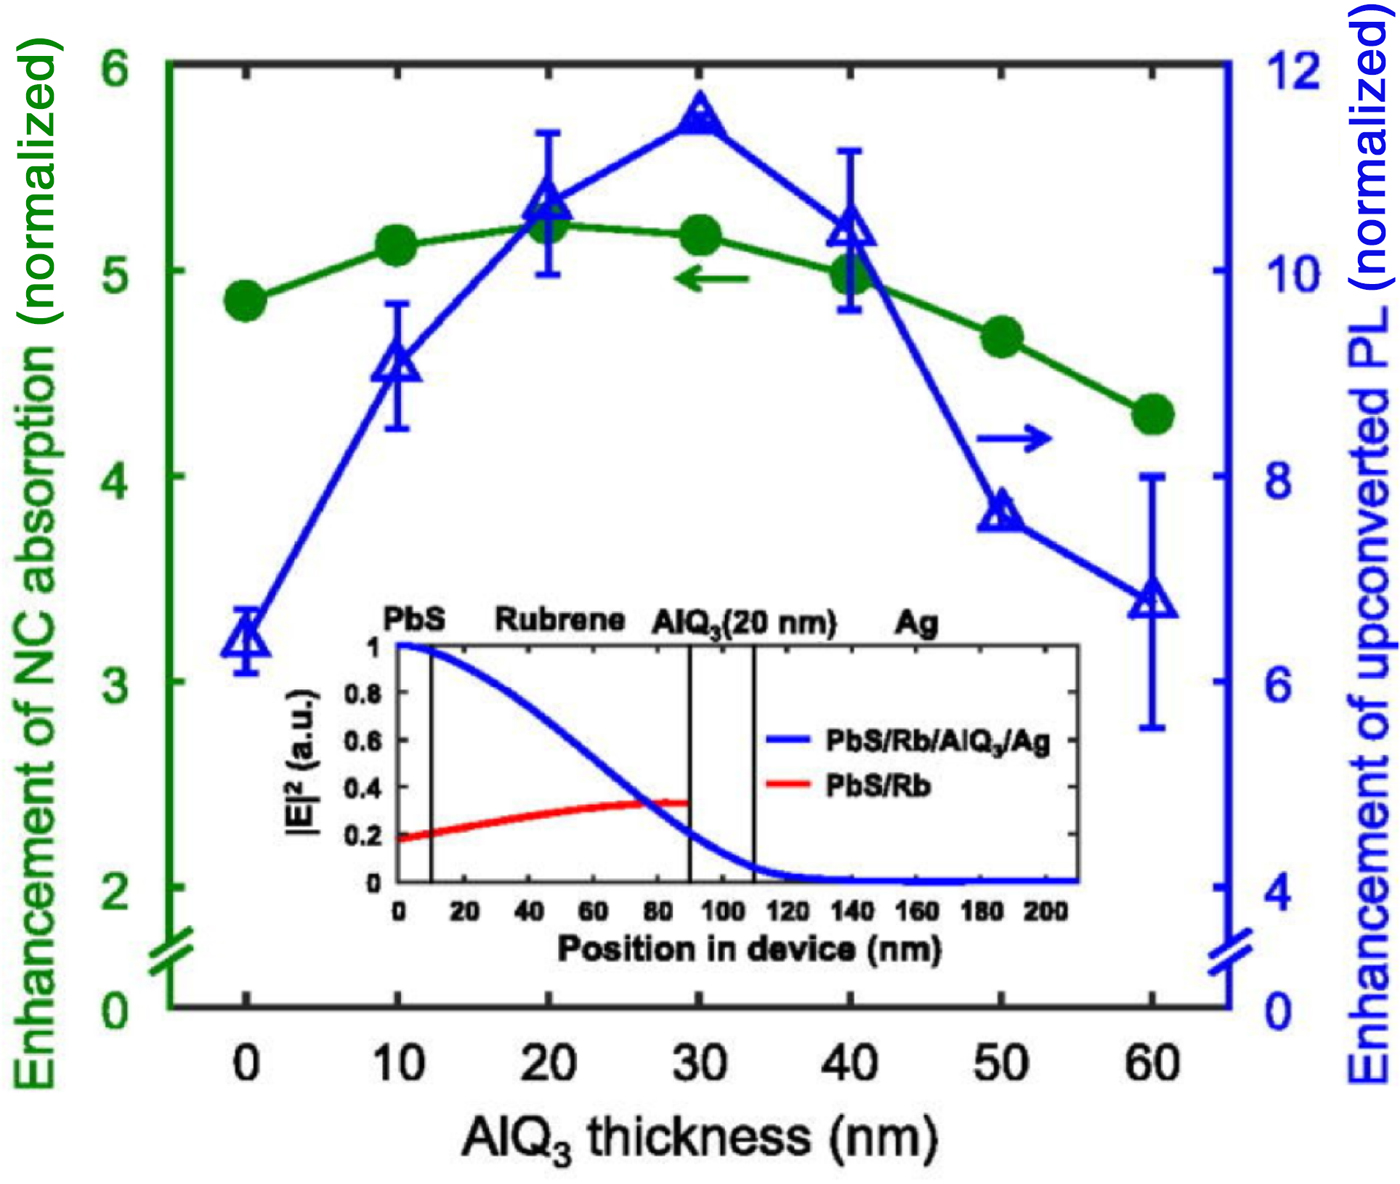
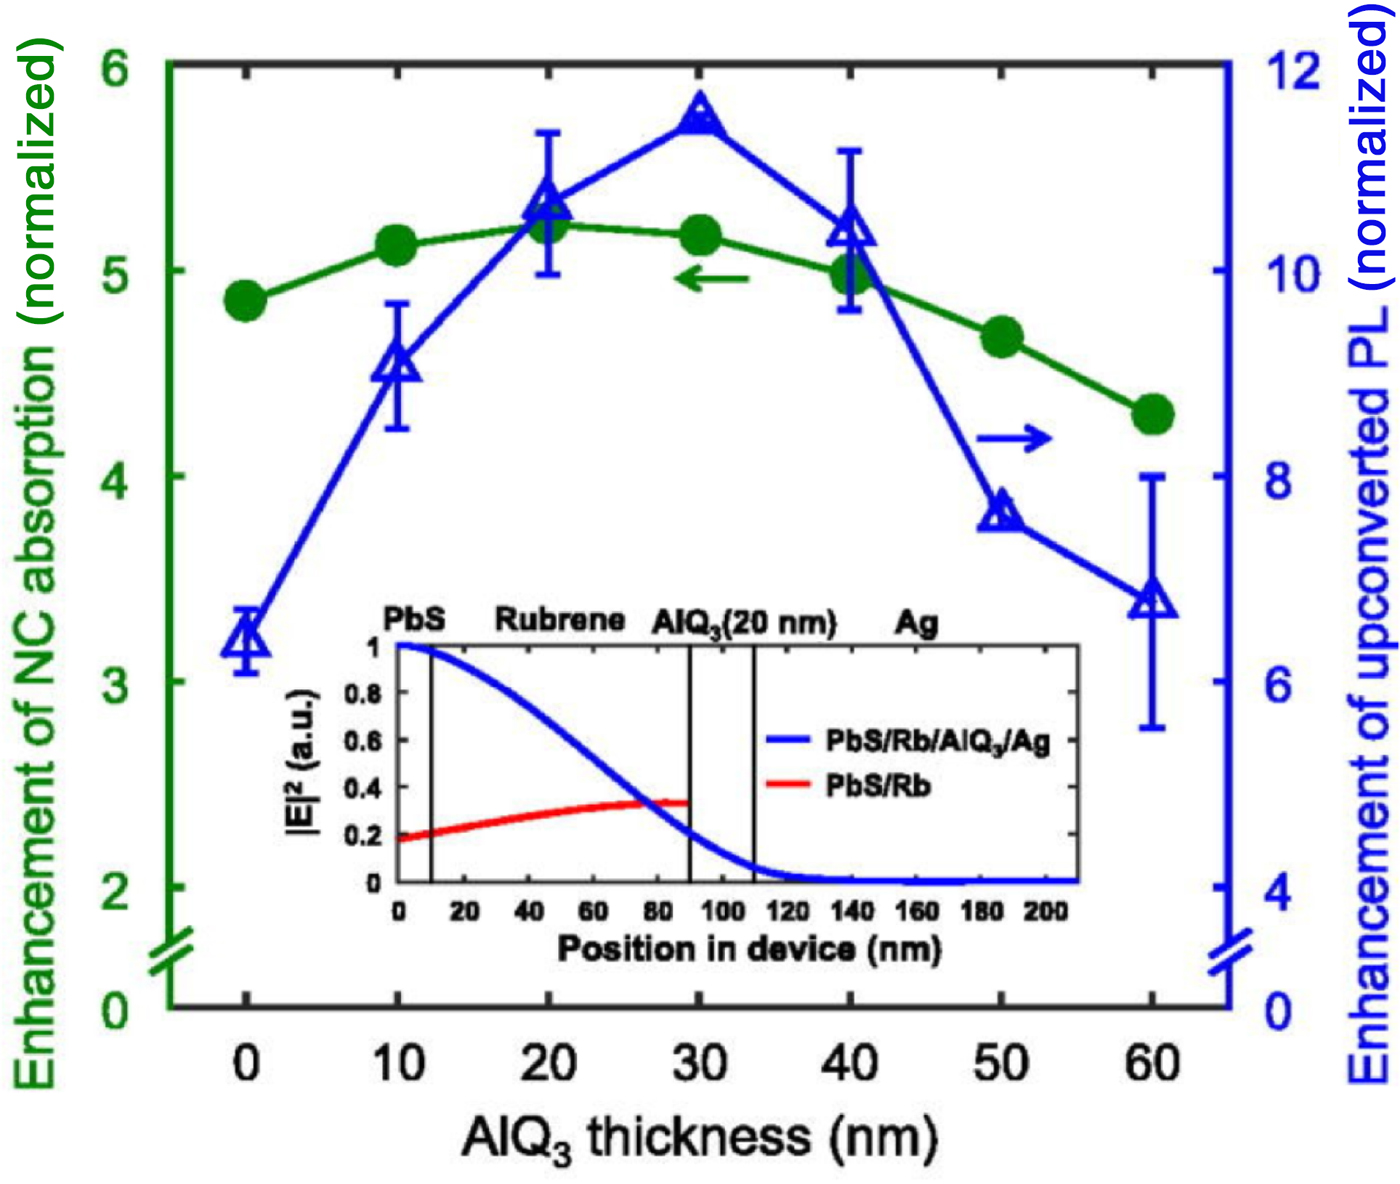
Following these reports of solution-based NC-sensitized UC, semiconductor NCs have also been integrated into solid-state devices. Devices are fabricated by spin-casting PbS NCs onto a substrate followed by thermal evaporation of rubrene/0.5% tetraphenyldibenzoperiflanthene (DBP) in a guest–host/annihilator–emitter pair.[Reference Wu, Congreve, Wilson, Jean, Geva, Welborn, Van Voorhis, Bulović, Bawendi and Baldo28,Reference Nienhaus, Wu, Geva, Shepherd, Wilson, Bulović, Van Voorhis, Baldo and Bawendi32 , Reference Wu, Jean, Bulović and Baldo70] Reports by Baldo and co-workers show that the UC efficiency of the device can be further increased by the addition of a reflective layer as well as a dielectric spacer, as this device structure effectively increases the absorption of the NC film through interference effects that enhance the optical field.[Reference Wu, Jean, Bulović and Baldo70] The UC emission obtained from the device is increased by up to an order of magnitude by the addition of an AlQ3 spacer layer and Ag reflective layer and is dependent on the thickness of the AlQ3 layer (Fig. 4). The combination of this interference enhancement and a reduction in the NC–rubrene spacing by ligand exchange consequently yielded a current solid-state PbS NC-sensitized UC efficiency of 7%.[Reference Nienhaus, Wu, Geva, Shepherd, Wilson, Bulović, Van Voorhis, Baldo and Bawendi32]
The effect of AlQ3 thickness on the absorption of the NC layer and the UCPL. The NC layer absorption enhancement (green) decreases upon the increase of the thickness AlQ3 layer, while the UCPL is enhanced from the up to a thickness of the AlQ3 layer of 30 nm after which it then decreases. Adapted from Ref. [Reference Wu, Jean, Bulović and Baldo70] with the permission of AIP Publishing.
A kinetic model based on the aforementioned PbS solid-state UC system was developed to recreate the PL dynamics in both a monolayer and multilayered sensitized UC system.[Reference Geva, Nienhaus, Wu, Bulovic, Baldo, Van Voorhis and Bawendi34] Interestingly, the addition of another PbS monolayer to the PbS/rubrene system has little effect on the intensity of the UC PL due to inefficient exciton transport through the PbS film. The addition of the second monolayer of PbS NCs introduces pathways that are disruptive to the UC efficiency: long-range Förster-like energy transfer from rubrene to the distant PbS film. The model highlights that parasitic back-transfer from rubrene to PbS is problematic even in single monolayer devices and may lead to the large discrepancy between the near-unity TET and the 7% η UC reported previously.[Reference Nienhaus, Wu, Geva, Shepherd, Wilson, Bulović, Van Voorhis, Baldo and Bawendi32]
Beyond conventional quantum dots—excitonic perovskites
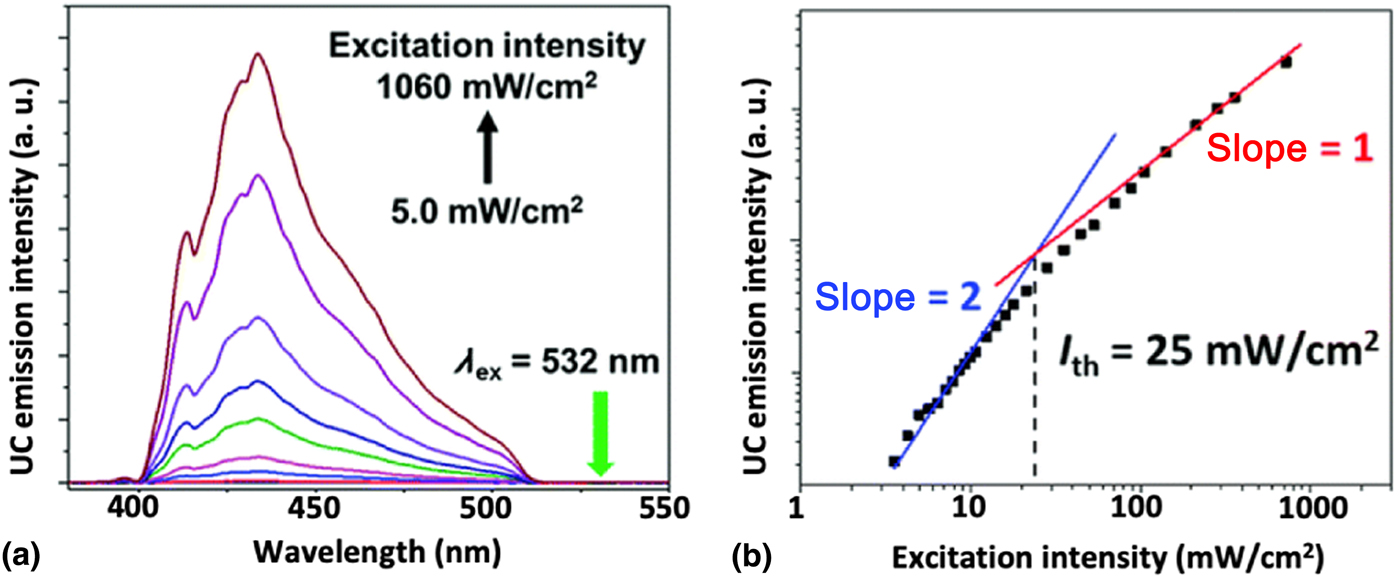
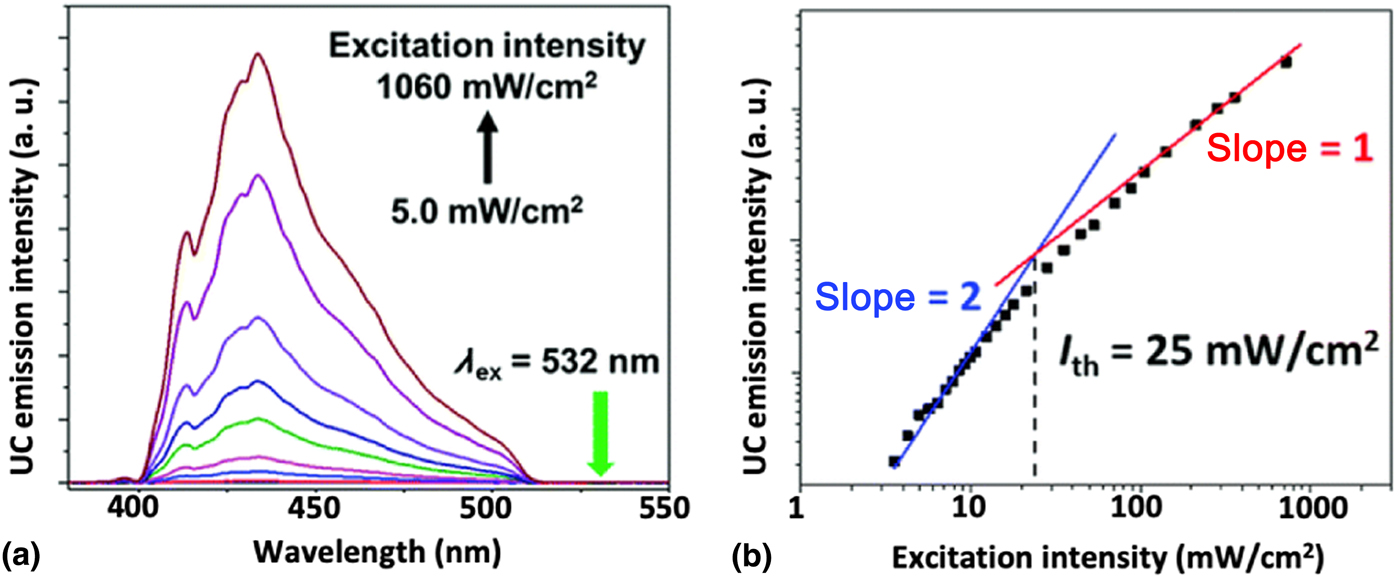
Following the reports of conventional semiconductor NCs as triplet sensitizers, perovskite NCs have also been explored as potential triplet sensitizers.[Reference Mase, Okumura, Yanai and Kimizuka67,Reference Luo, Lai, Li, Han, Liang, Liu, Ding, Wang and Wu71 , Reference Han, Luo, Lai, Li, Liang and Wu72] In 2017, Mase et al.[Reference Mase, Okumura, Yanai and Kimizuka67] performed the first UC experiment utilizing perovskite NCs for triplet sensitization in TTA-UC applications. They used CsPbX3 nanocrystals (X = Br, I), DPA as the acceptor, and a DPA derivative as the transmitter ligand. As shown by Fig. 5(a), the UC emission was observed at ~430 nm under 532 nm excitation. The I th value [Fig. 5(b)] was obtained by measuring the power dependence of the UC emission intensity, resulting in I th = 25 mW/cm2, demonstrating that perovskite NCs efficiently sensitize DPA triplets under low illumination densities. The UC efficiency was estimated at 1.3%.
(a) UC PL monitored at 532 nm different excitation intensities. (b) Power dependence of the UC emission intensity at 430 nm. The I th, 25 mW/cm2, is found at the intersection between the lines of slope = 2 and slope = 1. Reproduced from Ref. [Reference Mase, Okumura, Yanai and Kimizuka67] with permission from The Royal Society of Chemistry.
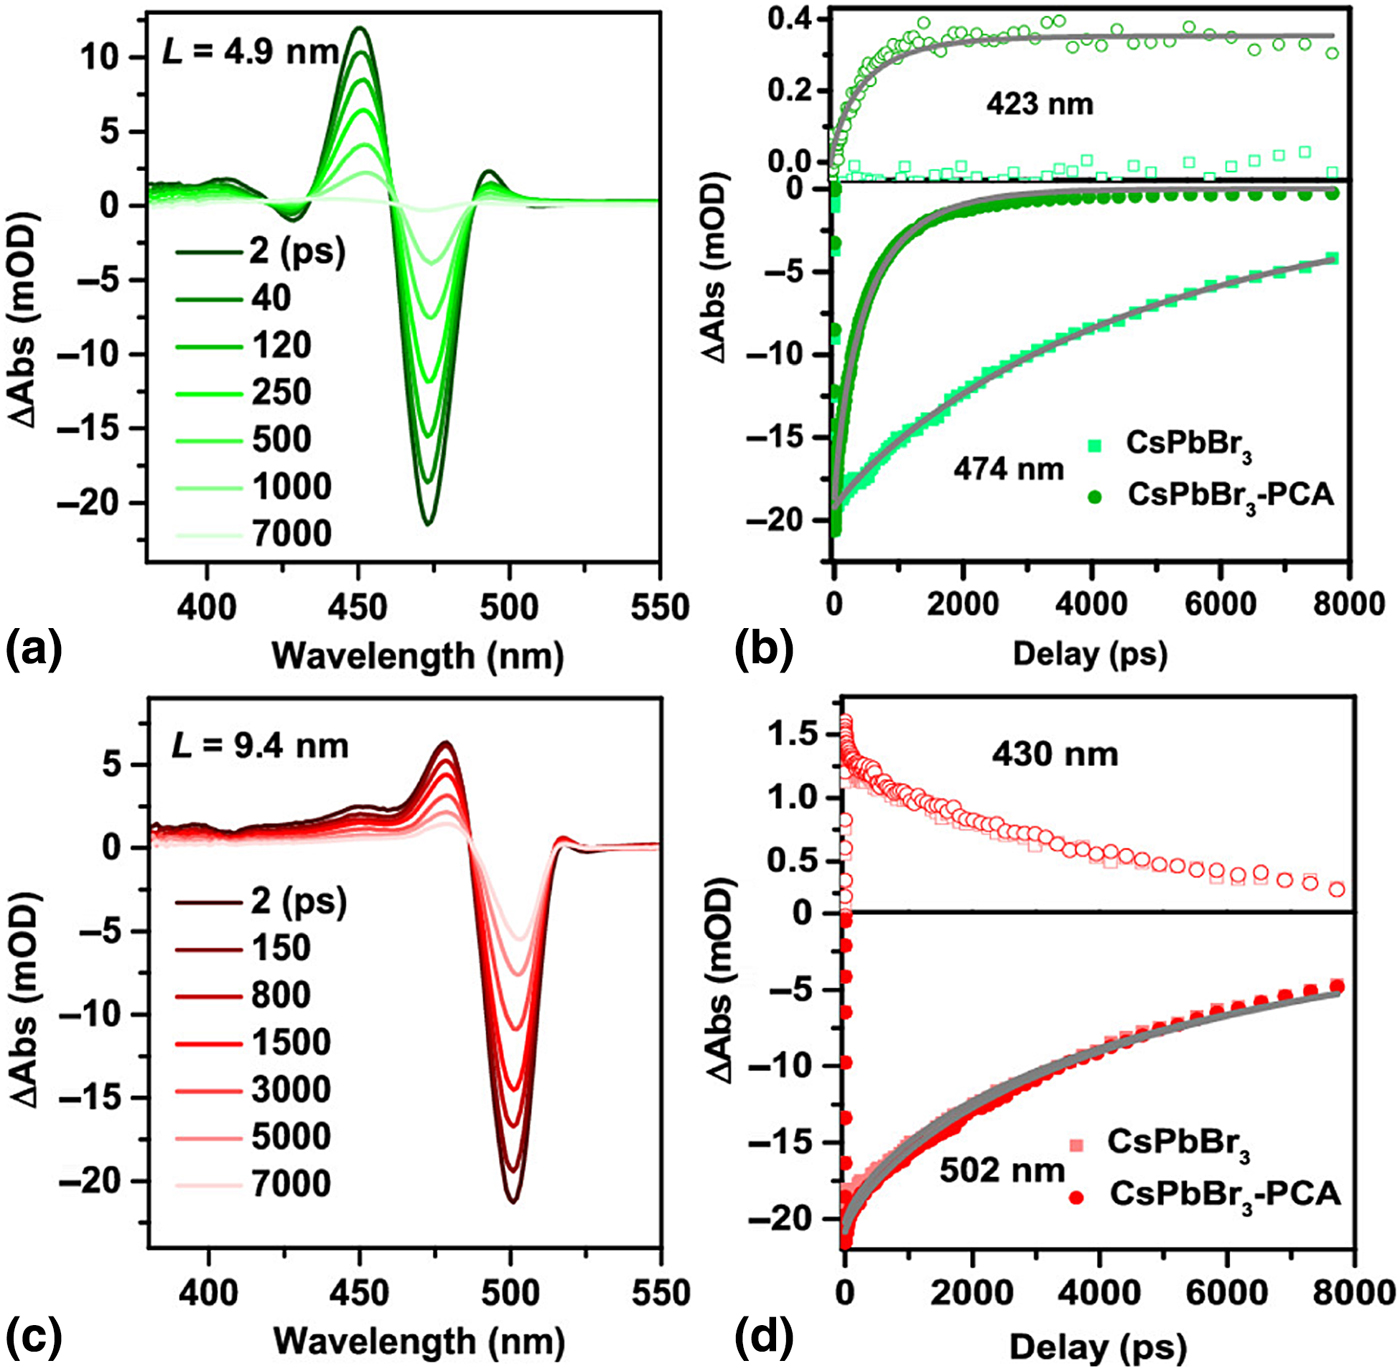
To further explore the potential of perovskite NCs as triplet sensitizers, the dynamics of TET from the perovskite NCs to 1-pyrenecarboxylic acid (PCA), a triplet acceptor, were investigated by transient absorption (TA) spectroscopy, as shown in Fig. 6.[Reference Luo, Lai, Li, Han, Liang, Liu, Ding, Wang and Wu71] TA spectra of CsPbBr3 and the corresponding CsPbBr3–PCA complex are shown in Fig. 6(a) for a NC with an edge length of L = 4.9 nm. The TA kinetics were selectively probed at two wavelengths, one attributed to exciton bleaching [474 nm in Fig. 6(b)] and the other to the T1 → Tn transition [423 nm in Fig. 6(b)] in the NC-PCA systems. As shown in Fig. 6(b), the lifetime of the exciton bleach is quenched upon addition of triplet acceptor. In contrast, the larger NCs (L = 9.4 nm) shown in Figs. 6(c) and 6(d) show no indication of additional quenching upon the addition of PCA, and the T1 → Tn transition in PCA is not observed, leading the authors to conclude that quantum confinement is required for TET to occur in this system.
(a) Transient absorption (TA) spectra of a CsPbBr3–PCA complex with an edge length of L = 4.9 nm at different delay times, λ ex = 470 nm. (b) TA kinetics at 423 nm (top, open symbols, PCA triplet absorption) and 474 nm (bottom, solid symbols, CsPbBr3 exciton bleach) for CsPbBr3 and the CsPbBr3–PCA complex with L = 4.9 nm. The solid lines correspond to stretched exponential fits for each decay trace. (c) TA spectra of the CsPbBr3 NC-PCA system with an edge length of L = 9.4 nm, λ ex = 470 nm. (d) TA kinetics at 430 nm (top, open symbols) and 502 nm for CsPbBr3 and CsPbBr3–PCA complex with L = 9.4 nm. Reproduced from Ref. [Reference Luo, Lai, Li, Han, Liang, Liu, Ding, Wang and Wu71] with permission. Copyright 2019 American Chemical Society. https://doi.org/10.1021/jacs.8b13180. Further permissions related to the material excerpted should be directed to the ACS.
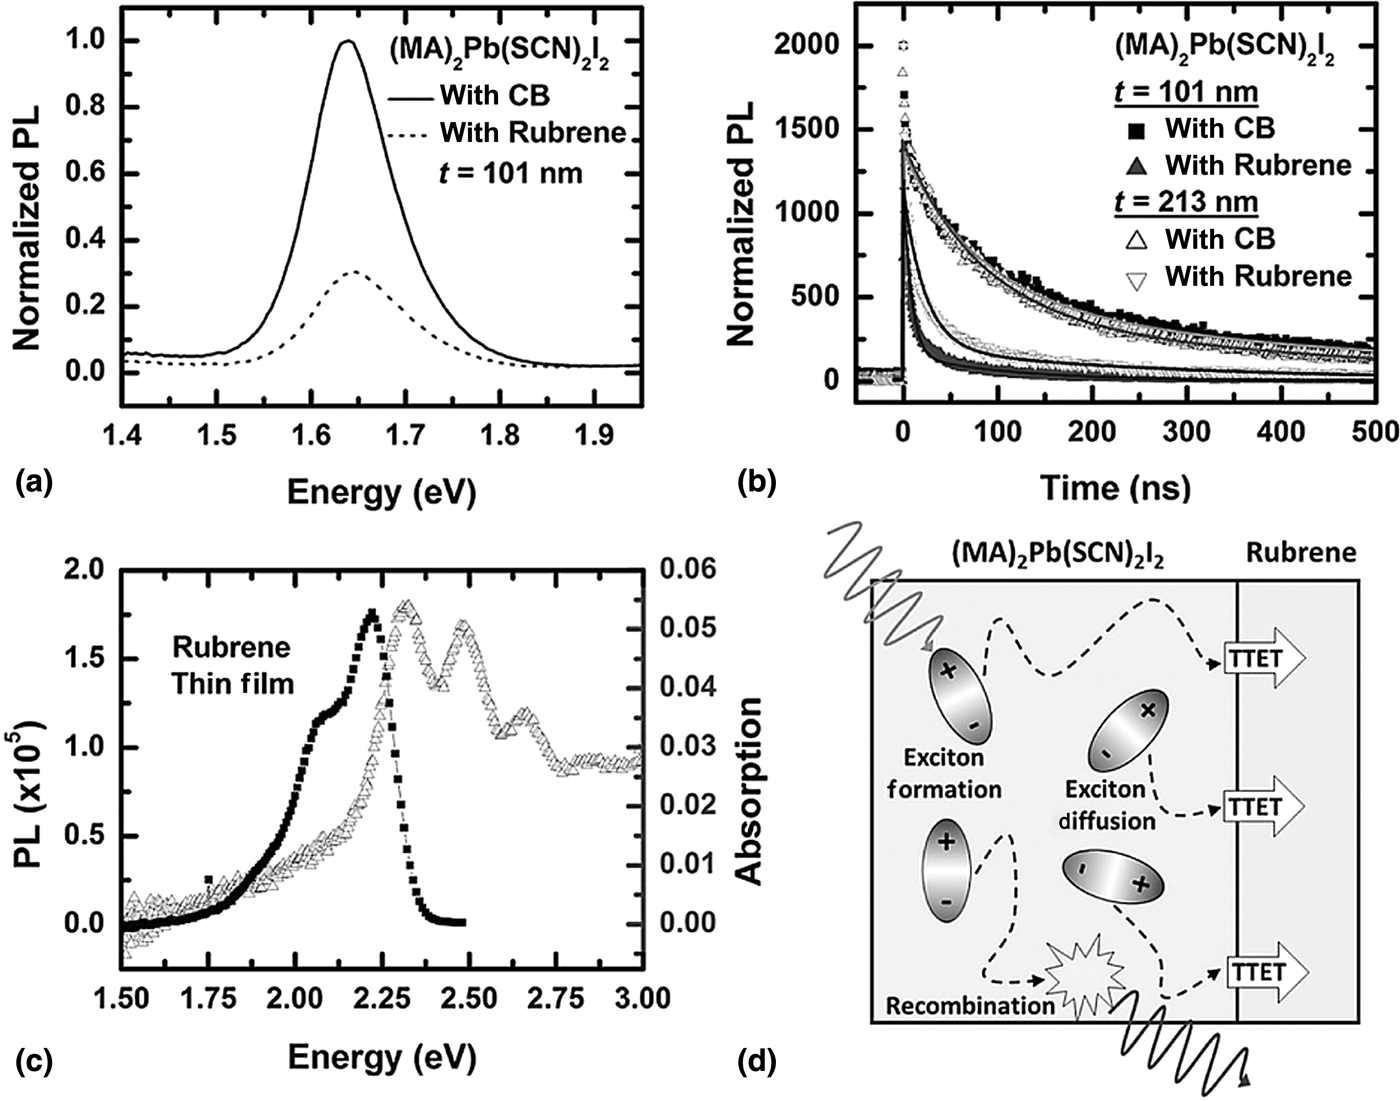
Excitonic TET to organic triplet acceptors has also been observed in a 2D perovskite thin-film material: (CH3NH3)2Pb(SCN)2I2, which exhibits strong PL from the triplet state.[Reference Younts, Duan, Gautam, Saparov, Liu, Mongin, Castellano, Mitzi and Gundogdu73] Figure 7(a) depicts the steady-state PL for the two investigated systems: (CH3NH3)2Pb(SCN)2I2 in the absence and presence of rubrene. PL quenching in the presence of rubrene, a common triplet acceptor,[Reference Nienhaus, Correa-Baena, Wieghold, Einzinger, Lin, Shulenberger, Klein, Wu, Bulović, Buonassisi, Baldo and Bawendi19,Reference Wieghold, Bieber, VanOrman, Daley, Leger, Correa-Baena and Nienhaus20 , Reference Singh-Rachford and Castellano41, Reference Mahboub, Maghsoudiganjeh, Pham, Huang and Tang60] was observed both in steady-state [Fig. 7(a)] and time-resolved measurements [Fig. 7(b)], indicating TTET from the perovskite to rubrene. A comparison of the quenching behavior [Fig. 7(b)] for two different perovskite film thicknesses, i.e., 101 and 213 nm, indicates an increased quenching for the thinner film. This led to the conclusion that the long-lived triplet excitons created in the perovskite film diffuse to the interface and then can efficiently transfer to the triplet acceptor (e.g., rubrene, perylene).
(a) Steady-state PL of 2D (MA)2Pb(SCN)2I2 with chlorobenzene (solid line) and with rubrene solution-cast from chlorobenzene (dotted line) added. (b) Time-resolved PL of (MA)2Pb(SCN)2I2 with chlorobenzene (dark squares for 101 nm film, open triangle for 213 nm film) and with rubrene (filled triangle for 101 nm film and upside-down open triangle for 213 nm film). (c) Absorption spectrum (gray) and steady-state PL (black) of rubrene under 485 nm excitation. (d) Schematic of triplet exciton diffusion across the perovskite film, leading to TTET at the interface of the perovskite/rubrene layers. Reproduced from Ref. [Reference Younts, Duan, Gautam, Saparov, Liu, Mongin, Castellano, Mitzi and Gundogdu73] with permission. Copyright 2016 John Wiley and Sons.

Beyond bound excitons—perovskite thin films
To overcome the limitations of NC-based devices, which as discussed previously, have been hindered in their advancement due to short exciton diffusion lengths, slow TET, and strong singlet reabsorption due to their broadband absorption, we investigate bulk materials as sensitizers. In the following, we will build on the previous paragraph of 2D perovskites and investigate the triplet sensitization by bulk perovskite-based materials. Perovskite and perovskite-inspired materials are currently heavily studied for use in PV applications. In these bulk perovskite materials such as methylammonium lead triiodide (MAPbI3) bulk films, bound excitons generally rapidly dissociate into free unbound free-charge carriers due to low exciton binding energies. In addition, high charge carrier diffusion lengths, long charge carrier lifetimes,[Reference Yang, Yang, Li, Crisp, Zhu and Beard74–Reference Miyata, Mitioglu, Plochocka, Portugall, Wang, Stranks, Snaith and Nicholas76] low nonradiative recombination,[Reference Tress77] and high absorbance in the visible and near IR make them promising for use as sensitizers in TTA-UC. While low exciton binding energies (on the order of kT) are favorable for PV applications, they offer uncharted waters in TTA-UC, as a triplet sensitization mechanism based on charge transfer must account for both the electron and hole injection from the sensitizer into the bound triplet state of the organic acceptor molecule. In contrast to a Dexter-type bound TET mechanism, the absolute energy levels of the sensitizer conduction band (CB) and valence band (VB) must be aligned with the triplet state of the annihilator. This geometry allows for energetically favored electron and hole transfer, without allowing for direct injection of the excited electron into the lowest unoccupied molecular orbital (LUMO) of the organic acceptor.[Reference Nienhaus, Correa-Baena, Wieghold, Einzinger, Lin, Shulenberger, Klein, Wu, Bulović, Buonassisi, Baldo and Bawendi19]
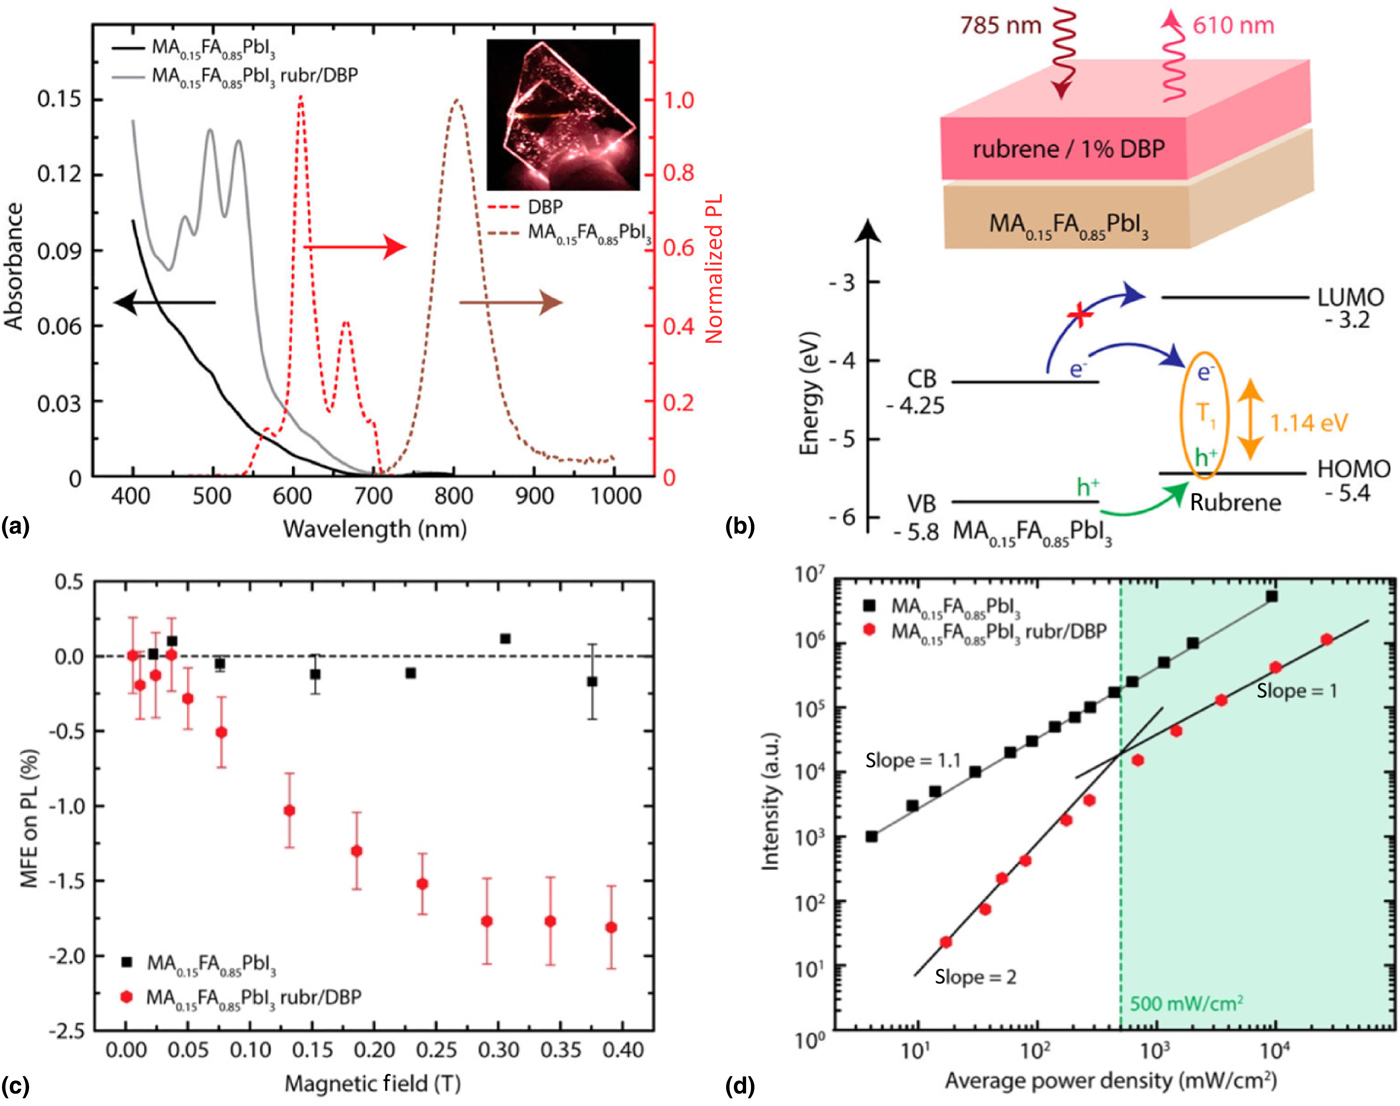
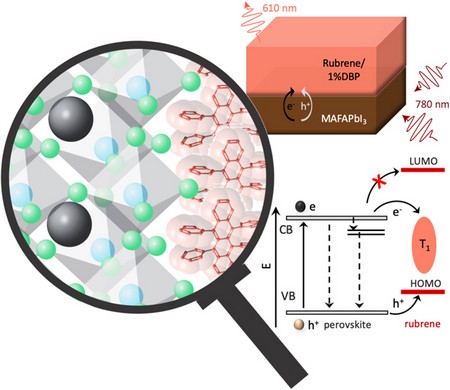
Bulk 3D-perovskite materials were first integrated into solid-state TTA-UC systems by Nienhaus et al.[Reference Nienhaus, Geva, Correa-Baena, Wu, Wieghold, Bulović, Voorhis, Baldo, Buonassisi and Bawendi78] to serve as a NIR-absorbing antenna to increase the absorbance of a solid-state PbS NC/rubrene system. Although the absorbance increased, the UC efficiency was not notably enhanced because of a competing pathway: singlet back-transfer to the perovskite reduced the visible light output of the device. Based on this report, a new UC system was designed by directly using the bulk perovskite as the sensitizer.[Reference Nienhaus, Correa-Baena, Wieghold, Einzinger, Lin, Shulenberger, Klein, Wu, Bulović, Buonassisi, Baldo and Bawendi19] A mixed cation lead iodide perovskite consisting of MA and formamidinium (FA) (MAFA) with a thickness of 14 nm is used as the sensitizer coupled to the annihilator/emitter rubrene doped with 1% DBP. Figure 8(a) highlights the optical absorption and emission properties of the bare perovskite film and the UC bilayer device in which the UC PL under 785 nm excitation is seen at ~610 nm (compare inset). The device structure is highlighted in the schematic in Fig. 8(b) on the top: MAFA is first spin-coated onto a glass substrate followed by a layer of solution-cast rubrene/DBP. The device absorbs incident 780 nm photons and subsequently emits at ~610 nm. The band diagram [Fig. 8(b), bottom] indicates that the energy band alignment is favorable for triplet sensitization by charge injection while disallowing direct electron injection into the LUMO of rubrene.
(a) Normalized absorption spectrum of the perovskite thin film (black) and the bilayer upconversion device (gray), consisting of the perovskite layer and a rubrene layer doped with 1% DBP, as well as steady-state PL of perovskite film emission (brown dotted line) and upconverted emission from the DBP (red dotted line). UC emission can be seen as an orange line when the device is exposed to a 785 nm laser, displayed in the figure inset. (b) UC device schematic, where, when under 785 nm excitation, emission at 610 nm from the DBP excited state occurs. Band energy diagram showing charge transfer from the perovskite to rubrene. The triplet state of rubrene is populated via hole extraction from the valence band (VB) of the perovskite, while the electron is extracted from the conduction band (CB) of the perovskite to the triplet state T 1 of rubrene. The mismatch in energy blocks direct injection of the electron to the LUMO of rubrene. (c) Magnetic field effect (MFE) on perovskite emission (black) and upconverted emission (red). (d) Power dependence of the perovskite emission (black) and the upconverted emission (red). The slope intersection denotes the I th of 500 mW/cm2. Adapted with permission from Ref. [Reference Nienhaus, Correa-Baena, Wieghold, Einzinger, Lin, Shulenberger, Klein, Wu, Bulović, Buonassisi, Baldo and Bawendi19]. Copyright 2019 American Chemical Society. https://doi.org/10.1021/acsenergylett.9b00283. Further permissions related to the material excerpted should be directed to the ACS.
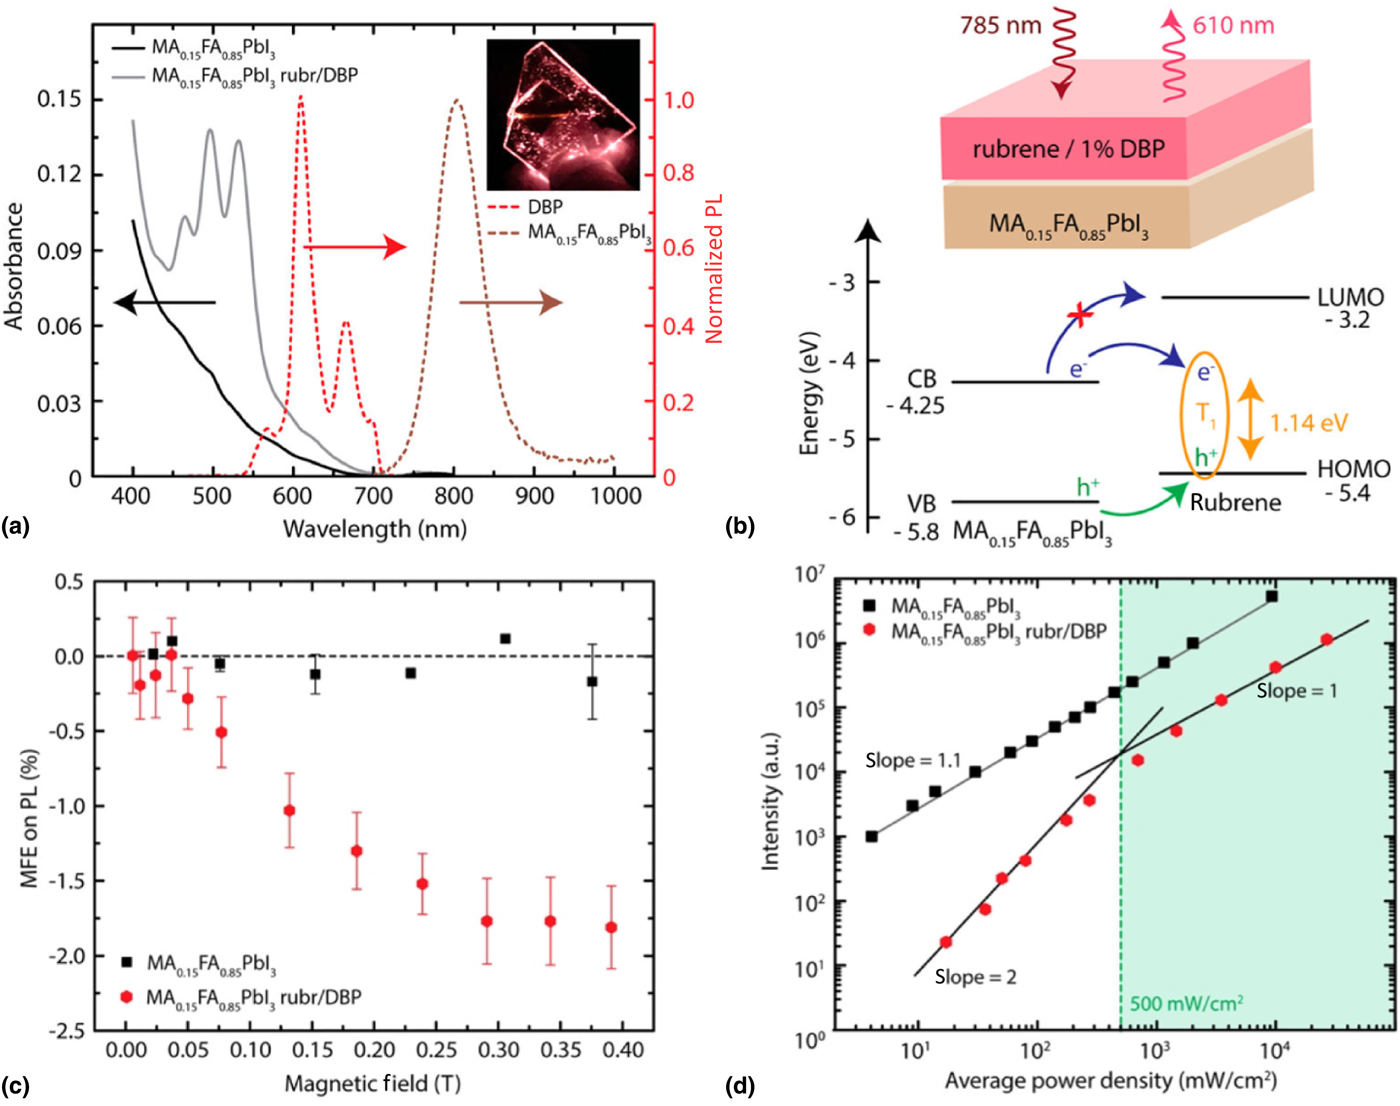
In order to ensure the visible light obtained from the UC device is indeed due to TTA and not due to a different mechanism, the magnetic field effect (MFE) was measured for the bare MAFA perovskite thin film and the UC bilayer device consisting of MAFA + rubrene/DBP. Figure 8(c) shows the change in the UC PL and MAFA PL as a function of the applied magnetic field confirming the typical nonmonotonic negative MFE signature of TTA.[Reference Reusswig, Congreve, Thompson and Baldo79]
To further support a TTA-based UC mechanism in the MAFA/rubrene system, the power dependency of the UC PL was examined. Figure 8(d) shows the PL intensity as a function of the incident average power density where the expected slope change from α = 2 to α = 1 is observed, further confirming the hypothesis of TTA. This slope change occurs at I th = 500 mW/cm2, which is ~20-fold lower than the lowest I th reported for a comparable device comprised of PbS NCs.[Reference Wu, Congreve, Wilson, Jean, Geva, Welborn, Van Voorhis, Bulović, Bawendi and Baldo28] However, due to the low NIR absorption of the 14 nm thin MAFA layer, only the external quantum efficiency of the UC process can accurately be determined at (1.5 ± 0.3) × 10–4 %. A conservative estimate of the internal UC efficiency yields η UC = 3.1%.[Reference Nienhaus, Correa-Baena, Wieghold, Einzinger, Lin, Shulenberger, Klein, Wu, Bulović, Buonassisi, Baldo and Bawendi19]
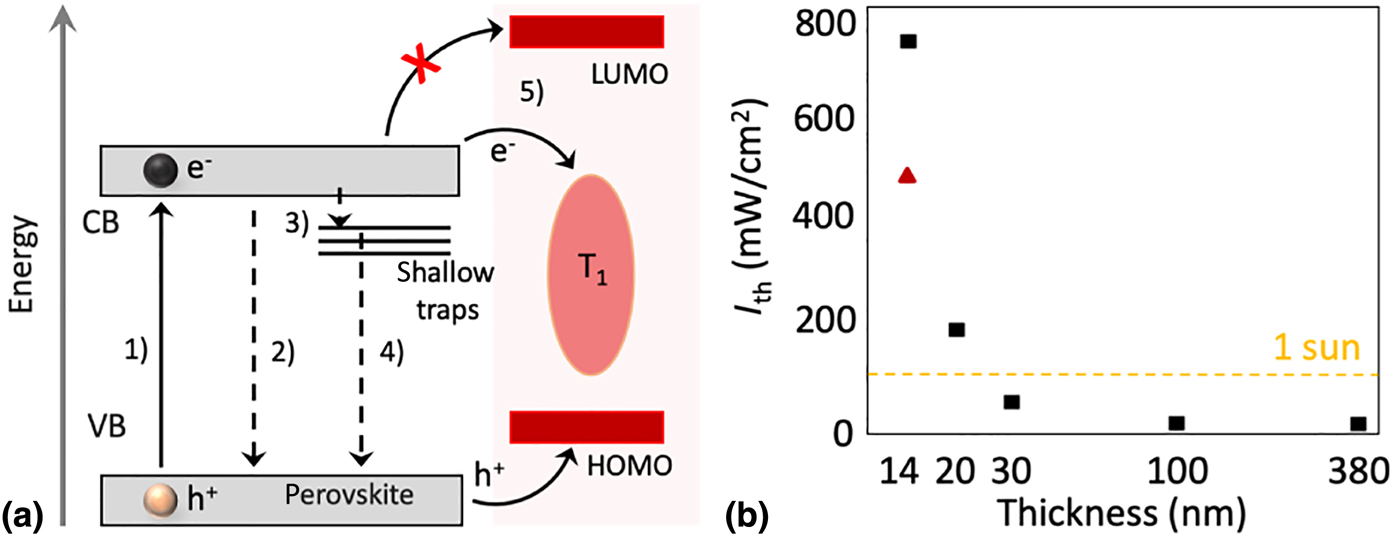
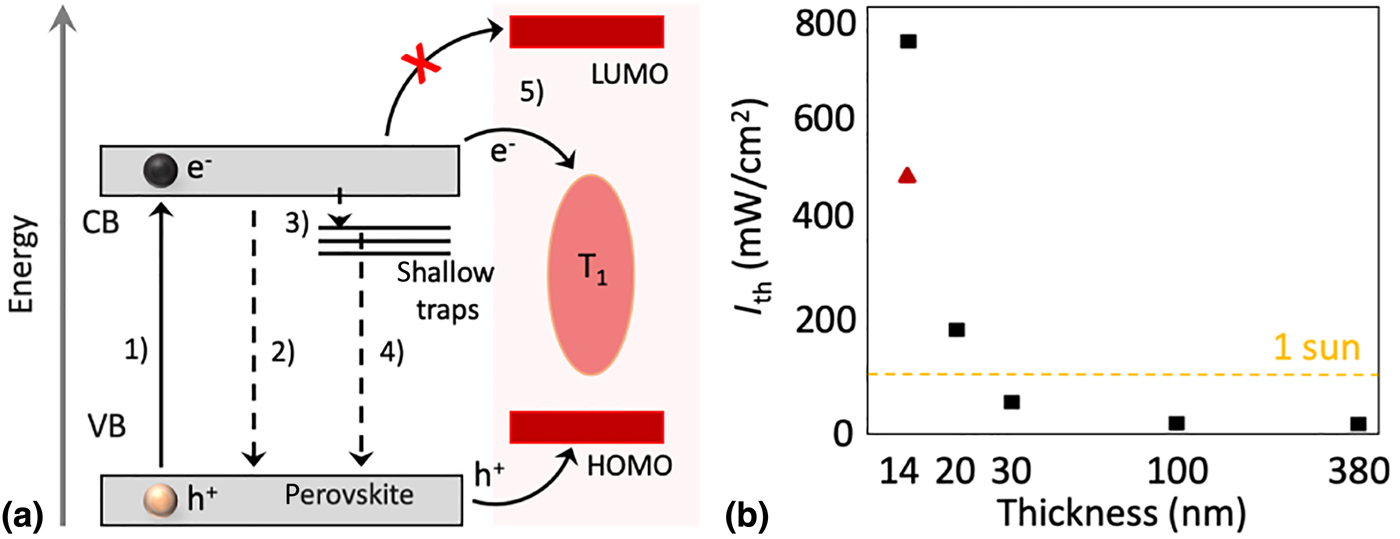
To boost the absorption of the perovskite thin film and also investigate the role of trap states on the UC process, the MAFA film thickness was modified.[Reference Wieghold, Bieber, VanOrman, Daley, Leger, Correa-Baena and Nienhaus20] Several main observations were made: (i) trap filling and charge transfer to rubrene compete [Fig. 9(a)]. (ii) The increased quality of thicker MAFA films resulting from larger grains and reduced trap sites translates into longer carrier lifetimes, which enables a more efficient charge transfer process and results in “sub-solar” I th values at thicknesses above 30 nm [Fig. 9(b)]. (iii) The expected slope change of α = 2 to α = 1 at the threshold intensity I th[Reference Cheng, Khoury, Clady, Tayebjee, Ekins-Daukes, Crossley and Schmidt36–Reference Monguzzi, Mezyk, Scotognella, Tubino and Meinardi38] shifts to follow the power-law dependence of the MAFA PL: I UCPL ~ Fβ = (I MAFA)2 = F 2α.[Reference Wieghold, Bieber, VanOrman, Daley, Leger, Correa-Baena and Nienhaus20] However, parasitic back-transfer of created singlets limits how thick the perovskite layer can be; despite a decrease in the I th value for the thickest MAFA film investigated (~380 nm), the visible light output was barely increased over the 100 nm thick film. This indicates there is a tradeoff in the absorption of the film and the visible light output of the UC device.[Reference Wieghold, Bieber, VanOrman, Daley, Leger, Correa-Baena and Nienhaus20]
(a) Processes occurring in the UC bilayer device upon excitation at 780 nm. (1) An electron is excited from the valence band to the conduction band in the perovskite film. This electron can be quenched by multiple possible pathways: (2) bimolecular free carrier recombination, (3) shallow trap filling, (4) monomolecular trap-assisted recombination, or (5) charge transfer to rubrene. Adapted from Ref. [Reference Wieghold, Bieber, VanOrman, Daley, Leger, Correa-Baena and Nienhaus20] Copyright 2019 with permission from Elsevier. (b) The I th of the MAFA/rub. devices as a function of their thicknesses. The device from Ref. [Reference Nienhaus, Correa-Baena, Wieghold, Einzinger, Lin, Shulenberger, Klein, Wu, Bulović, Buonassisi, Baldo and Bawendi19] is denoted by the red triangle, as it was measured with a pulsed excitation source. All others measured using continuous wave (CW) excitation.
In addition, two unexpected results have been reported in these MAFA + rubrene bilayer devices: (i) the occurrence of two rising components in the UC PL, as well as (ii) a photodarkening of the UC PL obtained from the device. To find the root cause of these effects, the role of triplet diffusion on perovskite-sensitized TTA in rubrene was investigated.[Reference Wieghold, Bieber, VanOrman and Nienhaus21]
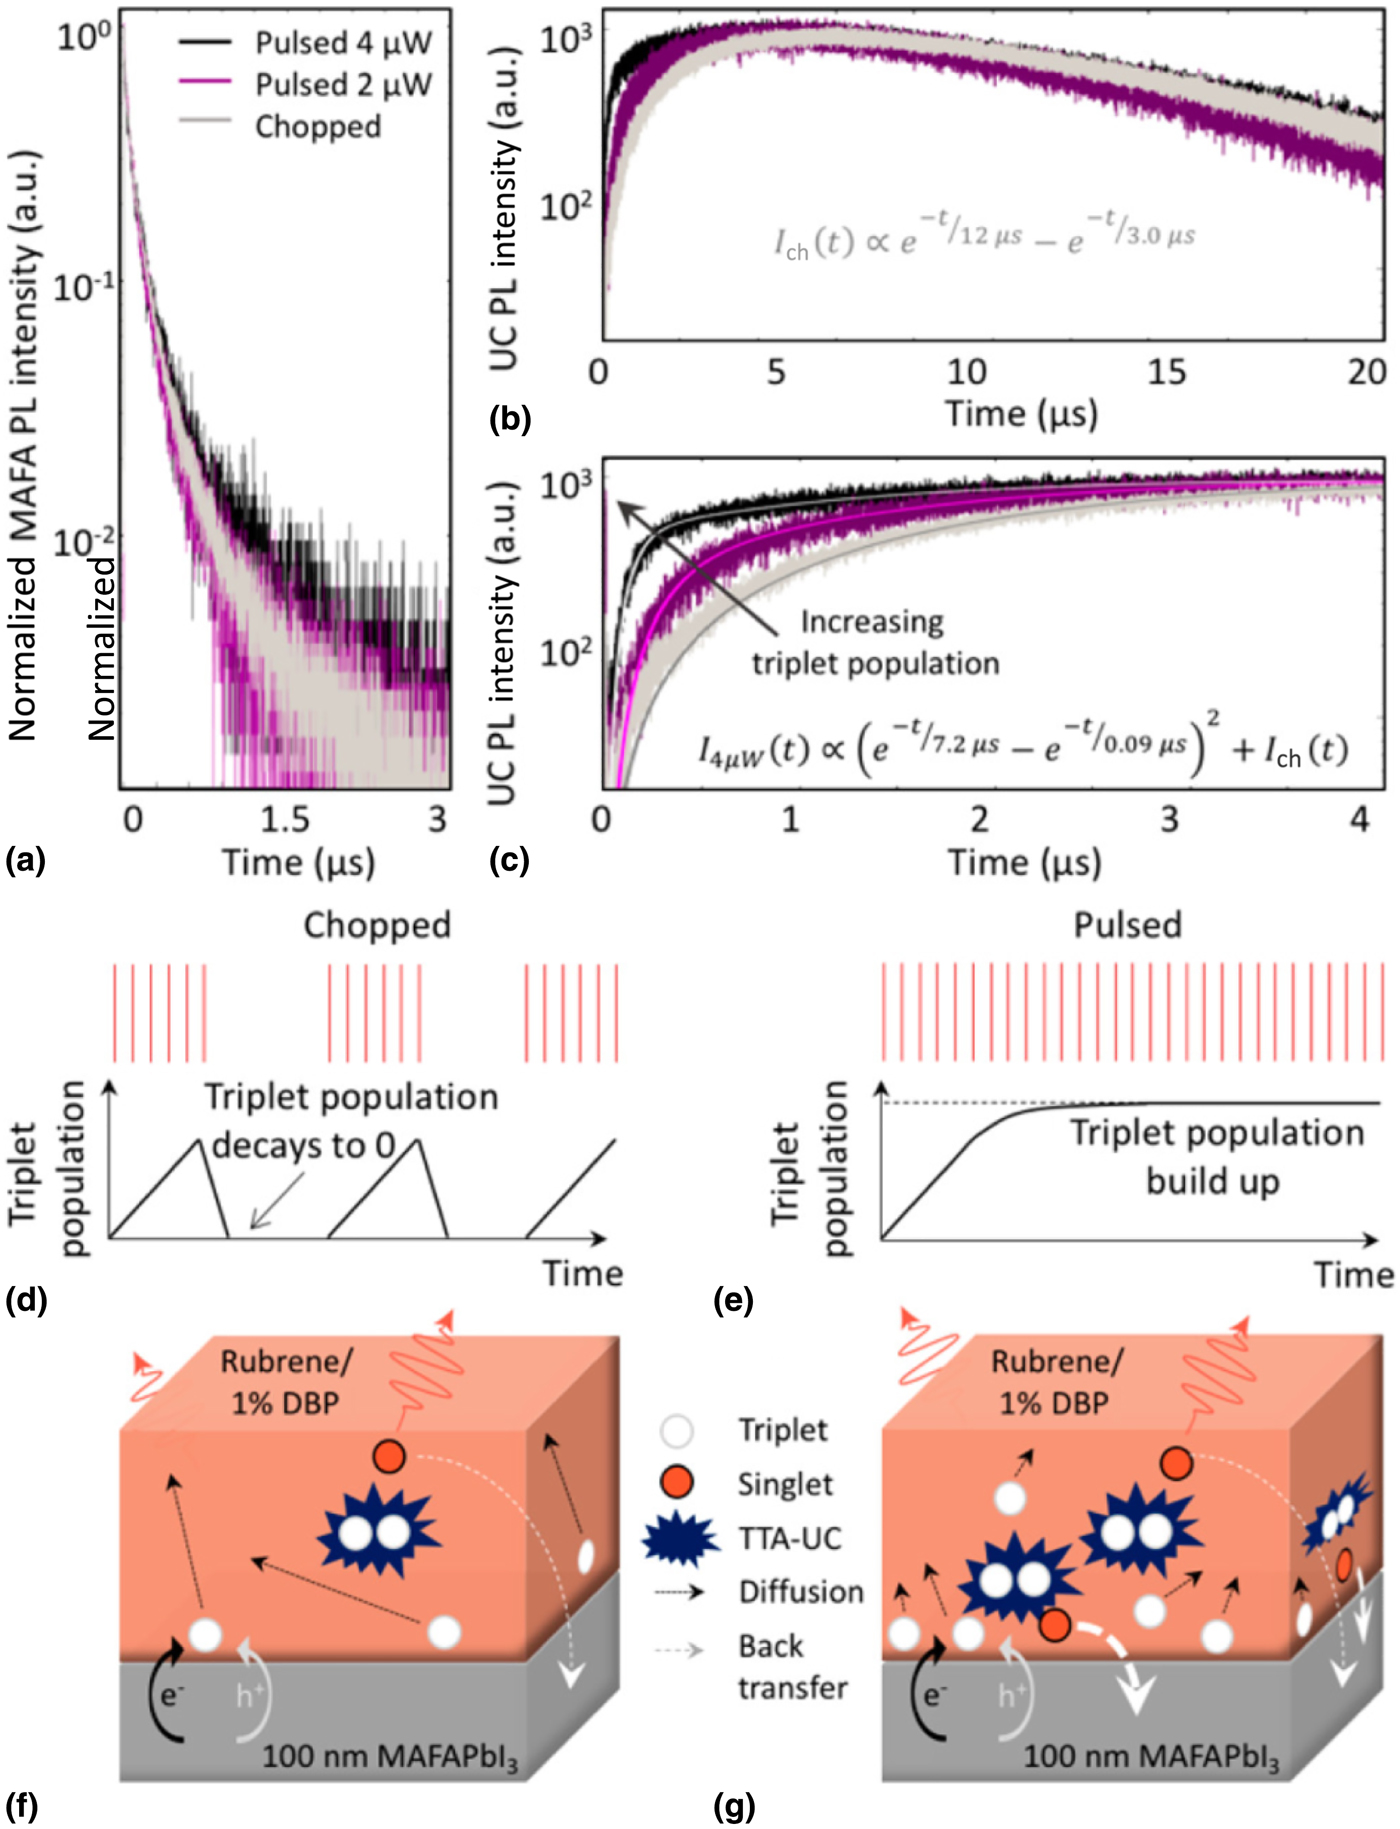
In diffusion-mediated TTA, triplets diffuse until finding another triplet state to annihilate with. The effective diffusion length of the triplet states in the annihilator will be dependent on the triplet population, as a higher triplet density will result in more frequent collisions. To modulate the triplet population, a 20 Hz mechanical chopper was introduced to allow the triplet population and potential long-lived trapped charge carriers in the perovskite sensitizer to fully relax. To discern whether the effects observed were caused by the MAFA sensitizer [Fig. 10(a)] or the rubrene/DBP annihilator/emitter pair [Figs. 10(b) and 10(c)], the PL dynamics were monitored under pulsed conditions (black), pulsed modulated conditions (gray), and pulsed conditions at half the average power (purple). As the MAFA PL decay does not show condition-dependent dynamics, the rubrene must be responsible for the unusual effects observed. As shown in Fig. 10(b) and in other perovskite-sensitized TTA systems,[Reference Nienhaus, Correa-Baena, Wieghold, Einzinger, Lin, Shulenberger, Klein, Wu, Bulović, Buonassisi, Baldo and Bawendi19,Reference Wieghold, Bieber, VanOrman, Daley, Leger, Correa-Baena and Nienhaus20] the UC PL under standard pulsed conditions (black) has three distinct regions: (1) a fast rise in the first few hundred nanoseconds, (2) a slower rise until ~5 µs, and (3) a gradual decay beyond 5 µs.
(a) MAFA PL lifetimes (>800 nm) as a result of incident power (4 µW in black, 2 µW in purple) as well as the addition of a chopper wheel (gray). (b) UC PL lifetimes (560–640 nm) monitored in the same manner as the MAFA PL lifetimes. (c) A zoomed-in view of (b), detailing the different rise times shown under the three measurement conditions. (d) A schematic showing the effect of a chopper with a 25 ms “off time” (time in between pulse) on the triplet population. (e) A schematic showing the triplet population increasing without decay with no “off time” from the laser. (f) Schematic detailing TTA as a result of slow triplet diffusion, where the triplet states have longer diffusion lengths due to relatively low triplet concentrations in the annihilator. (g) Schematic detailing TTA as a result of smaller triplet diffusion lengths and a larger concentration of triplet states. Back transfer of singlet states is more prevalent due to TTA occurring close to the sensitizer. Reprinted with permission from Ref. [Reference Wieghold, Bieber, VanOrman and Nienhaus21]. Copyright 2019 American Chemical Society. https://doi.org/10.1021/acs.jpclett.9b01526. Further permissions related to the material excerpted should be directed to the ACS.
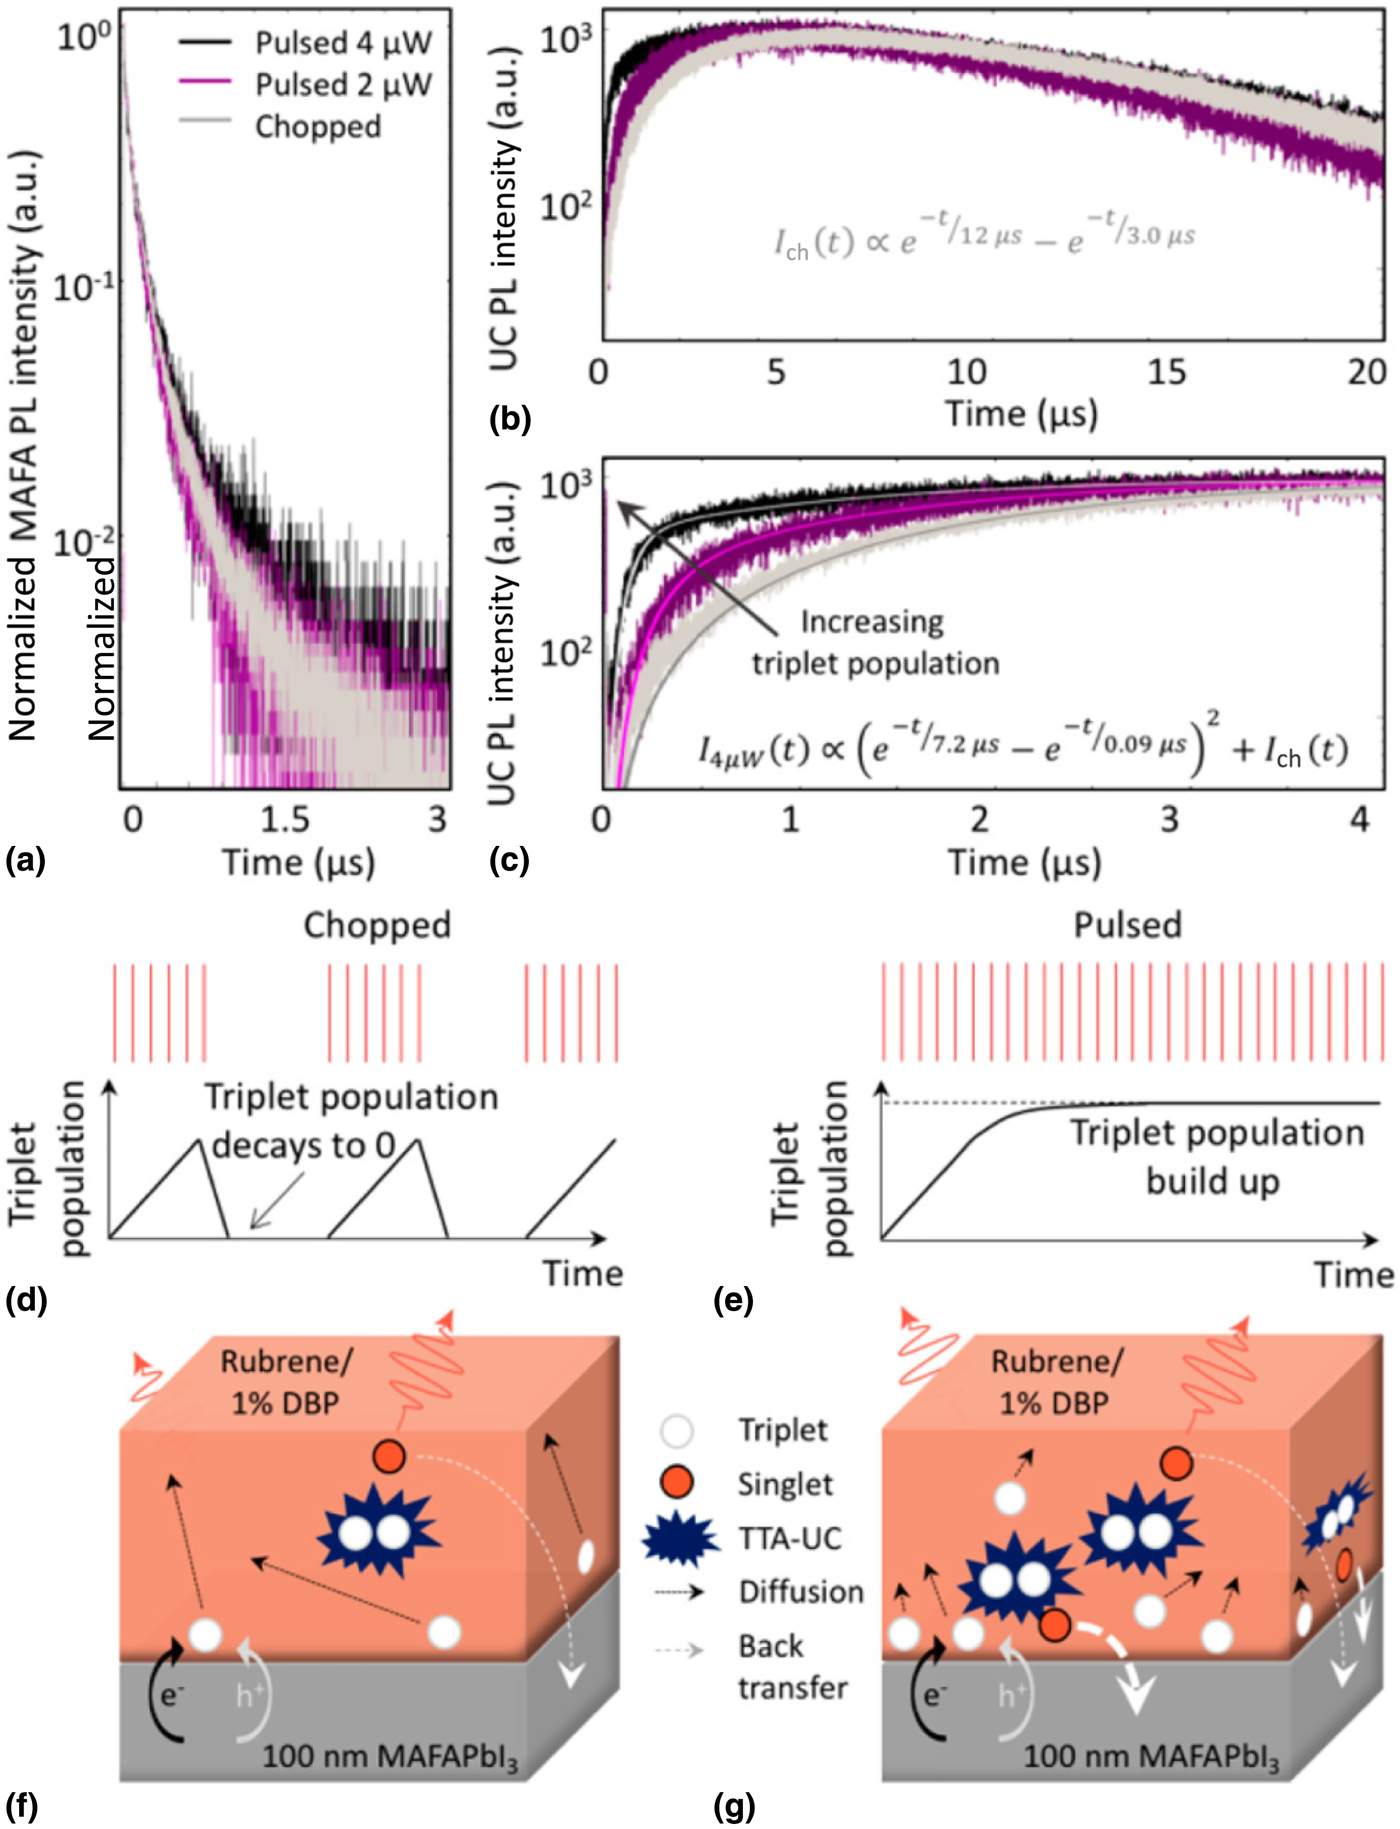
Clearly visible is a power dependence of the UC PL dynamics: the ratio of the fast and slow rises varies. Here, we refer to the schematics in Figs. 10(d) and 10(e), highlighting how the triplet population depends on the type of excitation. As established previously, the triplet diffusion length is dependent on the triplet population. With this fact, the underlying cause of the two rise times can be attributed to rapid TTA close to the interface due to a high triplet population (fast rise), while the slow rise stems from slow diffusion-mediated TTA far from the interface, compare Figs. 10(f) and 10(g).
The use of the mechanical chopper wheel was also found to increase the UC QY, as the triplets were allowed to diffuse far from the perovskite sensitizer layer before annihilating. In the case of low triplet diffusion, triplets annihilate near the sensitizer layer, which can lead to strong singlet back-transfer.
Outlook
We have highlighted several approaches to triplet sensitization for TTA-UC ranging from metal–organic complexes, inorganic NCs, and bulk lead-halide perovskites. These results indicate that triplet sensitization by direct free-carrier injection is a promising and broadly applicable pathway to more efficient TTA-UC, enabling real-world applications of UC devices in PVs. In particular, other bulk materials that have proper band alignment to directly transfer carriers into triplet states should be investigated. In particular, it would be of interest if the spin–orbit coupling is required in this sensitization route, or if it is independent. Additionally, reports indicate that transition metal dichalcogenides such as MoS2 can be utilized as triplet sensitizers, despite no current reports of using this avenue for TTA-UC.[Reference Kafle, Kattel, Lane, Wang, Zhao and Chan80,Reference Kafle, Kattel, Yao, Zereshki, Zhao and Chan81]
While the issue of low absorption of such UC devices has been able to be resolved by implementing bulk lead-halide perovskites with long free-carrier diffusion lengths as the triplet sensitizer, one major issue remains. Due to the overlap between the sensitizer absorbance and UC emission, the singlets created by UC are strongly far-field reabsorbed or back-transferred via efficient resonance energy transfer. There are several approaches possible to overcome this issue: (i) implementation of a triplet sensitizer with a defined absorption band that does not strongly overlap with the UC emission. (ii) A device structure which funnels the excitations away from the interface effectively, allowing for emission far from the strongly reabsorbing interface. We have previously shown that the triplet population level directly influences the UC emission obtained from the device, due to an increased rate of TTA close to the interface.
This indicates that further device optimization, in particular, tuning the relationship between the triplet sensitization rate and triplet diffusion rate, may be the key to unlocking the full potential of UC devices for applications in e.g., PVs.
Acknowledgments
The authors gratefully acknowledge Florida State University startup funds.