Introduction
Over the last two decades many applications and technologies based on spatial information have been developed for the agricultural market. Automated guidance systems for tractors as well as a wide range of soil and crop sensors to monitor differences of plants and soils are based on the use of positioning systems and remote sensing. All these technologies are part of the wide field of precision agriculture technologies (PAT) which were developed for fine scale agriculture to make it more efficient and adapted to heterogeneity of plant and soil. The application of fertilizer, seed rates, irrigation and plant protection can be managed according to the crop requirements to save input resources and make agriculture more sustainable.
The project FATIMA (“FArming Tools for external nutrient Inputs and water Management”) is focusing on the provision of timely information on the temporal and spatial variable crop input requirements with a focus on nitrogen management. Austria is one of the seven countries with a designated pilot area “Marchfeld” in Lower Austria. A large number of manufacturers in Austria provide technical solutions for variable nitrogen applications based on sensor measurements. They are all based on the same principle: a sensor is placed on the tractor and derives information about the chlorophyll content in the leaves, which is correlated to the concentration of nitrogen in the plant. The information is either directly connected with a fertilizer applicator (“online systems”) or first converted to a map which then can be used to variably distribute nitrogen fertilizer (“offline systems”).
The diversity of offered solutions in Austria is not reflected in uptake by users. Compared with other European countries like, Denmark (Fountas et al., Reference Fountas, Blackmore, Ess, Hawkins, Blumhoff, Lowenberg-Deboer and Sorensen2005) or the UK (Joint Research Centre (JRC) of the European Commission, 2014) the rate of adoption of PAT for nutrient management is low. There is no exact data available, but the number of farms using either online or offline N-sensors in Lower Austria is estimated to be less than 1%. This can be explained by an average farm size of 55 ha in the area. A survey among farmers in Germany showed that the incentives to use variable-rate technologies (VRT) below a farm size of 100 ha are low (Reichardt and Jürgens, Reference Reichardt and Jürgens2009). The main constraint for adoption is high cost (Busse et al., Reference Busse, Doernberg, Siebert, Kuntosch, Schwerdtner, König and Bokelmann2014; Kutter, Tiemann, Siebert, and Fountas, Reference Kutter, Tiemann, Siebert and Fountas2011; Nash, Korduan, and Bill, Reference Nash, Korduan and Bill2009) and uncertain economic benefits (Pannell, Reference Pannell2006). Therefore, an alternative approach to derive fertilizer recommendations based on satellite-based information, which is now affordable and with no maintenance or installation costs at the ground, could be suitable for the region and for a wider diffusion of the technology. Satellite-based maps can be used to respond to different needs (e.g. derive management zones) and they can be transferred to existing on-board navigation systems or ultimately integrated with controllers for automatic input management.
In this work, Sentinel-2A data, which is the newest generation Earth observation (EO) satellite of the European Space Agency (ESA), is used. The satellite was launched in June 2015 and is part of Europe’s Copernicus program aiming at independent and continued global observation capacities. Sentinel-2 offers 13 spectral bands from 10 to 60 m spatial resolution and data are available free-of-charge for research and commercial uses. Together with its twin satellite (to be launched beginning 2017), Sentinel-2 will cover the entire Earth every five days, which is suitable to map vegetation condition and changes. Using Sentinel-2 data and ground measurements acquired in the growing season 2015-16, our study aims at applying the concept of critical Nitrogen (N) concentration (Colnenne et al., Reference Colnenne, Meynard, Reau, Justes and Merrien1998) to obtained nitrogen recommendation via the N Nutrition Index (NNI) (Lemaire, Jeuffroy, and Gastal, Reference Lemaire, Jeuffroy and Gastal2008) and demonstrating it for an experimental plot with winter wheat (Triticum aestivum).
Materials and methods
Case study
The Austrian pilot area “Marchfeld” is located East of Vienna, in the Pannonian environmental zone (Metzger, Bunce, Jongman, Mucher, and Watkins, Reference Metzger, Bunce, Jongman, Mucher and Watkins2005) with low annual precipitation (530 mm), high evapotranspiration and slow groundwater recharge, with an average duration of dwell of 19 years (BMLFUW, 2012). The groundwater volume in the Marchfeld shows higher NO3 −-concentrations than the limit value of 50 mg l−1, with an increasing tendency (BMLFUW, 2012). The Marchfeld comprises of about 75000 ha of intensively used agricultural area with the most important crops being winter wheat, vegetables (e.g. onions, carrots, green peas, asparagus, spinach, green salad), sugar beet, grain maize and potatoes. In general, N fertilisation is done according to the N fertiliser recommendations, which are mainly based on standard values for individual crops (BMLFUW, 2006; Spiegel and Dersch, Reference Spiegel and Dersch2008). They were determined for the different arable (and grassland) crops on the basis of long-term field experiments under consideration of the plant nutrient removals. These standard values for the mineral N supply are specified according to the preceding crop, organic fertilisation and site specific yields. Furthermore, they may be varied due to selected soil characteristics (surface soil depth, texture, water conditions, coarse material) and the site specific potential N mineralisation, analysed with the anaerobic incubation method (Kandeler, Reference Kandeler1993; Keeney, Reference Keeney1982) or the total organic carbon (TOC, ÖNORM L 1080) content. These mineral N fertiliser recommendations may be adjusted with the Nmin soil test (ÖNORM L 1091) that determines plant available mineral nitrogen (nitrate and ammonium N) in the rooting zone (0–90 cm) in spring. However, a considerable working and organisational effort is necessary for taking the soil samples and organizing a cooled transport to the nearest laboratory. Thus, farmers rarely use this approach. More often, an improvement of fertilisation recommendations, especially for winter wheat, is possible with non-destructive leaf chlorophyll content measurements e.g. using the N-Tester (Yara International ASA), before the last (third) N fertilisation.
Experimental design and ground measurements
To develop and validate the satellite-based fertilization recommendation protocols, a field experiment with winter wheat and four different nitrogen (N) fertilisation rates (N0: 0 kg N; N1: 60 kg N; N2: 120 kg N; N3: 180 kg N) was conducted at the site “Engelhartstetten” located in the Marchfeld (Lower Austria) (48°11´N 16°55´E) in 2015/16. The soil type is classified as a Calcic Chernozem (IUSS, 2015) with 33.7% of clay, 48.7% of silt, and 17.6% of sand. On average, the soil had a pH of 7.54, 23.2% carbonate content, 23.6 g kg−1organic C and 2.43 g kg−1 total N in 0–25 cm. Mineral N was applied as calcium ammonium nitrate at three times (March 24th, April 21st, May 19th 2016). The field experiment consisted of a randomised block design with three replicates, the plots measuring 100 m x 100 m (1 ha) each. The design of the field experiment is given in Figure 1. Phosphorus and potassium fertilisation was done according to the Austrian guidelines for fertilisation (BMLFUW, 2006). Different soil and crop parameters were measured before, during and after the crop growing cycle. Destructive measurements at plant level included nitrogen content, fresh and dry weight performed at three different dates on April 7th and 28th, May 17th and post-harvest on July 26th. The final yield was also measured. Fresh weight of plant samples implied the weight with the original water content, dry matter content was determined by drying plant samples at 105°C for 48 hours and identifying the water content. The N concentration was determined by the Dumas Combustion Method (Dumas, Reference Dumas1831). Non-destructive measurements included the estimation of the leaf chlorophyll concentration (Chla+b) using a chlorophyll tester (N-Tester, Yara International ASA) and Leaf Area Index (LAI) using a Plant Canopy Analyser (LAI-2200, LI-COR, Lincoln, NE). All measurements were collected over a spatial extent that matches the spatial resolution of Sentinel-2 data (10 and 20 m pixel size) and georeferenced using a GPS device with an accuracy of about 5 m.
Scheme of the fertilisation experiment (N0: 0 kg N; N1: 60; N2: 120; N3: 180). Background image: Sentinel-2A LAI map acquired on 6th May 2016.

Satellite data
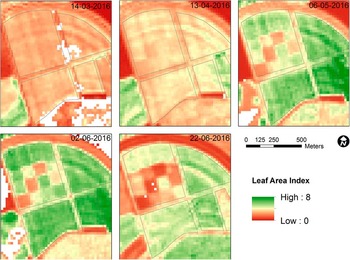
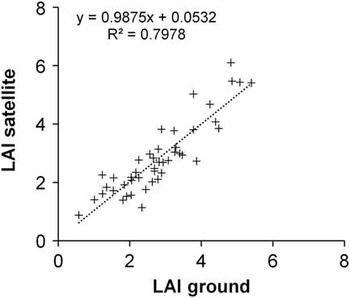
Sentinel-2 reflectance data were acquired throughout the crop growing cycle to estimate LAI and to calculate different N indexes. The image data were atmospherically corrected using the ESA Sen2Cor algorithm implemented at the BOKU processing facility for Sentinel-2 (Vuolo et al., Reference Vuolo, Żółtak, Pipitone, Zappa, Wenng, Immitzer and Atzberger2016). An example of LAI maps for key phenological phases of the experimental field is shown in Figure 2. To derive LAI, we employ a neural network (NNT) algorithm developed by INRA (Baret et al., Reference Baret, Weiss, Bicheron and Berthelot2010). The NNT algorithm was tailored for Sentinel-2 and trained using radiative transfer simulations from PROSPECT and SAIL radiative transfer models (Jacquemoud et al., Reference Jacquemoud, Verhoef, Baret, Bacour, Zarco-Tejada, Asner and Ustin2009; Verhoef, Reference Verhoef1984). LAI was validated using ground estimations. Results show a very good agreement (R2=0.83) and a RMSE of 0.32 m2/m2 (12% of mean value) (Vuolo et al., Reference Vuolo, Żółtak, Pipitone, Zappa, Wenng, Immitzer and Atzberger2016).
Sentinel-2 LAI maps of the experimental site. The impact of different fertilization rates are visible already in the LAI map acquired in April.

Methodological framework
The methodological framework selected for this study is based on the concept of critical N concentration (Justes et al., Reference Justes, Mary, Meynard, Machet and Thelier-Huche1994) to obtain the N recommendation via the N Nutrition Index (NNI) (Lemaire et al., Reference Lemaire, Jeuffroy and Gastal2008). This approach was initially based on ground measurements and recently tested and applied with remote sensing data by (Houlès et al., Reference Houlès, Guérif and Mary2007) and in a number of other studies (Cilia et al., Reference Cilia, Panigada, Rossini, Meroni, Busetto, Amaducci and Colombo2014; Vouillot et al., Reference Vouillot, Huet and Boissard1998). The main limitation of the approach is the need for extensive calibration to estimate the two input parameters required for the application of the NNI: the above ground dry mass accumulation (W) and the actual N concentration (%Na) at a specific growing stage.
Spectral vegetation indexes are traditionally used to estimate leaf chlorophyll concentration, which is related to N content (similarly to what the ground-based N-Tester is measuring) and to estimate LAI and above ground dry mass accumulation. Potentially, one should use vegetation indexes, or more sophisticated approaches, that are able to decouple the effect of one vegetation variable (e.g. leaf chlorophyll) from another (e.g. leaf area index) to maximize the information content. To estimate %Na, empirical relationships were tested between ground measurements of plant N and the Double-peak Canopy Nitrogen Index (DCNI) (Chen et al., Reference Chen, Haboudane, Tremblay, Wang, Vigneault and Li2010, Reference Chen, Wang, Huang, Tremblay, Ou and Zhang2013) and a second spectral index that combines the Modified Chlorophyll Absorption Ration Index (MCARI) with the Modified Triangular Vegetation Index 2 (MTVI2) in MCARI/MTVI2. Both indexes are known to be correlated with N content (Chen et al., Reference Chen, Wang, Huang, Tremblay, Ou and Zhang2013).
To estimate W, an empirical model was used that was developed using above-ground dry weight measurements and LAI estimates. In this study, LAI was both estimated at the ground and obtained from Sentinel-2 data using a Neural Network approach (Baret et al., Reference Baret, Weiss, Bicheron and Berthelot2010). This empirical relation to obtain W could be replaced with the Monteith´s equation (Monteith, Reference Monteith1972), or more complex crop models, that gives the potential daily dry weight increase as function of LAI, Photosynthetically Active Radiation (PAR) and two efficiency coefficients (interception and conversion of radiation).
The approach was tested using ground measurements performed at a central point of the 12 experimental plots (3 replicates of 4 fertilization rates). Although experimental relationships were obtained at three measurements dates, in this study we mainly report the results produced at the time of the last fertilization application for the winter wheat, which was applied on May 19th.
Results and Discussion
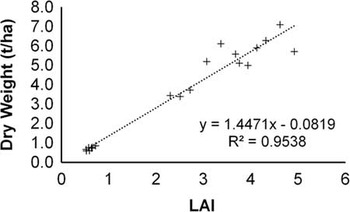
Figure 3 shows the correlation between LAI estimated and LAI derived from satellite for the winter wheat parcels for all measurements dates. Satellite-based LAI was then correlated to ground measurements of dry biomass to obtain an empirical relationship (Figure 4) used to estimate W at satellite.
LAI ground estimates vs LAI satellite estimates.

Satellite-based LAI vs dry weight measured at ground.

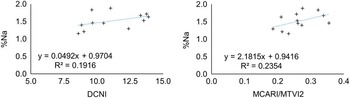
In a second step, to select the N index least correlated with LAI, a number of N indexes were studied in relation to LAI using a large dataset including 47 winter cereal plots that were identified during the field work in the region of interest. Several indexes were tested and two were finally selected. Figure 5 show the correlation obtained on May 23rd between DCNI, MCARI/MTVI2 and LAI, indicating these two indexes as potential candidates to estimate %Na. Using the measurements from the 12 experimental plots acquired on May 23rd, an empirical relationship between DCNI, MCARI/MTVI2 and %Na was derived (Figure 6). MCARI/MTVI2 show a slightly better correlation compared to DCNI.
Coefficient of Determination between LAI and two vegetative indices obtained on 23rd May 2016. The scatterplots include all pixels from 47 different winter cereal fields.

Relationships between the DCNI, MCARI/MTVI2 and %Na obtained on 23rd May 2016.

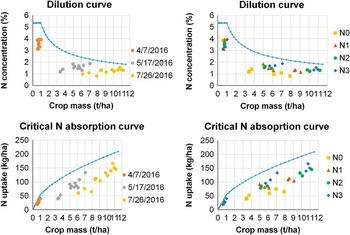
Finally, the experimental Nitrogen Dilution Curve (top Figure 7) was derived using the approach described in (Lemaire et al., Reference Lemaire, Jeuffroy and Gastal2008, eq.(2) and coefficients indicated in Table 1 for wheat). The critical N absorption curve (bottom Figure 7) was derived as the product of dry mass for the %Na. The measured %Na and dry mass for the 12 experimental plots are also plotted. The position of the points in respect to the experimental Nitrogen Dilution Curve indicates that all parcels were in N deficit. Different colours in the left charts indicate values measured during the three campaigns, while the right chart displays different colours for the 4 N fertilization rates. In general, we observe that lower N fertilization rates correspond to lower above-ground dry mass accumulation. For instance, N0 reaches a maximum final dry mass of about 8 t/ha, while treatments N2 and N3 reach a final mass between 10–11 t/ha. This corresponds to a N absorption of about 150 Kg/h for N2 and N3 (bottom Figure 7). Both the experimental Nitrogen Dilution Curve and the critical N absorption curve were taken from literature and will need to be calibrated and validated locally.
N dilution curve and critical N absorption curve for the 12 experimental plots based on ground measurements.

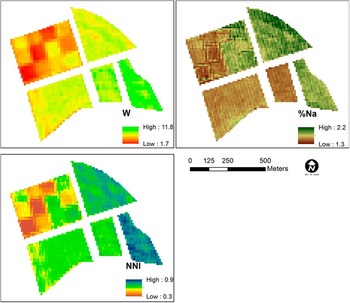
Using the empirical equations in Figure 4 (LAI – W) and Figure 6 (MCARI/MTVI2 - %Na) the above ground dry mass accumulation (W) and actual N concentration (%Na) were applied to produce the NNI map (Figure 8), which represent the ratio between %Na and the critical %Nc (blue line in figure 7, top). A NNI value lower than 1 indicates a deficit. Please note that results will need to be updated considering local data to obtain a locally validated critical N dilution curve %Nc.
Maps of dry mass accumulation (W), actual N concentration (%Na) and Nitrogen Nutrition Index (NNI) for the experimental site obtained on 23rd May 2016.

Conclusions
This study presented the preliminary results of the application of the Nitrogen Nutrition Index (NNI) to obtain maps of Nitrogen (N) fertilization recommendations using multi-spectral Sentinel-2 data for winter wheat in a pilot study in Austria. Leaf Area Index was used to estimate above ground dry mass accumulation and the MCARI/MTVI2 index to estimate %Na. LAI was very well correlated with the above ground dry mass (R2=0.95). A lower correlation was found between the MCARI/MTVI2 and %Na (R2=0.23). The two indexes showed no cross-correlation. The approach was applied to satellite and ground data acquired in an experimental setup using different rates of fertilizer in 2015/16. The experiment will be repeated and extended to actual production conditions in other fields in the growing season 2016/17 for winter wheat. Supported by a larger ground dataset, further research is needed to find other N indexes better correlated with %Na. Additionally, local data will be needed to obtain a locally validated critical N dilution curve to calculate the NNI.
Once the first step is achieved and consolidated, the next challenge is the transformation of the mapped nitrogen status of plants to recommendations for farmers (Reichardt and Jürgens, Reference Reichardt and Jürgens2009) and the compatibility with the tractor machinery. Other challenges are the lack of independent advisory services and expertise on precision agriculture, not quantified environmental benefits and a need for better knowledge on the causalities and determinants of yield (Joint Research Centre (JRC) of the European Commission, 2014). All these issues are being addressed in a larger framework of activities at European level within the context of the H2020 FATIMA project.
Acknowledgements
The studies were done within the project “FATIMA” (FArming Tools for external nutrient Inputs and water Management). This project has received funding from the European Union’s Horizon 2020 research and innovation programme (H2020-SFS2) under grant agreement No 633945.