Introduction
The national concept of innovation interprets the persistence of areas of industrial and technological strength and the presence of very specific institutional configurations in particular countries.Reference Freeman1–Reference Nelson7 Examples of such areas of industrial strength in Europe are the chemical, luxury car and machine tool industries in Germany. Thus, not only do the degrees of centralization, state intervention and the organization of universities and research institutes differ over countries, but these differences persist over time. What contributes to the specifically national character of the innovation system is the pattern of interactions between different institutions. These create institutional networks that communicate and interact and therefore define a system that may be specific for a country or for a region.Reference Porter8 National institutional settings have a major impact on how economic agents behave and firms perform.Reference Freeman9–Reference North12
The large variance between the countries in Europe might be explained to some extent by structural factors such as the varying share of R&D intensive sectors in these countries. Van WitteloostuijnReference van Witteloostuijn13 states that multidimensional diversity between countries within the EU may explain why the Union is performing below par. Even though labor costs may and do attract manufacturing investment to the newcomers, they are not in the vanguard of technology and research and development expenditure. The Central and Eastern European countries suffered from poor networks before and after transition.Reference von Tunzelmann and Nassehi14 In particular, since transition, new resources links have been dominated by multinational companies to which the CEE economies play the role of passive suppliers rather than true participants in the creative process while national systems of innovation in these countries have imploded. Next to this quite strong system-specific effect, numerous other factors significantly impact innovation performance: the country’s state of economic development, the level of education including training of researchers, the level and the institutional framework of financing academic research and industrial R&D, research financed by the military, and so on.Reference Kornai15
The national institutions shape not only the structural conditions of countries, but also their ability to respond to changes. This is even more prominent in the event of major economic downturns.Reference Fillippeti and Archibugi16 The 2008 financial crisis severely reduced the short-term willingness of companies to invest in innovation.Reference Archibugi and Filippetti17
Using the structural CDM model, the aim of this article is to determine the characteristics of the systems driving innovation and productivity in two separate groups of countries. The first group comprises selected countries from Central and Eastern Europe: Bulgaria, Croatia, the Czech Republic, Estonia, Hungary, Latvia, Romania, Slovakia and Slovenia and tries to find the reasons for their lower level of productivity and their lagging behind the productivity of the second group, which comprises the Western European countries Germany, Norway, Portugal and Spain. The article uses the recent version of the Community Innovation Survey (CIS10 – https://www.ec.europa.eu/eurostat/web/microdata/community-innovation-survey).
The article raises several questions: what is the main difference in the innovation system of two separate groups of countries in Europe? Also, what are the determinants of the decision a firm makes to innovate? Is there any progress in the innovation activity in the CEE countries? How can technology spillover be achieved? Has the increasingly large and complex Europe 2020 Strategy, focusing on the creation of an Innovation Union (as one of the seven flagships) caused some progress in the national innovation systems? What is the role of country-specific characteristics as determinants of firms’ innovation behavior in Europe in the period 2008–2010 at the first hit of the financial crisis?
The structure of the article is as follows. After this Introduction, the next section provides some background for the effects of the financial crisis on innovation activity in European countries. The section after presents an overview of the literature dealing with related aspects. In the fourth section, the econometric model we use is explained and the data used in the analysis are presented. In the fifth section the results obtained from the analysis are presented and interpreted. Finally, we offer a conclusion.
Background
Structural shifts driven by the financial crisis took place in the second and the third quarter of 2008 in most European countries.Reference Izsak, Markianidou, Lukach and Wastyn 18 Regarding general macroeconomic indicators, the countries most affected were the CEE countries. These are countries that had been catching up over the years 2006 to 2008 but that have relatively underdeveloped knowledge intensive industries. The crisis had a profound negative effect on both general and knowledge intensive sectors in most of these countries even though the downturn on firms’ investment in innovative activities was not of the same magnitude.Reference Fillippeti and Archibugi 16
According to CIS 2010, compared with CIS 2008, innovation expenditure in CEE countries declined considerably in 2008 and, with the exception of Estonia, did not fully recover in 2010. Innovation expenditure remained stable in the Western European countries though. These countries have stronger national innovation systems, and they were less affected, in relative terms, by the recession. These countries did not show any statistically significant indicators of structural changes as a result of the economic crisis in 2008. Germany in particular had strong economic fundamentals, a well-established innovation system and advanced sectorial specialization.Reference Izsak, Markianidou, Lukach and Wastyn 18
The challenge here is to raise productivity by intensive R&D engagement and innovation performance of the whole EU and close the productivity gap between CEE countries and Western European countries. Under the pressure of international competition and structural changes, enterprises need to be constantly innovative. In CEE countries this pressure is felt even stronger.Reference Nowotny 19 According to the Innovation Union Scoreboard (2010), some Central and Eastern European countries are considered to be growth innovation leaders with an average annual growth rate well above 5%. This convergence process, however, seems to be slowing down. There is a risk that the effects of the downturn will turn out to be structural, and as a result of the crisis at least some CEE countries will no longer be able to sustain the catching-up process they started before the recession.Reference Archibugi and Filippetti 17 The European CommissionReference Commission 20 suggests that the latter countries, facing budgetary restrictions, with the purpose of avoiding further widening of the innovation gap should focus on strengthening the framework conditions (such as: competition, skills and education, intellectual property rights, etc.).
There is still a wide labor productivity gap between Central and Eastern European countries and the strongest member states of the European Union, and most perform relatively poorly regarding labor productivity indicators. The average productivity level of the CEE countries is around 60% of the EU average. The drop in labor productivity per hour work in 2009 was higher in CEE countries than in Western European countries. On average, in 2009, CEE countries saw a decrease in their productivity level by 2.3 p.p., and Western European countries by 0.8 p.p. (Figure 1). The largest decline was in Slovenia (6.5 p.p.) and Croatia (6.4 p.p.). Estonia experienced a decline of 3.7 p.p. and Latvia of 8.8 p.p. in 2008 compared with the previous year, but both achieved positive growth rates in 2009.
Labor productivity (GDP per hour work), percentage change on previous period.

Literature Review
In today’s scientific literature, numerous theoretical contributions show the importance and determinants of innovation and how innovation output influences productivity. At a micro level, the role of innovative companies in modern economies has been emphasized. These companies that develop specific capabilities and are often included in corporate production networks, are characterized by higher rates of employment and output growth. At a macroeconomic level, innovation tends to contribute to the accumulation of capital and the growth of employment and multifactor productivity. 21 However, the relationship between research and development (R&D) expenditures, innovation and productivity is not straightforward.
In order to measure the role of innovation in productivity growth, we use the CDM model developed by Crepon et al.Reference Crépon, Duguet and Mairesse 22 This simultaneous equations model is used to estimate the relationship between the drivers of innovation and productivity. It directly links R&D engagement and intensity to innovation outcomes measured either as a process or as product innovation, and then estimates the effectiveness of the innovative effort leading to productivity gains. This model has been widely used in empirical literature dealing with developed countries.Reference Klomp and Van Leeuwen 23 – Reference Bessler and Bittelmeyer 32 Studies on developing countries mostly concentrate on Latin American countries (Chudnovsky et al.Reference Chudnovsky, López and Pupato 33 for Argentina, Benavente Reference Benavente 28 for Chile). The modelReference Crépon, Duguet and Mairesse 22 assumes the existence of full correlation between the error terms in all four stages of the innovation process. The model used in Lööf and HeshmatiReference Lööf and Heshmati 34 , Reference Lööf and Heshmati 35 is similar, but has replaced said assumption with one of partial correlation between the disturbance terms.
The four stages of innovation that we use in the model are divided into two parts. Full correlation is allowed between disturbance of the first and second equation, as well as between the third and fourth stage. This procedure differs from the original version of the multi-stage modelReference Crépon, Duguet and Mairesse 22 and is closer to the model proposed by Lööf and HesmatiReference Lööf and Heshmati 35 and Hashi and Stojčić.Reference Hashi and Stojčić 36 , Reference Stojčić and Hashi 37 A limited degree of correlation is allowed between the two parts of the model through the inclusion of the inverse Mills ratio in the innovation output equation similar to the model used in the latter studies. In addition, unlike previous studies that focused on product innovations, particularly revenues from new products, as a measure of innovation output, the CDM model adopted in this paper encompasses several types of innovations.
Duguet,Reference Duguet and Lelarge 38 Harrison et al.,Reference Harrison, Jaumandreu, Mairesse and Peters 39 and Hall et al.Reference Hall, Lotti and Mairesse 40 find that innovations contribute to productivity growth. The importance of product and process innovation varies across countries in different studies. Parisi et al.Reference Parisi, Schiantarelli and Sembenelli 27 determine a positive effect of process innovation on Italian firms, but not of product innovation. Polder et al.Reference Polder, van Leeuwen, Mohnen and Raymond 41 claim that product and process innovations affect productivity only if accompanied by organizational innovation in both services and manufacturing. Contrary to these studies, Roper et al.Reference Roper, Du and Love 42 find no significant effect of both types of innovation on productivity when using binary specification, and they even notice a significant negative effect for product innovation when using a continuous measure of innovation success in Ireland.
Stojčić and HashiReference Hashi and Stojčić 36 , Reference Stojčić and Hashi 37 investigate the impact of innovation on companies’ productivity across a number of East and West European countries, using company-level datasets from CIS06 and CIS08. Their results point to a gap in innovation behavior between companies from the mature market economies of Western Europe and those from new EU member states and candidate countries. The latter group of companies has a lower probability and fewer resources of becoming engaged in innovation activities and is therefore less successful in transforming innovation inputs into innovation outputs. The analysis is made on a European level and not by particular country.
Empirical literature dealing with post-transitional economies from Central and Eastern Europe (CEE) is rather scarce (Masso and VatherReference Masso and Vather 43 for Estonia; StoevskyReference Stoevsky 44 for Bulgaria; Domadenik et al.Reference Polona, Prasnikar and Svejnar 45 for Slovenia). The first attemptReference Tevdovski, Tosevska-Trpcevska and Disoska 46 was to estimate the links between R&D engagement, R&D intensity, innovation output, and productivity regarding the selected Central and Eastern European Countries – Bulgaria and Romania – and compare their performance with Germany. The empirical analysis was based on data from CIS 2008 and data were given by individual country. The results showed that different processes drive a company’s decision to engage in R&D in Bulgaria and Romania when compared with Germany; R&D intensity was an important factor of product innovation in the observed CEE countries; and product innovation led to higher productivity in Bulgaria and Romania, while process innovation led to higher productivity in Bulgaria, contrary to Romania.
Methodology
In order to estimate the relationship between the innovation activities and the output, we follow the multi-stage model proposed by Hashi and Stojčić.Reference Hashi and Stojčić 36 It is based on the standard CDM model.Reference Crépon, Duguet and Mairesse 22 In particular, the estimation procedure consists of two general stages which can be divided into two additional sub-stages.
In the first stage, we implement a Heckman correction model to explain the firm`s decision to engage (or not) in innovation activities. This stage can be explained with the following equations:
 $${\rm Prob}(d_i=1| x_i^0)={\rm \Phi}(\beta_0 x_{0i} )+u_{0i}$$
 $$w_i^* = \beta_1x_{1i} + u_{1i}$$
Equation (1) models the unobserved decision to innovate di of a firm i as a probit regression (with ϕ denoting the cumulative standard normal distribution) dependent on a vector x 0i of covariates and their parameter vector β 0.
We use the log of the firm size, market orientation variables, highly important factors hampering innovation, organizational and marketing innovations, and industry type as covariates.
With equation (2) we estimate the unobserved innovation input
 ${\it{w}}_{\it{i}}^{\rm{*}}$
using a vector x
1i
of covariates, weighted by parameters β
1 and adding the di
as an additional explanatory variable that helps us to ‘correct’ for the potential selection bias that arises due to using only data for firms that decided to invest in innovation.
As in the decision to innovate, in this equation, we use the log of the firm size, market orientation variables, highly important factors hampering innovation, organizational and marketing innovations, industry type, and additionally add access to subsidy variables as covariates. In equations (1) and (2) u 0i and u 1i represent error terms.
The second stage utilizes the three-stage least squares methodology to simultaneously estimate the innovation output and the productivity of the firm. This stage is specified as
 $${{{r}}_{{i}}} = {\beta _{{{{w}}^{\rm{*}}}}{w}}_{{i}}^{\rm{*}} + {\rm{}}{{{\beta }}_{{q}}}{{{q}}_{{i}}} + {{{\beta }}_2}{{{x}}_{2{{i}}}} + {{}}{{{u}}_{2{{i}}}}$$
 $${{{q}}_{{i}}} = {{}}{{\rm{\beta }}_{{r}}}{{{r}}_{{i}}} + {{}}{{\rm{\beta }}_3}{{{x}}_{3{{i}}}} + {{{u}}_{3{{i}}}}$$
In equation (3) ri
is the innovation input and u
2i
is the error term. In this equation we include the log of the firm size, the inverse Mills ratio (calculated from equation (1)), the highly important effects of innovation, the organizational and marketing innovations, the access to subsidies variables, the highly important sources of information about innovations as a vector x
2i
of exogenous explanatory variables with parameter β
2. This equation also includes the estimated innovation input
 $w_i^{\rm{*}$
with parameter β
w* as an explanatory variable and the productivity qi
as an endogenous variable. The error term is represented with u
2i
. Together with this equation we estimate equation (3) – the productivity qi
of the firm as a linear function of the innovation output ri
and a vector of exogenous explanatory variables x
3i
with parameter vector β
3. In this equation, we include the log of the firm size, the sources of product and process innovation, the organizational and marketing innovations, the factors hampering innovation and the industry type, as explanatory variables. As in the previous equations, u
3i
is the error term.
Data
The analysis is based on data provided by Eurostat in the Community Innovation Survey 2010 (CIS10). CIS10 represents a harmonized survey which aims to collect micro-data on innovation activities conducted between 2008 and 2010 in enterprises from EU member states and other countries. We focus on cross-sectional samples for two groups of countries: Central and Eastern Europe (CEEC) and ‘old’ European countries (WE). The sample of CEE countries includes firms from the following new EU members: Bulgaria, Croatia, the Czech Republic, Estonia, Hungary, Latvia, Romania, Slovakia and Slovenia. The WE sample includes firms from the following countries: Germany, Norway, Spain and Portugal. The CEEC sample contains 44,984 firms, while the WE sample contains 51,847 firms.
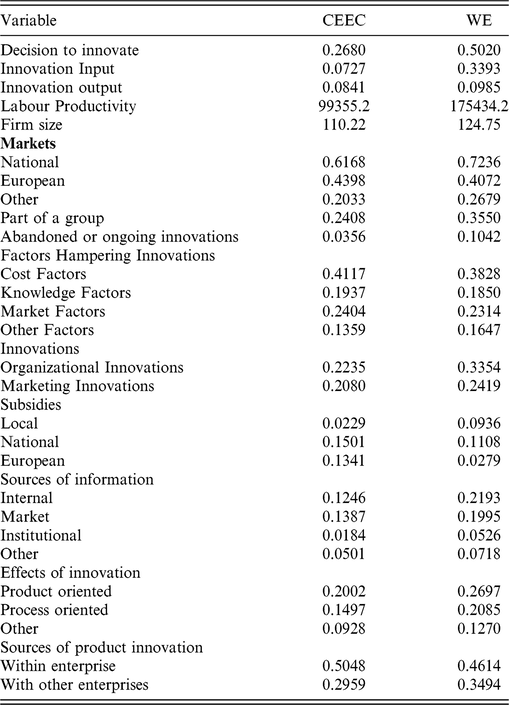
Table 1 presents the summary statistics of innovation and productivity variables. Turning to the most important issue, the proportion of firms reporting that they have engaged in some form of innovation activity is 26.8% in the CEECs sample, while in the WE sample it is almost double (50.2%). This is in line with the values of labor productivity in these countries as this is substantially higher in the WE sample in comparison with the CEECs sample.
Summary statistics (average values of the variables).

In addition, we want to note that CIS10 does not provide exact data on the number of employees in the firms; instead, the firms are grouped into six categories depending on whether they have less than 50, more than 50, between 50 and 249, more than 250 employees, between 250 and 499, and more than 500 employees. The lack of exact values of this variable creates an obstacle for our analysis since some of the other variables have to be scaled down to their ‘per employee’ counterparts to allow for adequate comparisons between the firms. To circumvent this problem, we approximate the number of employees in a firm by recoding the CIS10 employee variable as the average value of the interval in which the firm was stationed.
Interpretation of Results
In this section we report the results of the estimation procedure. The analysis was conducted for the companies from Central and Eastern Europe and Western Europe. For expositional convenience, the results for each stage of the innovation process will be presented in separate sub-sections.
Decision to Innovate
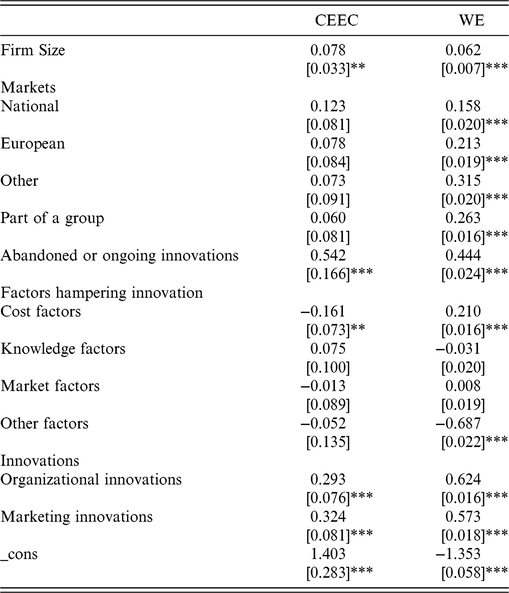
Table 2 presents the results of the estimation of the first stage for the two samples. The results are quite different between the two samples. This situation contrasts with the situation previously observed by Hashi and StojčićReference Hashi and Stojčić 36 when, on the basis of CIS4 data, the results were very similar for these countries There is one common result for both institutional settings: the probability for a typical firm to engage in innovation increases with the firm’s size. Other factors influencing the decision process are rather different.
Decision to innovate.

When it comes to the companies operating in Western European markets, their market orientation appears to be very significant for their decision to innovate. Firms oriented towards other foreign markets are most likely to innovate. The decision to innovate is also significant for those companies that are oriented towards the European market and their national markets, but the coefficients are smaller. On the contrary, market orientation as such appears not to be significant for the CEE companies.
Being part of the enterprise group and having previously abandoned innovation activities (work on these activities was underway during the reference period of 2008 to 2010, before the activities were abandoned or temporarily suspended) also increases the probability of deciding to innovate in the companies in Western Europe. For the firms operating in Central and Eastern Europe, having previously abandoned innovation activities appears to be significant for their decision to innovate. This suggests that knowledge accumulated through previous innovation activities motivates firms to engage in further innovations in both country groups. Regarding the companies in Western Europe, it is knowledge transfer from other parts of a group that has a positive influence on their decision to innovate.
A somewhat unexpected finding for the Western European companies is the positive and significant coefficient of the influence of cost factors, which should hamper the innovation process. These factors appear to have positive influence for the decision to innovate in Western Europe. As for the companies operating in Central and Eastern Europe, cost factors hampering innovation are less significant but logically have a negative influence on the decision to innovate. Knowledge factors, market factors and other factors hampering innovation do not have a significant influence on the decision of companies to innovate in both country settings.
Organizational and marketing innovations have a positive impact on the probability of the firm’s decision to engage in innovation in both samples of countries. This suggests that the probability to decide on innovation increases with the introduction of new business practices, new methods of organizing work responsibilities, new methods of organizing relations with clients and suppliers, changes in design and packaging of the product, or the introduction of new marketing promotion methods, new distribution methods or new pricing methods.
Innovation Input
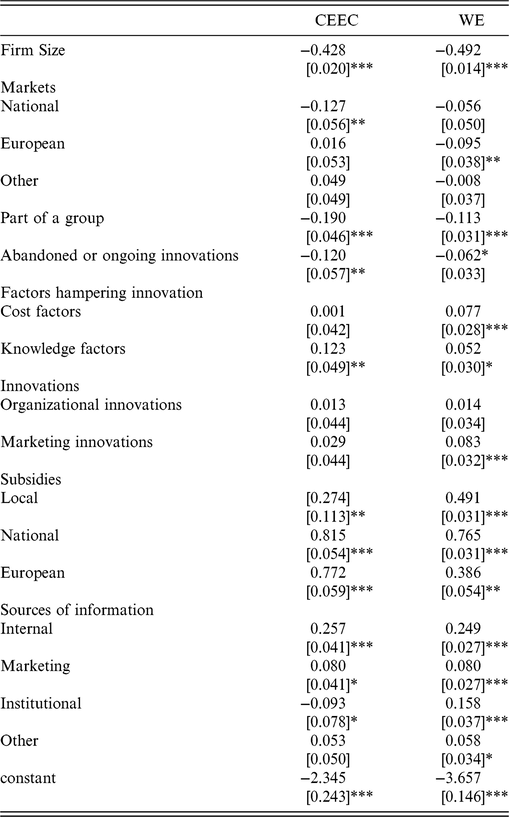
The results from the estimation of the innovation investment equation are presented in Table 3. Findings from both samples indicate quite unexpected results: innovation investment decreases with the firm’s size and the effects of size are quite similar in both regressions.
Innovation input.

The results are quite confusing regarding the effects of market orientation on the degree of innovation. The results bear negative signs for the countries in Western Europe, and orientation of companies towards the European market is statistically significant and decreases innovation. Orientation towards the national market of companies in Central and Eastern Europe has also influenced the decrease of innovation. This result can be explained as meaning that the domestic markets of these countries are not very demanding with respect to knowledge-intensive products. The results also show that the crisis period in both groups of countries influenced those companies that are part of an enterprise group or have abandoned or suspended innovation efforts to decrease innovation investments.
In terms of marketing and organizational innovations, only the coefficient for marketing innovations was highly significant and positive regarding countries in Western Europe. All other coefficients do not appear to be significant for companies’ innovation investments in both samples.
As opposed to the previous results, the results showing the influence of subsidies on innovation investment are statistically quite significant and positive, as was to be expected. For CEE companies, national and EU subsidies positively affect the innovation process, more so than do local subsidies. For companies operating in Western Europe, national and local subsidies have a higher positive influence than EU subsidies.
Finally, all sources of information about innovation exercise positive and significant influence on the companies operating in Western Europe. For the Central and Eastern Europe group, internal sources of information have a positive and significant influence on innovation, and market sources of information on innovation are less significant, but they do have positive influence. The influence from institutional sources of information even bears a negative mark, which can be explained by insufficient cooperation between companies and universities, private and public institutes and other institutions in these countries. In other words, the national institutional setting in CEE countries has a negative impact on a firm`s innovation performance.
Innovation Output
The third stage of the model consists only of firms that have reported a positive amount of innovation output. Therefore, we include the inverse Mill’s ratio calculated from the first equation to control for potential selectivity bias. The results of the estimation are presented in Table 4. The coefficient of the Mill’s ratio is statistically insignificant for the sample of Central and Eastern Europe, hence suggesting absence of selectivity.
Innovation output.

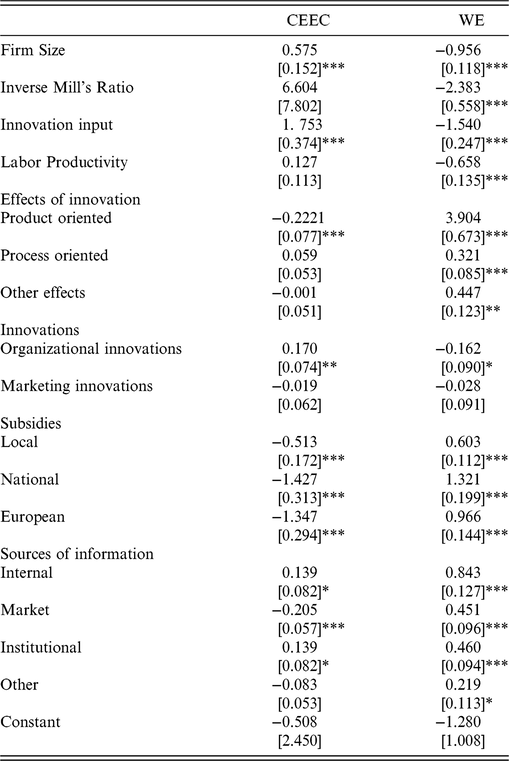
The coefficient of a firm’s size is positive and significant for the sample of Central and Eastern European companies, meaning that innovation output increases with the firm’s size. On the other hand, the same coefficient is negative and significant for the sample of Western European firms, indicating that a certain amount of innovation investment produces less output in larger firms than in smaller firms, or that smaller firms are more efficient in converting innovation input to innovation output.
We find a positive and statistically significant relationship between innovation input and output for the sample of Central and Eastern Europe. If innovation input increases by 1% then the share of innovation output in the firms’ turnover will increase by 1753%. This does not apply to the Western European countries as there the result is quite confusing in the sense of being both significant and negative. This means that innovation input in these countries has led to less innovation output. The findings with respect to a feedback effect from productivity to innovation output are in correlation with the previous findings for the sample of firms operating in Western Europe. The effect of productivity on innovation output is negative for the sample of firms in Western Europe. For the firms operating in Central and Eastern Europe, the influence of productivity on innovation output is insignificant.
Further, the results indicate that process and product innovation have a highly positive and significant effect on the transformation of innovation inputs into innovation output in the firms operating in Western European countries. For CEE companies process-oriented innovation does not have a statistically significant influence on innovation output, and product innovation has a significant but negative influence. This finding is quite strange and indicates that companies that have introduced new products to the market or new products to the firm have ended up with less innovation output. This notion can only be explained as recidivism from the influence of the economic crisis in these countries.
The results from the dummy variables for marketing and organizational innovations on the innovation output are also not very clear, as expected. Organizational innovations are significant and positive for the innovation output in Central and Eastern European companies, but less significant and with a negative effect for the firms in Western Europe. Marketing innovations, on the other hand, are not significant but the variables have negative coefficients for both samples of countries. One likely explanation for the results on marketing innovations is that these activities involve a considerable amount of financial means and the results are not visible in the short term.
With respect to subsidies we find a statistically significant and positive relation between all kinds of financial support for firms operating in Western Europe. For the CEE sample, we find a statistically significant influence of all types of support but the coefficient is negative. This means that more financial support for certain innovation activities has led to less innovation output. Given the positive effects of these variables on innovation investment, one can doubt the ability of the existing schemes for the allocation of subsidies at a local, national or EU level to facilitate innovation activities in Central and Eastern European countries.
As for the sources of information, we find a significant influence of all sources of information: internal, market, institutional, and a little less from other sources, on the innovation output in the Western Europe sample. For the firms in Central and Eastern Europe, we find a small significant and positive influence of internal and institutional sources of information and an insignificant but negative influence of market and other sources of information on innovation output.
Labor Productivity
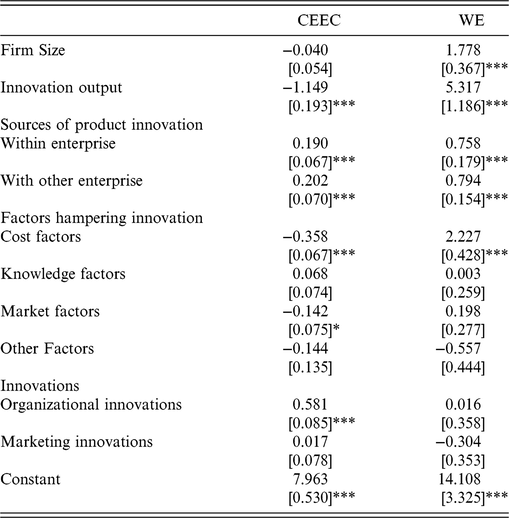
The results of the estimation of the fourth stage of the model are presented in Table 5. The table indicates that a firm’s productivity increases significantly with innovation output, but only regarding the firms operating in Western Europe. In this sample, the size of the firm also has a positive and significant influence on its productivity, meaning that the same level of innovation output has a larger impact on productivity in larger firms than in smaller firms. The results for the firms in Central and Eastern Europe, on the other hand, are quite opposite and can only be explained as a sign of the vulnerability of these countries’ national innovation systems when operating in periods of crises, as it indicates that a higher level of innovation output actually has led to less labor productivity. This means that companies that have introduced any kind of innovation, regardless of whether it concerns new or significantly improved products or services, new or significantly improved methods of production, new or significantly improved logistics, delivery or distribution systems, or any other kind of supporting activity have experienced a lower level of labor productivity.
Labor productivity.

With respect to the variables indicating sources of information, we find that the influence of innovations developed internally within the enterprise and of innovations developed in cooperation with other enterprises is statistically highly important and positive on productivity growth visible in both samples of firms. We also find highly positive effects of organizational innovations on productivity growth for the firms in Central and Eastern Europe. For the other sample of firms, organizational innovations are not important for productivity, the way marketing innovations are not important for the firms in Central and Eastern Europe. For the firms in Western Europe marketing innovations are not important but have a negative sign.
Finally, among factors hampering innovations, the results for the firms operating in Central and Eastern European markets seem logical. The coefficient shows that lack of funds and financing for innovation has a very important influence on the level of productivity. On the other hand, the statistically significant but positive influence of cost factors hampering innovations on labor productivity in Western European firms strikes us as rather strange. Other factors hampering innovation do not appear to be important and influential on the productivity level in both samples.
Conclusion
The goal of this paper is to pinpoint the differences between the drivers of the innovation systems and their influence on productivity growth between two different institutional settings in a period of financial and economic crisis in Europe. Although there is a large variance between the national innovation systems in the countries in Europe, we grouped them into two institutional settings according to their level of development.
From the results of the model, we can conclude that the varieties of the national innovation systems between the countries are reflected in large differences, discrepancies and sometimes unexpected results in both the innovation process and its influence on labor productivity growth. There is one common result regarding the two country settings: the probability for a typical firm to engage in innovation increases with the firm’s size. The other factors influencing the decision process are rather different.
The results from the estimation of the innovation investment equation are rather confusing. The findings from both samples yield the quite unexpected result that innovation investment decreases with a firm’s size; that the results are confusing regarding the effects of market orientation on the degree of innovation; and that being part of a larger group, or having abandoned or suspended innovation efforts, has decreased the innovation investments in the countries in both settings. The results pointing out the influence of the subsidies on innovation investment, on the other hand – and as was expected – are statistically significant and positive.
Further, the results indicate that process and product innovation have highly positive and significant effects on the transformation of innovation inputs into innovation output in firms operating in Western European countries. For the other sample, process-oriented innovation does not have a statistically significant influence on innovation output, and product innovation has significant but negative influence. The results from the dummy variables regarding marketing and organizational innovations are also unexpected. With respect to subsidies, we find statistically significant and positive relations between all kinds of financial support for the firms operating in Western Europe, but not for the other sample of companies, where the relations are statistically significant but negative.
The results of the estimation in the last phase indicate that a firm’s productivity increases significantly with innovation output, but only with the firms operating in Western Europe. The results regarding the firms in Central and Eastern Europe indicate that these countries’ national innovation systems are vulnerable and, in periods of crises, a higher level of innovation output led to lower labor productivity. With these results we confirm our assumption from the beginning of the paper that the systemic faults in the national innovation systems result in their unsustainability – as became especially visible in a period of crisis such as the period 2008–2010. Regarding the Western European countries, the financial and economic crisis did not have negative effects on their innovation systems as innovation activity there has resulted in higher levels of labor productivity. When it comes to the CEE countries, on the other hand, the effects of the crisis negatively influenced the innovation process, and labor productivity in general. In order to avoid a further widening of the productivity gap, CEE countries should focus on strengthening their institutional frameworks by increasing the cooperation between companies, universities and public institutions at both the national and EU level.
Acknowledgements
The anonymous data used in the analysis of this paper were obtained on CDROM from Eurostat as part of the research proposal ‘The role of innovation in productivity growth across selected Central and Eastern European countries: Closing the productivity gap between Eastern and Western Europe’. The results and the conclusions are given by the authors and represent their opinion and not necessarily those of Eurostat, the European Commission or any of the statistical authorities whose data have been used.
About the Authors
Katerina Toshevska-Trpchevska, PhD, is Associate Professor in the Department of International Trade, Faculty of Economics, of Ss. Cyril and Methodius University, Skopje. Her fields of research are international economics, the World Trade Organization, and trade facilitation.
Elena Makrevska Disoska, PhD, is Assistant Professor in the Department of International Trade, Faculty of Economics, of Ss. Cyril and Methodius University, Skopje. Her fields of research are international economics and European economic integration.
Dragan Tevdovski, PhD, is current Minister of Finance in the Government of the Republic of Northern Macedonia. Before being elected, Dragan Tevdovski was Associate Professor at the Faculty of Economics, Ss. Cyril and Methodius University. His primary research interests include applied econometrics, macroeconomic policy and labor markets. He won the award of best scientist at Ss. Cyril and Methodius University in the field of the social sciences in 2015.
Viktor Stojkoski, MSc, received a BSc degree in Economics in 2015, and an MSc degree in Statistics in 2016, both from Ss. Cyril and Methodius University. Since 2015, he has been working as a junior researcher at the Center for Computer Science and Information Technologies at the Macedonian Academy of Sciences and Arts (MASA), where he studies the dynamics of social systems and patterns in complex networks.