Introduction
Since their rediscovery by Jackson (Reference Jackson1987), the Home Owners’ Loan Corporation’s (HOLC) 1930s City Survey maps, which graded urban neighborhoods according to perceived lending risk, have become infamous. While the maps did not, as Jackson presumed, guide subsequent public and private lending practices, the maps are valuable to historians because HOLC staff based them on observation of already existing lending practices, as gleaned from interviews with local lenders and realtors (Gioielli Reference Gioielli2022; Markley Reference Markley2024). As such, the HOLC maps offer vivid illustrations of the geography of Depression-era “redlining”: the differential handling of loans according to the neighborhood where properties are located, regardless of the individual qualifications of the borrower. Historians have used the HOLC maps to explore the racial and ethnic demographics of historically redlined areas, finding that nearly all African-American areas saw the most unfavorable lending practices, as indicated by the HOLC’s conferral of a D grade (Jackson Reference Jackson1987, Winling and Michney Reference Winling and Michney2021). Numerous studies have furthermore revealed statistically significant relationships between various twenty-first-century socioeconomic and environmental disparities and the mid-twentieth-century geography of redlining that the maps recorded, pointing to redlining as a factor in the divergent experiences of many white and African American neighborhoods in the long term (Appel and Nickerson Reference Appel and Nickerson2016; Krimmel Reference Krimmel2018; An, Orlando, and Rodnyansky Reference An, Orlando and Rodnyansky2019; McClure et al. Reference McClure, Feinstein, Cordoba, Douglas, Emch, Robinson, Galea and Aiello2019; Aaronson et al. Reference Aaronson, Faber, Hartley, Mazumder and Sharkey2020; Faber Reference Faber2020; Krieger et al. Reference Krieger, Van Wye, Huynh, Waterman, Maduro, Li, Gwynn, Barbot and Bassett2020; Wilson Reference Wilson2020; Aaronson, Hartley, and Mazumder Reference Aaronson, Hartley and Mazumder2021).
What, if any, was the relationship between the Depression-era geography of redlining, as shown on the HOLC maps, and the change in neighborhood socioeconomic and housing characteristics in the shorter term? Here we detail a case study of the creation of the HOLC City Survey map and subsequent neighborhood change in Charlotte, North Carolina, from 1940 to 1960, using archival research, block data from the US Censuses of Housing, and statistical analysis. The examination of this early period offers a chance to understand the relationship between redlining and neighborhood change before the extremely disruptive factors of urban renewal and highway building came into play. Both of these endeavors involved wholesale clearance of numerous unfavorably graded areas in Charlotte, but for the most part they had not begun before 1960. Because it is in the US South, Charlotte’s history can also speak more directly to the African American experience of redlining and neighborhood change (Morris and Monroe Reference Morris and Monroe2009). At this time in the city’s history, virtually all of the population was either white or African American, very few were foreign born, and the great majority of the city’s most unfavorably graded neighborhoods were overwhelmingly African American (US Bureau of the Census 1943b, 375; US Bureau of the Census 1961b, 35–59).
We find that when HOLC officials arrived in Charlotte, they encountered an uneven geography of lending practices, indicative of redlining, and that this geography persisted as the Federal Housing Administration’s (FHA) role in local lending became established. Notably, while the HOLC clearly intended to capture all of the city’s African American neighborhoods within D-graded areas, fuzzy racial boundaries and some mixing meant that a substantial amount of this population remained outside of these areas in 1940.
Using an OLS model, we find that areas graded D became more populated by African American households and households paying higher rents for a supply of rental units with poorer facilities relative to areas receiving other grades. Using hotspot analysis, we also show that there was more spatial clustering of African American households, significant increases in rent, and poorer housing quality in D-graded areas over time. Increasing segregation was an ongoing phenomenon in twentieth-century Charlotte, but the significant relationships that we detect between the HOLC maps and neighborhood change, along with our review of a number of postwar FHA housing analyses, lead us to theorize that the neighborhood biases of lenders, as recorded by the HOLC maps, were contributing to increasing differences between neighborhoods in this period. Perceived disparities were contributing to hardening disparities in reality.
The HOLC maps and redlining
At the time the HOLC City Survey maps were made, financing terms varied markedly from neighborhood to neighborhood in US cities. The race and national origin of neighborhood residents informed lenders’ perceptions in large part; a major Civil Works Administration financial survey of housing in Atlanta, for example, found the highest interest rates in low-income and African American majority areas, and the lowest rates in high-income and white areas (Wickens Reference Wickens1937, 780–784). Throughout the early to mid-twentieth century, lenders held areas with a heavy immigrant or African American presence to be places where they would either not provide mortgages or only do so on unfavorable terms for builders and buyers. In the context of African Americans’ rural-to-urban migration, immigration from southern and eastern Europe, rampant prejudice among Anglo-Americans, and Anglo-American dominance of the consumer market, such discriminatory real estate practices were simply considered good, ethically upright business in the service of reducing risk (NAREB 1924; Architectural Forum 1938; Hillier Reference Hillier2003a, Light Reference Light2011).
When the Great Depression drove home values down and caused millions of households to default on their mortgages, the federal government became active in lending. The US Congress created the HOLC in 1933, under the oversight of the new Federal Home Loan Bank Board (FHLBB), to oversee emergency home mortgage refinancing. Then, in 1934, Congress created the FHA to insure longer-term amortized loans that would expand the accessibility of home ownership. Subsequently, the HOLC provided new loans to over a million households that had defaulted on their mortgages. Whatever prevalent bias existed in the real estate industry at the time, there is little evidence to support the notion that the HOLC was biased in these emergency lending practices; one study of the HOLC’s lending in Philadelphia found that the share of loans made to African American households matched or exceeded the share of the general population that was African American (Hillier Reference Hillier2003b).
At the same time, HOLC leadership assumed that the crisis was in part due to a lack of good data on the relative risk of lending in different neighborhoods (Architectural Forum 1938). The HOLC initiated its City Survey in 1935, after it had completed the vast majority of its lending efforts, in order to better understand local mortgage practices and establish policies on the collection of its own loans, resulting in “detailed and highly professional credit reports on the real estate and the mortgage lending markets” in 239 US cities (Architectural Forum 1938, 179; Fishback et al. Reference Fishback, LaVoice, Shertzer and Walsh2023). Local HOLC appraisers ranked neighborhoods’ security for long-term mortgage financing with one of four grades, with A being the most favorable and D the most unfavorable. Grades were based upon the staffers’ interpretation of what constituted “desirability” for the average housing consumer, following from the input of major local lenders and realtors (Architectural Forum 1938, 180).
Local HOLC field agents noted the presence or lack of local amenities and facilities, the professions and incomes of local residents, and any presence of foreign-born or African American residents. They noted the age and type of residences, their average condition, the share of land occupied by dwellings and share of dwellings occupied by homeowners, recent sale and rental values, and the availability of mortgage funds for buyers and builders. Notably, while not all neighborhoods given a D grade were predominantly African American, appraisers did give all African American neighborhoods, nearly without exception, a D grade; one study has found that 95 percent of African American homeowners in nine of the largest US cities lived in D-graded areas (Fishback et al. Reference Fishback, LaVoice, Shertzer and Walsh2023). Such ranking practices occurred despite evidence from some cities that many households in D-graded areas featured excellent records of mortgage repayment. Whatever the HOLC’s emphasis on standardization, dependence on local input did produce a small number of exceptions to the overwhelming pattern, including the singular example of an A-rated African American neighborhood in Savannah, Georgia (Winling and Michney Reference Winling and Michney2021). Fishback et al. (Reference Fishback, LaVoice, Shertzer and Walsh2023) have found evidence that the HOLC’s treatment of African American areas was only indirectly a product of discrimination – that, because African-Americans had for so long faced prejudice, discrimination, and poor housing conditions, the HOLC’s ranking of African American areas was mostly attributable to other neighborhood characteristics.
The HOLC maps were shared among federal agencies, including the FHA and the US Housing Authority. But because the FHLBB wished to protect the identity of local consultants who aided in creating the HOLC maps, the maps were not shared with local lenders, appraisers, or realtors as a matter of official policy (Hillier Reference Hillier2003a; Winling and Michney Reference Winling and Michney2021; Woods Reference Woods2012). The FHLBB explained the HOLC’s appraisal standards in its Federal Home Loan Bank Review and other publications, likely with the expectation that financial institutions would adopt their own practices of neighborhood appraisal in making lending decisions, but the HOLC maps themselves were not widely shared in major real estate journals or elsewhere, compromising Jackson’s assertion of their influence (Hillier Reference Hillier2003a; Winling and Michney Reference Winling and Michney2021; Woods Reference Woods2012).
It is also notable that the FHA, prior to the initiation of the HOLC City Survey, conducted its own studies of dozens of cities, recording at the scale of each block the average rent, total number of residential and commercial structures, various measures of housing characteristics, and total number of persons “of a race other than white” (Insured Mortgage Portfolio Reference Smith1938, 8–10, 22–24; Fishback et al. Reference Fishback, Rose, Snowden and Storrs2024; Munchmeyer Reference Munchmeyer1952). The FHA held that “the presence of even one nonwhite person in a block otherwise populated by whites may initiate a period of transition” (Federal Housing Administration 1939, 54), produced its own set of Housing Market Analysis maps with areas graded A through D based on the perceived safety of mortgage underwriting in each area, and refused to guarantee loans in the areas it graded D (Light Reference Light2011; Munchmeyer Reference Munchmeyer1952; Xu Reference Xu2022). The FHA subsequently destroyed these maps as it faced lawsuits over its discriminatory practices; analysis of a surviving map from Chicago found its D-graded areas to be associated with declines in home values and homeownership between 1940 and 1980 (Xu Reference Xu2022). Private lenders also created neighborhood risk maps of their own, as one Los Angeles bank researcher explained: “One of the many innovations in mortgage lending practice resulting from the depression experience is the new emphasis on neighborhoods as an element of mortgage risk (Smith Reference Smith1938, 9).” The researcher presented his bank’s own map of Los Angeles neighborhoods, with unfavorably graded areas featuring physical obsolescence and, in many cases, “incursion of inharmonious racial elements” (Smith Reference Smith1938, 22).
While the HOLC maps did not, unlike those of the FHA and those produced by private lenders, directly inform subsequent discriminatory practices, they are important to historians because they reflected existing redlining practices (Markley Reference Markley2024). They also reflected a wider trend towards institutionalizing the prejudices of local realtors’ and lenders’ organizations and the consequent hardening of differential access to resources across racial boundaries with the expansion of federal housing policy coming out of the Depression (Ray Reference Ray2019). HOLC staff agreed with the disparate treatment of neighborhoods, opining “We do not mean to imply that good mortgages do not exist or cannot be made in the third and fourth grade areas, but we do think they should be made and serviced on a different basis than in the first and second grade areas” (HOLC 1937). Lenders did not necessarily avoid lending in the areas that the HOLC graded D, but these were areas where they offered mortgages on inferior terms (Hillier Reference Hillier2003a). A lack of access to long-term low-interest amortized mortgages in turn affected long-term neighborhood change, as evidenced in studies that have found disparities to exist sixty to eighty years later between areas receiving different grades, including disparities in home values, in the incidence of poverty and incarceration, in homeownership rates, and in other measures of local socioeconomic and environmental character (Appel and Nickerson Reference Appel and Nickerson2016; Krimmel, Reference Krimmel2018; An, Orlando, and Rodnyansky Reference An, Orlando and Rodnyansky2019; McClure et al. Reference McClure, Feinstein, Cordoba, Douglas, Emch, Robinson, Galea and Aiello2019; Aaronson et al. Reference Aaronson, Faber, Hartley, Mazumder and Sharkey2020; Faber Reference Faber2020; Krieger et al. 2020; Wilson Reference Wilson2020; Aaronson, Hartley, and Mazumder Reference Aaronson, Hartley and Mazumder2021).
The HOLC’s map of Charlotte
We chose the 34 graded areas designated by the HOLC map of Charlotte, adapted from Mapping Inequality’s digitized map and illustrated in Figure 1, as our research area (Nelson and Winling Reference Nelson, Winling, Nelson and Ayers2023). These areas are located in the core of modern-day Charlotte, with the total graded area spanning 35.1 km2 and accounting for more than 80 percent of the built-up area in the 1930s; most of the ungraded area was commercial or industrial land. We also considered a number of primary resources available at the National Archives in College Park, Maryland. These included the HOLC’s descriptions of the 34 areas (Nixon Reference Nixon1937), which are also available on Mapping Inequality. Further resources included the HOLC’s Division of Research and Statistics’ summary report on Charlotte, a HOLC field agent’s confidential report to the Division of Research and Statistics’ director Corwin Fergus, and FHA housing market analyses of Charlotte from 1940, 1949, and 1955 (Cook Reference Cook1937; HOLC 1937; FHA 1940; FHA 1949; FHA 1955).
A schematic of the HOLC map of Charlotte, with the names of certain Charlotte neighborhoods included.

HOLC staff arrived in Charlotte in 1937 and met with eleven local professionals, subsequently explaining that their maps and area descriptions “have been carefully checked with competent local real estate brokers and mortgage lenders” (HOLC 1937).Footnote 1 HOLC staff graded 16 percent of Charlotte’s mapped area as A, 17 percent as B, 32 percent as C, and 35 percent as D. The HOLC graded three areas A: two in the neighborhoods of Dilworth and Myers Park on the south side of the city, and a third in the northeast located adjacent to the Charlotte Country Club. All three were described as neighborhoods of executives and businessmen, exclusively built up in the last dozen years with large single-family detached houses, without foreign-born or African American residents, and all of growing desirability and with ample access to mortgages for builders and buyers. While the Myers Park neighborhood adjoined a small D-graded African American enclave, which HOLC staff considered to be a “detrimental influence,” staff noted that that enclave’s population was composed largely of domestic servants working in Myers Park and that the population was “not increasing and there was no infiltration of negroes” into Myers Park (Nixon Reference Nixon1937, A-1 through A-3).
Charlotte’s seven B-graded areas mostly abutted its A-graded areas on the southern and eastern fringes of the city. Their professional profile was more varied, including executives, clerical and sales workers, as well as skilled mechanics living in a mixture of large and small single-family homes and a few duplexes and multi-family buildings. All B-graded areas had homes in good repair, and while some homes were at least two decades old, all areas had good access to mortgage financing. No B-graded area was described as having any foreign-born or African American residents, and while one was adjacent to an African American area, appraisers noted again that “there is hardly any possibility of an encroachment” (Nixon Reference Nixon1937, B-1 through B-7).
Thirteen of Charlotte’s 34 appraised areas were graded C, including central and outlying areas of the city to the west, north, and east. These were mixed areas of white-collar workers, skilled mechanics, and some laborers, all of whom were described as US-born and white. Most were adjacent to the city’s business and industrial sections, and two were noted as being adjacent to African American districts. Some had factories, boarding houses, and railroads within their boundaries, and small cottages, bungalows, and apartments predominated. HOLC staff described home financing as limited in the majority of these areas (Nixon Reference Nixon1937, C-1 through C-13).
Eleven areas of Charlotte were graded D. In the confidential report to Fergus, a staffer reported that “the D areas house the negro population of the city and are composed of older properties and cheaper properties and contain cotton mills and other industrial plants” (Cook Reference Cook1937, 26). Three D-graded areas were majority African American neighborhoods adjacent to the Central Business District in the city’s first, second, and third wards. Also graded D were the outlying African American neighborhoods of Biddleville and Greenville to the northwest, a “better grade of negro properties” along Sherman Avenue in the city’s southwest, and the Myers Park-adjacent enclave of African American domestic workers. There were also three areas of white factory workers and laborers graded D, including the northeastern neighborhood of Belmont/Villa Heights.
Charlotte’s African American neighborhoods, unlike many of its white areas, were mixed income – something HOLC staff clearly saw to be a detriment. Housing in half of the majority-African American areas was described as being in fair condition, but the variety of housing types in African American areas was an additional strike against their desirability. For example, Biddleville, home to the African American streetcar suburb of Washington Heights and Charlotte’s primary African American institution of higher learning, had “many better-grade negro properties occupied by negro professors teaching in the negro college, negro brick masons, and other skilled negro mechanics, but interspersed with these better-grade properties are many lower-grade properties” (Nixon Reference Nixon1937, D-1 through D-11). Interestingly, HOLC’s own research underlined the degree to which its assessment of neighborhood desirability did not necessarily align with apparent trends in valuation; whereas properties in A- and B-graded areas had regained 75 percent of their 1929 values, on average, properties in C- and D-graded areas had regained 80 percent of theirs (Cook Reference Cook1937, 16).
HOLC staff reported that the sorts of practices later associated with redlining were already established, and their statements reveal that the grades were in part based on this existing pattern of redlining. The largest volume of residential mortgages in Charlotte was held by national insurance companies, with Prudential and Metropolitan Life being the two largest, and they only loaned in the areas that HOLC graded A and B. Prior to the Depression, loans in these areas covered up to 80 percent of the assessed value of properties and were repaid over five to ten years with 5 to 6 percent interest (Cook Reference Cook1937, 30; HOLC 1937). Indeed, the 1940 Census of Housing found that insurance companies made virtually no loans to African Americans in Charlotte (US Bureau of the Census 1943a, 20). Building and loan associations, on the other hand, made most loans in C- and D-graded areas, including to a substantial number of African American households. Prior to the depression, they would only lend up to half of a property’s assessed value, with loans repaid over terms of six-and-a=half years with 6 percent interest (Cook Reference Cook1937, 27; US Bureau of the Census 1943a, 20).
The FHA’s insurance of lending had the effect of lowering interest rates and lengthening terms, but the disparity in practices across neighborhood boundaries was preserved. HOLC staff reported that the “activity of the Federal Housing Administration has been largely responsible for a more liberalized program on the part of building and loan associations …” which now covered up to 75 percent of the property’s value in areas graded C and D, with terms extended to 11.5 years at 6.5 percent interest. Insurance companies continued to only lend in A- and B-graded areas, and now for up to twenty years at only 4.5 percent interest (Cook Reference Cook1937, 27–33). The FHA was supportive of such continued differentiation in practices. In 1940, citing a continuing lack of land use zoning and other perceived sources of volatility, an FHA market analysis concluded that “In the FHA activities in Charlotte … extreme care should be exercised in the selection of sites and the neighborhood in which the individual sites are located …” (FHA 1940, 112).
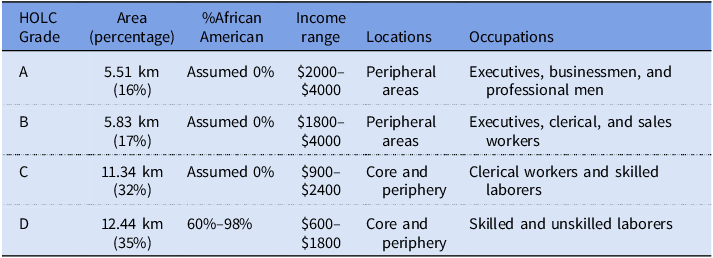
Table 1 provides a summary of the various areas, grouped by grade, with the percent African American, incomes, and occupations of residents in each area based upon the HOLC’s Area Descriptions (Nixon Reference Nixon1937), and the location and size of the differently graded areas derived from Mapping Inequality’s digitized map (Nelson and Winling Reference Nelson, Winling, Nelson and Ayers2023). According to staff descriptions, only D-graded areas had African-American households, and these areas had the lowest range of incomes; no area had a significant foreign-born population.
Summary of 4 HOLC grade areas based on its area descriptions and Mapping Inequality’s digitized map

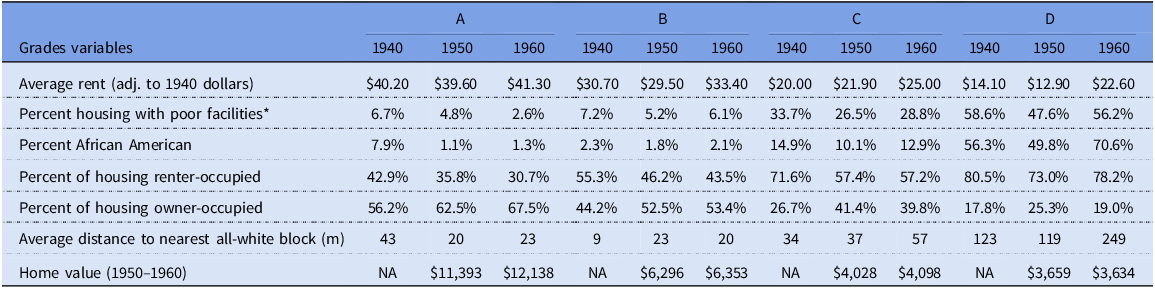
Table 2 shows the characteristics of the differently graded areas according to the Census of Housing block data of 1940, 1950, and 1960 for Charlotte (US Bureau of the Census 1942; US Bureau of the Census 1952; US Bureau of the Census 1961a). The HOLC was likely accurate in its assessment that the city’s neighborhoods lacked foreign-born residents; the 1940 Census found that only 0.91 percent of the city’s population was foreign born (US Bureau of the Census 1943b, 405). While the HOLC clearly intended to capture the city’s African-American population within D-graded areas, per its area descriptions (Table 1), the presence of smaller African-American enclaves, fuzzy racial boundaries, and some areas of mixing meant that in 1940, per Census of Housing data, we estimate that 19.6 percent of the city’s African American households lived in areas graded A, B, and C in 1940. We estimate that nearly 8 percent of the population in A-graded areas was African American, and it is highly unlikely that this population came there in the short time since the creation of the HOLC map – if anything, the African American population in A-graded areas may have already declined somewhat, as it continued to do over the next twenty years (Table 2). It is significant, then, that the HOLC-drawn boundaries and area descriptions reflected perceptions – perceptions that would result in hardened differences going forward, as we will subsequently show.
Selected demographic and housing characteristics of HOLC-graded areas of Charlotte, per 1940, 1950, and 1960 Census of Housing data

It is also important to remember that redlining was not the only factor driving neighborhood change during the period of our investigation. Charlotte introduced zoning in 1947 and zoned all of the neighborhoods that HOLC had graded D and some areas it had graded C for industry, in the hopes of stoking redevelopment (J.N. Pease & Co. 1949). The hiring of a full-time building code enforcement officer the following year aided in compelling landlords to bring numerous rental properties up to code, with landlords subsequently increasing rents for upgraded buildings. Highway building and urban renewal, and associated disruption to the demographic and built environment characteristics of cleared neighborhoods, were, for the most part, not yet factors in Charlotte. Interstates 77 and 277 involved the clearance of extensive areas of central Charlotte that had been graded D, but construction did not begin until the late 1960s, finishing in the 1970s. Local officials did not seek renewal funds until 1959, and while there was likely some anticipatory vacating of properties, clearance of the D-graded first and second wards did not occur until the mid-1960s (Hanchett Reference Hanchett1998; Figure 2).
A 1972 map of Charlotte’s urban renewal areas with the D-graded areas overlaid in red hatching. The second ward is marked as “Brooklyn” (Charlotte Redevelopment Commission).

Examining the HOLC map’s relationship with neighborhood change
We began our analysis by collecting demographic and housing variables from the block data of the Censuses of Housing of 1940 (United States. Bureau of the Census, 1942), 1950 (United States. Bureau of the Census, 1952), and 1960 (United States. Bureau of the Census, 1961a). Census of Housing block data offer the most finely grained picture of urban demographic and housing characteristics at this time because of the small size of blocks (Cowgill and Cowgill Reference Cowgill and Cowgill1951). By geo-referencing block maps and manually entering the data from the Censuses, we constructed digital maps of historical demographic and housing characteristics.
We were interested in comparing change over time in block characteristics between differently graded areas, with these characteristics expressed as continuous (i.e., having values from zero to 100) rather than binary variables. For this reason, we began our analysis with an OLS model. However, because the number of blocks changed over the decades, from 1,366 in 1940 to 1,894 in 1950 to 2,375 in 1960, and block boundaries changed as well, analyzing change over time is complicated; this is the so-called Modifiable Area Unit Problem, which occurs when the boundaries of artificial geographical units change (Wong Reference Wong, Janelle, Warf and Hansen2004). To analyze change from 1940 to 1960, we extracted the center point of each block from the geo-referenced 1940, 1950, and 1960 maps. We then constructed a grid of 1,284 200x200-meter cells over the geo-referenced version of each historical block map, joining it with the block center points. We chose 200x200 meters to reflect the average Census of Housing block size of approximately 80x80 to 150x150 meters, allowing for high spatial resolution.
For each decade, a large number of cells included portions of differently graded blocks. Here, we referred to Saporito et al. (Reference Saporito, Chavers, Nixon and McQuiddy2007), which explored various methods of allocating census geography data into analyzable units. We assigned cells bisected by HOLC area boundaries to whichever HOLC area composed at least 60 percent of the cell’s area and bisected a cell if it was split into two HOLC areas composing between 40 percent and 60 percent of the cell’s area. We excluded cells where at least 60 percent of the cell’s area fell outside of the HOLC-mapped area. Of 1,284 total cells, we dropped 200 (15.6 percent). In total, 546 (50.4 percent) of the 1,084 cells that remained in the sample were composed entirely of one HOLC-graded area or another; we bisected 32 cells (2.5 percent), and we assigned the remaining 506 (46.7 percent) of cells to the HOLC area that composed at least 60 percent of their area. It is notable that of these 506 cells, 294 had from 80 percent to 99 percent of their area falling into one or another HOLC-graded area.
After constructing the grid, we assembled the following variables for each grid cell, based on the data from our geo-referenced 1940, 1950, and 1960 maps: the percentage of residents who were African American, the home ownership rate, the percent of housing that was renter-occupied, average monthly rent, average home value, the percent of residences with poor facilities, and the distance to the closest all-white cell (calculated from center-point to center-point) as a measure of segregation.Footnote 2 We adjusted average monthly rent and average housing values in 1950 and 1960 to 1940 values using the US Bureau of Labor Statistics’ (2024) Consumer Price Index inflation calculator. The 1940 housing statistics do not contain records of housing values, and what we summarize as “poor facilities” had a different definition in each census. Change over time in this variable speaks both to changing housing conditions and changing standards in regard to housing.Footnote 3 To ensure residents’ privacy, the census statistics for 1950 and 1960 concealed data for blocks with fewer than five total residential units, and we excluded these blocks from the 1940 data to better enable comparison.
We examined the changes in the characteristics of the differently graded areas from 1940 to 1960 using the OLS model shown in Equation (1). We ran this model for each of the demographic and housing variables, using dummy variables
 ${\rm{\;}}$
to indicate whether a given cell was located in the A-, C-, or D-graded area. To prevent multicollinearity, we excluded B-graded cells. Therefore, the magnitude and significance of the regression coefficient reflects change over time for variable Y in A-, C-, and D-graded areas relative to B-graded areas between
 ${t_m}$
and
 ${t_n}$
, for the following characteristics of the cells: the percent of the population that was African American, the percent of housing that was owner-occupied, the percent that was renter-occupied, average monthly rent, the percent of units with poor facilities, average home value, and the distance to the nearest all-white cell.
 ${x_{dis}}$
is a control variable measuring the distance between each cell and the city center at the intersection of Trade and Tryon Streets, which is standardized by its mean and standard deviation to suit the scale of a dummy variable.
 $${Y_{\left( {{t_n} - {t_m}} \right)}} = {\beta _0} + \mathop \sum \limits_{i = 1,\left( {A,C,D} \right)}^3 {\beta _i}*{x_{i,dummy}} + {\beta _j}*{x_{dis}} + {\varepsilon _i}$$
The OLS model only tells us about change within the HOLC-graded area, but Charlotte expanded rapidly from 1940 to 1960. To identify patterns of spatial clustering in housing and neighborhood characteristics throughout the city, we applied hotspot analysis to the original geo-referenced block data. The hotspot analysis detects whether the distribution of African-Americans, poor-quality housing, and other analyzed characteristics are random or not; the detection of the existence of hotspots (and their inverse cold spots) helps visualize the geographical clustering of above- or below-average block characteristics, respectively (Chainey et al. Reference Chainey, Reid, Stuart, Kidner, Higgs and White2002).
To detect hotspots, the analysis considers the characteristics of each block in comparison to neighboring blocks weighted by distance from the block in question. This involves calculating the Getis-Ord Gi* statistic (Getis and Ord Reference Getis and Ord1992) for each of the following block characteristics: percent African American, the percent of housing with poor facilities, the percent renter-occupied, the percent of housing that was vacant, change in rent, and distance to the nearest all-white block (again calculated from center-point to center-point) as a measure of segregation.
 $${G_i^* = {{\mathop \sum \nolimits_{j = 1}^n {w_{i,j}}*{x_j} - \bar X*\mathop \sum \nolimits_{j = 1}^n {w_{i,j}}} \over {S*\sqrt {{{n*\mathop \sum \nolimits_{j = 1}^n w_{i,j}^2 - {{\left( {\mathop \sum \nolimits_{j = 1}^n {w_{i,j}}} \right)}^2}} \over {n - 1}}} }}}$$
Equation (2) shows the calculation of the Getis-Ord
 ${G_i^*}$
statistic of a block
 $i$
for a measurement of a variable
 $x$
. In the equation,
 ${w_{i,j}}$
represents a weight between block
 $i$
and one of its neighboring blocks
 $j$
defined by inverse Euclidean distance, which is suited to small block sizes and our smaller research area (Chainey et al. Reference Chainey, Reid, Stuart, Kidner, Higgs and White2002).
 $\bar X$
is that average in the variable for all blocks in the research area, and
 $S$
is the regional standard deviation of the measurement calculated by Equation (2). Based on the sign of the
 ${G_i^*}$
, we know whether a specific block in the dataset represents a hotspot (characterized by high values) or a cold spot (characterized by low values). The statistical significance of each variable is then evaluated by comparing the absolute value of
 ${G_i^*}$
with a threshold value derived from a Z-test, as outlined by Ott and Longnecker (Reference Ott and Longnecker2015). The z-scores and the corresponding p values associated with each block characteristic indicate where there is significant spatial clustering of blocks with high or low values, relative to the average value for all blocks in the study area.
A block identified as a statistically significant hotspot will not only exhibit high values of a given variable but will also be surrounded by neighboring blocks sharing similarly high values for that variable at a given confidence level (Chainey et al. Reference Chainey, Reid, Stuart, Kidner, Higgs and White2002). In this study, we choose a confidence level of 95% as a threshold for defining a hotspot. Conversely, a cold spot indicates a low value mirrored by low values on adjacent blocks at a confidence level of 95%. In cases where the values for neighboring blocks significantly diverge from that of the block under consideration – suggesting a situation in which high and low values are randomly distributed in the block’s vicinity – the block is deemed statistically insignificant and neither a hotspot nor a cold spot. In conducting a hotspot analysis for the change in rent from 1940 to 1960, we reverted to use of the 200x200 meter cells because the number and boundaries of blocks shifted over the two decades.Footnote 4
Results
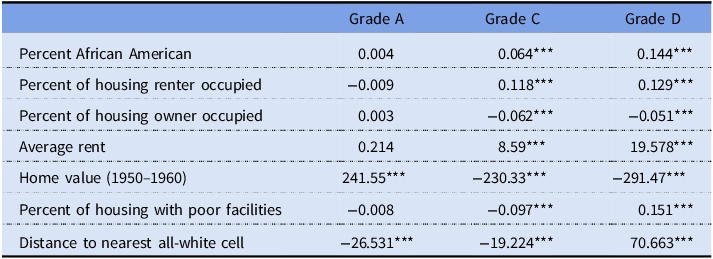
Results from our OLS model are displayed in Table 3. They reveal changes in the various demographic and housing characteristics of areas graded A, C, and D, relative to areas graded B. Over the twenty-year period, the percent of the population in areas graded C and D that was African American grew considerably relative to B-graded areas, with the relative magnitude of increase in areas graded D being more than twice that of areas graded C. The coefficient of 0.144 for Grade D indicates that, on average, D-graded areas experienced a 14.4 greater percentage point increase in the share of African American residents between 1940 and 1960 than B-graded areas, controlling for confounding variables such as the distance to the city center and socio-demographic covariates. Concurrently, the degree of racial segregation between D-graded areas and other areas intensified, with D-graded areas being the only places to show a significant relative rise in distance from the nearest all-white cell.
Summary of regression results, 1940 to 1960

*p<0.1; **p<0.05; ***p<0.01.
Relative to B-graded areas, housing conditions in D-graded areas worsened significantly over the two decades. The coefficient of .151, which is highly significant, indicates that D-graded areas experienced a 15.1 percentage point greater increase in the share of housing with poor facilities after adjusting for all covariates. The coefficient of –291.47 indicates that, from 1950 to 1960, median home values declined by $291 more than in B-graded areas, after adjusting for all covariates. Relative to B-graded areas, the percent of housing that was owner-occupied decreased significantly in C- and D-graded areas, and the percent of housing that was renter-occupied increased significantly in D-graded areas as it declined in C-graded areas, mirroring the changes that we detailed in Table 2. Despite worsening relative housing conditions in D-graded areas, average rent increased in D-graded areas by nearly $19.58 more than in B-graded areas each month, also affirming the increase that we display in Table 2. The average monthly rent in D-graded areas increased more than 60 percent from 1940 to 1960, where housing conditions were worsening relative to elsewhere in the city, while the average rent in C-graded areas increased around 25 percent, with even smaller increases occurring elsewhere (Table 2).
Our hotspot analysis further illustrates these trends by showing the increasing clustering of blocks of similar characteristics throughout the expanding city, with a notable increase in the number of hotspots for various characteristics within areas the HOLC graded D from 1940 to 1960. Figure 3 shows the distribution of blocks that are hotspots and cold spots and the outline of the areas graded D in 1940 and 1960 for each of the following characteristics: the percent of the block that was African American, the percent of housing units with poor facilities, the percent of units that were vacant, the percent that were renter-occupied, and the distance to the nearest all-white block. Figure 3 also shows hotspots and cold spots illustrating spatial clusters of the 200x200-meter cells where significant increases in average monthly rent occurred from 1940 to 1960.
Hotspot maps are based upon the share of each Census of Housing block that was African American in 1940 and 1960, the share of housing with poor facilities in 1940 and 1960, the share of housing that was vacant in 1940 and 1960, the share that was renter-occupied in 1940 and 1960, and the average distance to the nearest all-white block in 1940 and 1960. We also show a hotspot map based on the change in average monthly rent from 1940 to 1960 based upon our 200x200-meter grid. We note the share of blocks that were hotspots in Grade D areas and in otherwise-graded areas at the 95% confidence level.

From 1940 to 1960, blocks within areas that were graded D came to feature a greater share of blocks that were hotspots in regard to the percent of each block’s population that was African American, with the share of blocks in areas graded D that were hotspots growing from 59 percent to 82 percent and only a limited expansion of hotspots for African American residence outside of the Grade D areas on the city’s north side. The share of blocks that were hotspots in otherwise-graded areas declined from 4 percent to 2 percent. Similarly, we found that the share of blocks in D areas that were hotspots for poor facilities grew from 64 percent to 74 percent as the share of blocks in otherwise-graded areas declined from 3 percent to 1 percent – a result which, given shifting measures across the censuses, may speak more to changing standards than actual housing conditions (Limoges Reference Limoges1972). While no blocks were hotspots for vacancy in 1940, 42 percent of grade D blocks were hotspots for vacancy by 1960. The share of blocks that were hotspots for renter occupancy in Grade D areas grew from 51 percent to 84 percent as it shrank in otherwise graded areas, while cold spots noticeably spread out to the east and south. The share of blocks in D-graded areas that were hotspots in terms of distance from the nearest all-white block grew from 63 percent to 85 percent as the share in otherwise-graded areas dwindled to zero. Finally, in terms of change in average monthly rent, we found that 41 percent of the 200×200-meter cells that were hotspots were in D-graded areas, whereas only 1 percent of the cells in otherwise-graded areas were hotspots.
Discussion
Our research into the making of the Charlotte HOLC map shows that it reflected staffers’ understanding of where insurance companies and building and loan associations would lend and on what terms. These practices in turn reflected the city’s racial and housing geography: as they did in other cities, HOLC staffers gave D grades, indicating the most unfavorable lending practices, to all of the city’s African American neighborhoods. Our analysis of 1940 block characteristics, however, indicates that the HOLC map area descriptions overlooked a substantial number of African Americans residing outside of D-graded areas. We can see this by comparing the information from the HOLC’s area descriptions in Table 1 to the block data in Table 2. While these two surveys were made a few years apart, it is unlikely that an African American population had suddenly emerged by 1940 in areas where the HOLC claimed there had been none, especially since we see that this population was declining in A-, B-, and C-graded areas in the longer term.
What is perhaps more striking in the Charlotte case, then, is the degree to which the HOLC map boundaries were associated with a hardening pattern of racial segregation and other disparities going forward. Our OLS model results reveal that Grade D areas became significantly more African American relative to more favorably graded areas in the two decades following the creation of the map, a finding that is consistent with the raw housing block data. By 1960, furthermore, D-graded areas were located significantly further from all-white areas (Tables 2 and 3). Likewise, we found that the share of blocks in D-graded areas that were hotspots for African American residence increased, as that share decreased in otherwise-graded areas (Figure 3).
It is important to note that increasing segregation was not a new trend in this period; increasing racial differentiation of Charlotte’s neighborhoods dated from the nineteenth century (Hanchett Reference Hanchett1998). Throughout the US, segregation in US cities was increasing before, during, and after our period of investigation (Akbar et al. Reference Akbar, Li, Shertzer and Walsh2022; Boustan Reference Boustan2016; Logan and Parman Reference Logan and Parman2017). What our analysis suggests is that neighborhood redlining – what we see recorded by the HOLC map – played a role in this differentiation.
Also striking is the degree to which Charlotte’s D-graded areas experienced increased disadvantage over the period of investigation by a number of measures. By 1960, D-graded areas had come to feature a supply of housing characterized by greater vacancy, poorer quality, and higher costs to renters relative to otherwise graded areas. While the raw data show that housing quality may have stagnated in Grade D areas, quality relative to otherwise graded areas declined (Tables 2 and 3). Hotspot analysis confirmed these trends, as the share of Grade D blocks that were hotspots in regard to poor quality and vacancy increased as the shares that were hotspots for poor quality and vacancy declined in otherwise-graded areas (Figure 3).
Our OLS regression shows that rents increased in D-graded areas by a factor of nearly twenty, relative to B-graded areas, and hotspots indicating significant increases in rent were also concentrated in areas graded D (Figure 3; Table 3). The disparity in change in rent disproportionately affected African Americans; returning to the raw block statistics data, we found that renters on mostly African American blocks paid 73 percent more on rent than they did in 1940, adjusted for inflation, while renters on all-white blocks paid 1 percent more (United States. Bureau of the Census, 1942; United States. Bureau of the Census, 1961a). Rising rent for relatively poor-quality housing in areas of increasing segregation suggests an exploitative situation in which a limited supply of housing available to African Americans – in part due to discrimination against builders for the African American market and African American consumers themselves – meant that their households had to settle for housing that was becoming worse over time relative to housing in the wider area.
The FHA’s assessments of the Charlotte market in the postwar decades support this narrative. In its 1949 Survey of Housing and Population in Charlotte, the FHA noted the continuing strictly segregated nature of the city’s housing market and increasingly disparate circumstances across the city’s color line, which it blamed largely on the city’s African Americans themselves: “… little new housing has been provided for Negroes during the current decade, and … the filtration process, which normally provides a part of the housing for Negroes, has been largely inoperative since the war. … It is doubtful, however, that a significant number of Negroes as yet have the necessary financial capacity or the willingness to assume the obligations of home ownership or the high rentals that would be required under present-day construction costs” (FHA 1949, iii). Only six years later, however, the FHA concluded that 59 percent of the city’s African American population could afford minimum-cost rental housing that developers could profitably build (FHA 1955, 25–27). Furthermore, the share of African Americans who were homeowners rose from 10 to 29 percent from 1940 to 1950 (FHA 1955, ii-12).
While the ability to afford minimum-cost new rentals was increasing, and more African Americans were moving into homeownership, African American population growth was such (US Bureau of the Census 1943b, 375; US Bureau of the Census 1961b, 35–59) that the number of African American renters was also increasing. But new rental housing for African Americans, in the FHA’s own description, largely took the form of small-scale “fill-in type in older neighborhoods, mostly nonwhite,” this failing to alleviate African American demand for rental housing (FHA 1955, 22). We see that the share of housing that was renter-occupied in D-graded areas barely declined, even as it declined steeply in all otherwise-graded areas (Table 2). Two FHA-insured rental developments for African Americans were constructed during the period of investigation just beyond D-graded areas in the city’s north and southwest – these only contributed to a slight extension of existing African American areas and not to integration, as shown on our hotspot maps (FHA 1955, 15). A high incidence of vacancy in D-graded areas, as shown in our hotspot analyses (Figure 3) – perhaps the result of condemnation by Charlotte’s newly active building inspector, or else anticipatory vacancies related to the initiation of urban renewal in Charlotte – further contributed to African Americans’ housing crunch.
Rising rents for African Americans, like segregation, were part of ongoing nationwide trends in this period (Housing and Home Finance Agency 1952). In Charlotte, it is likely that the association of rising rents with D-graded areas reflects the particular role of discrimination against builders of African American rental housing in all but Grade D and a few adjacent ungraded areas. Indeed, the FHA concluded in its 1955 analysis that the city’s lenders were “in an excellent position financially to continue to produce and absorb a large volume of residential building – provided it is for white occupancy. In the nonwhite market, on the other hand, mortgage money is a major problem for both producers and purchasers …” (FHA 1955, 19). It was the city’s whites who largely benefited from the “liberalized” terms described by the HOLC (Cook Reference Cook1937, 27–33), both within A- and B-graded areas and on the expanding suburban fringe. In the FHA’s own assessment, the city’s whites had constituted most demand for low-cost rentals prior to the war, but the accessibility of FHA-insured loans for new housing on the city’s south and eastern sides and the subsequent transition of more white consumers into homeownership in these places left white renters’ demand for housing satisfied, as the process of filtration stalled for African Americans (FHA 1949, 5–11).
Those who moved into homeownership in Grade D areas were furthermore not, on average, building wealth over time, given the steep decline in property value relative to Grade B areas. Conversely, we see large gains in property values in A-graded areas relative to B-graded areas (Table 3). Given that property values were relatively declining in C-graded areas as well, this trend may have had to do largely with the greater age of buildings in D- and C-graded areas, as noted by the HOLC. Akbar et al. (Reference Akbar, Li, Shertzer and Walsh2022) have also theorized that lower capitalization rates in African American areas, based on market perceptions of the faster depreciation of housing in these areas, contributed to lower property values, perhaps explaining the greater magnitude of decline in D-graded areas than in C-graded areas.
Meanwhile, white households moved into homeownership in A- and B-graded neighborhoods and the areas beyond them on Charlotte’s east and south sides, located increasingly distant from D-graded areas in areas of rising property values (Table 3). Our 1960 hotspot map of the share of block residents who were African American shows how blocks with very low shares of African American residents spread extensively from the city’s core area, to the east, south, and west, while blocks with a high African American presence spread limitedly to the north (Figure 3).
Conclusion
Here, we investigated the association of the HOLC City Survey map with neighborhood change in Charlotte, North Carolina, from 1940 to 1960, in order to understand how disparities between differently graded areas emerged in the shorter term, prior to the emergence of other important contributors to neighborhood change, including highway building and urban renewal. We employed an OLS model and hotspot analysis to understand how differently graded areas of Charlotte changed during this period and sought to frame our understanding of the results in consultation with a number of primary resources from before and during the period of investigation.
As disparate as D-graded areas were from other residential areas to begin with, particularly in terms of race, we found that the HOLC map’s boundaries were associated with increasing differences going forward. In Charlotte, areas graded D became significantly more populated by African American households relative to other areas, and the share of blocks in grade D areas that were hotspots for African American residence increased. Housing in D-graded areas furthermore declined in quality, and the incidence of vacancy rose. Even so, renters in these areas paid significantly higher rents, in terms of real dollars and in relation to the increases seen in other areas, while homeowning households experienced home values that were declining relative to other areas.
Postwar FHA market analyses reveal that a shortage of lending money for builders of African American housing and for African American homebuyers beyond D-graded areas in a segregated housing market largely explains this exploitative situation, in which the city’s African Americans remained dependent on a constrained supply of aging rental housing. At the same time, our findings show how the white population took advantage of improved home-financing opportunities in favorably graded areas, as well as beyond the boundaries of the HOLC-graded areas, with the geographical distance between the white population more scattered to Charlotte’s south and east sides and the relatively contained African American population increasing.
Redlining was not the only phenomenon affecting Grade D areas in the period of investigation; zoning and code enforcement also likely contributed to neighborhood changes, including declining home values and increased vacancy. Nor was increasing segregation a new trend in Charlotte. But its reflection in the boundaries of the HOLC map, along with the HOLC map’s association with other growing differences, indicates how redlining at once reflected lenders’ perceptions of reality and hardened those perceptions into a starker reality.