1. INTRODUCTION
The Automatic Identification System (AIS) is an automatic tracking system that is used on ships, by Vessel Traffic Services (VTS) and by coastal monitoring organisations for identifying and locating vessels by electronically exchanging data with other nearby ships, AIS base stations and satellites. According to the International Telecommunication Union (ITU) (2014) specification, AIS data include ship-related static and dynamic information. The static information, which is manually entered and is automatically broadcast every six minutes or on request, mainly includes identification information such as ship name, type, call sign, dimensions, etc. The dynamic information, which is from Global Navigation Satellite System (GNSS) information (usually Global Positioning System (GPS)) and is broadcast at a time interval from two seconds to six minutes, depending on the vessels' motion, includes the ship's position (longitude and latitude), timestamp, Course Over Ground (COG), Speed Over Ground (SOG), true heading, etc. Ships fitted with AIS transceivers can be tracked by static AIS base stations located along coastlines or, when out of range of terrestrial networks, through a growing number of satellites that are fitted with special AIS receivers. According to the mandatory requirements of the International Convention for the Safety of Life at Sea (SOLAS), Chapter V: Safety of Navigation, Regulation 19 (International Maritime Organization (IMO), 2014), all ships of 300 gross tonnes and upwards engaged on international voyages, cargo ships of 500 gross tonnes and upwards not engaged on international voyages, as well as passenger ships irrespective of size shall be fitted with an AIS transceiver. The widespread use of AIS base stations and satellites has led to a huge volume of spatial trajectories, each of which is comprised of a sequence of spatio-temporal points. As the points comprise a huge volume of data, and certain points are redundant, in the study of AIS data, such as in outlier detection (Pallotta et al., Reference Pallotta, Vespe and Bryan2013; Sidibé and Shu, Reference Sidibé and Shu2017), pattern analysis (Ristic et al., Reference Ristic, Scala, Morelande and Gordon2008; Wang et al., Reference Wang, Zhu, Zhou and Zhang2017; Zhang et al., Reference Zhang, Shi, Liu, Zhao and Wu2018) or the statistical analysis of maritime traffic (Mazaheri et al., Reference Mazaheri, Montewka, Kotilainen, Sormunen and Kujala2015; Shu et al., Reference Shu, Daamen, Ligteringen and Hoogendoorn2013), application systems have to bear expensive data storage costs, high communication loads and time-consuming calculations. This requires trajectory simplification technologies to compress the redundant information while keeping the utility of a trajectory.
To improve the processing speed of AIS data, some data processing methods have been proposed. For example, Aarsæther and Moan (Reference Aarsæther and Moan2009) used an image registration technique to group track-lines and produce a simplified ship traffic model. The median tracks of the traffic-groups were used to represent the prevailing features of the traffic lane. For managing AIS data, Altan and Otay (Reference Altan and Otay2017) proposed a grid-based data analysis method. The observed area was divided into 13 sectors according to the transit traffic waterway border points of the Strait Of Istanbul. Data at the entrance and the exit of the sectors were analysed to find the traffic characteristics of the area. In the studies of Silveira et al. (Reference Silveira, Teixeira and Soares2013) and Wu et al. (Reference Wu, Fu, Wang and Xiao2017a), to improve the analysis speed of maritime traffic patterns, the study area was split into fixed-edge grids. In addition, Wu et al. (Reference Wu, Xu, Wang, Wang and Xu2017b) used multi-threading technology to improve AIS data processing speed. Although the above literature has proposed methods to improve the speed of AIS data processing, they did not involve the deletion of redundant data, which will lead to a lot of repetitive work. The trajectory simplification algorithm proposed in this paper can delete a large amount of redundant data in the original trajectory. It can be used as an important pre-processing process for ship trajectory research and can further improve the speed of AIS data processing.
A number of successful attempts have been made regarding AIS trajectory simplification. Zhang et al. (Reference Zhang, Liu, Cai, Wu and Shi2016) used an AIS-based statistical minimum ship domain and the DP (Douglas and Peucker, Reference Douglas and Peucker1973) algorithm distance threshold to compress AIS trajectory data and verify the relationship between the distance threshold and compression rate. Vries and Someren (Reference Vries and Someren2012) proposed a Two Stage Piecewise Linear Segmentation (2Stage-PLS) vessel trajectory simplification algorithm based on deterministic error bounds (Gudmundsson et al., Reference Gudmundsson, Katajainen, Merrick, Ong and Wolle2009). The basic idea of the 2Stage-PLS is that it can compress the trajectory to use the speed error measure and distance error measure based on the DP algorithm, which can provide a good stop retention result. Zhu et al. (Reference Zhu, Miao and Liu2014) proposed the concept of the importance degree, which is used to reflect the richness of a single trajectory point containing the offset distance, speed change and course change according to a pre-set importance degree threshold to decide whether to delete the trajectory point.
There are three main problems in the above three trajectory simplification algorithms. First, they are based on the DP algorithm. The DP algorithm can achieve a good compression rate, but it uses the perpendicular distance between the original point and the simplified trajectory as the error measure; without considering the time dimension, it will lead to a large time error. Second, the vessel trajectory simplification algorithm aims to reduce the size of the vessel trajectory data while obtaining a low simplification error. A position-preserving algorithm that does not limit the directional changes and speed changes will lead to a bigger directional error and speed error between the approximate trajectory and original trajectory. Zhu et al. (Reference Zhu, Miao and Liu2014) considers the current speed change and the directional change in vessel trajectory simplification, but constant slight course alterations or speed alterations will be ignored. Thus, better algorithms should be designed to save the important position, direction and speed information. Last, compression algorithms can be classified as either offline or online algorithms based on whether they require the availability of the full data series. An offline algorithm reduces the size of the trajectory after the trajectory has been fully generated. The online algorithm compresses a trajectory instantly as an object travels (Zheng, Reference Zheng2015). The DP algorithm is a typical offline algorithm. The use of an offline algorithm requires considerable memory space and cannot process and display trajectories in real time. Therefore, an online algorithm is needed.
The contributions can be summarised as follows:
• A new problem that arises with vessel trajectory simplification when using existing algorithms based on position-preservation or direction-preservation alone is studied.
• Based on baseline solutions, preservation is proposed an improved online multi-dimensional simplification algorithm considering position preservation, direction preservation and speed preservation.
• Extensive experiments on real AIS datasets were conducted. The results demonstrate the superior performance of the approach on both the error and compression rates.
This paper is structured as follows. Section 2 introduces line simplification theory and the possible problems. In Section 3, the overall design of the Directed acyclic graph based Online Trajectory Simplification (DOTS) algorithm and how to use fdr and fvr to optimise the DOTS algorithm without increasing the time complexity such that it has the function of direction preservation and speed preservation is introduced. Section 4 validates the effectiveness of the simplification algorithm. The study's conclusions are presented and future research is outlined in Section 5.
2. TRAJECTORY SIMPLIFICATION
There are two types of simplification algorithms in the study of trajectory simplification: one type is the position-preserving algorithm, and the other is the direction-preserving algorithm. The speed-preserving algorithm is often integrated into the above two algorithms.
2.1. Position-preserving algorithm
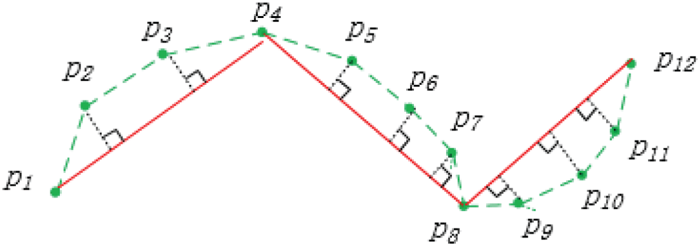
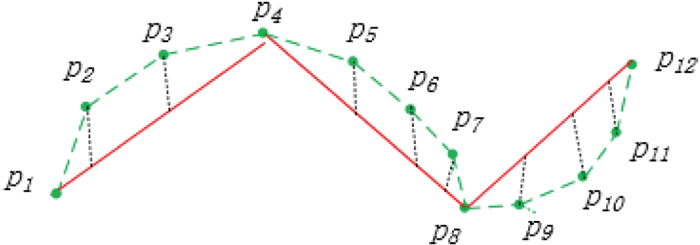
Most studies have concentrated on the position-preserving algorithm. Bertolotto and Zhou (Reference Bertolotto and Zhou2007), Chen et al. (Reference Chen, Lee, Huang and Lai2009), Pallero (Reference Pallero2013) and Shi and Charlton (Reference Shi and Charlton2013) compressed trajectories based on the DP algorithm, while Keogh et al. (Reference Keogh, Chu, Hart and Pazzani2001) and Liu et al. (Reference Liu, Iwai and Sezaki2013) realised the online compression function of the DP algorithm. The algorithm using the Perpendicular Distance (PD) compression trajectory does not take into account the time characteristics of the trajectory. To solve this problem, Meratnia and By (Reference Meratnia and By2004); Muckell et al. (Reference Muckell, Olsen, Hwang, Lawson and Ravi2013) and Meng et al. (Reference Meng, Yu, Yao and Li2017) used Synchronised Euclidean Distance (SED) to compress the trajectory. To improve the speed of the SED computation and ensure the minimum compression error, Chen et al. (Reference Chen, Xu and Fränti2012) and Cao and Li (Reference Cao and Li2017) used the Local Integral Square Synchronised Euclidean Distance (LISSED) to compress the trajectory. The DOTS algorithm of Cao and Li (Reference Cao and Li2017) can minimise the integral Square Synchronised Euclidean Distance (ISSED) under the same compression rate, and the ISSED is the sum of all LISSED errors. The difference between the PD and SED is illustrated in Figures 1 and 2, where the green dashed line is the original trajectory and the red solid line is the simplified trajectory. The PD is the perpendicular distance of the original trajectory point to the simplified trajectory. The SED is the same time position distance between the simplified trajectory and the original trajectory. The LISSED is the SED accumulated sum of each simplified trajectory segment. The ISSED is the LISSED accumulated sum. In general, position-preserving algorithms use the distance between the original trajectory and the simplified trajectory as the criterion to determine whether to delete the trajectory point, and the difference between the various studies is primarily in how to find the best sampling points quickly such that the compression rate is the fastest and the error are the smallest.
PD error.

SED error.

The loss of direction changing and speed changing information is the main drawback of the position-preserving algorithm. If the purpose of direction changing is to steer clear of a wreck, buoy or shallow water, the simplified trajectory will be inconsistent with the actual situation. This is a case of over compression and it is difficult to find an appropriate distance threshold to avoid the occurrence of this situation. To solve this problem, the direction-preserving algorithm is added to the position-preserving algorithm when the speed is higher than a pre-set threshold.
2.2. Direction-preserving algorithm
There are also a number of studies that compress trajectories from the aspect of direction preservation, and representative algorithms include those by Potamias et al. (Reference Potamias, Patroumpas and Sellis2006), Long et al. (Reference Long, Wong and Jagadish2013; Reference Long, Wong and Jagadish2015), Ke et al. (Reference Ke, Shao and Zhang2017), Wu et al. (Reference Wu, Fu, Wang and Xiao2017a) and Deng et al. (Reference Deng, Han, Wang, Ranjan, Zomaya and Jie2017). Potamias et al. (Reference Potamias, Patroumpas and Sellis2006) defined two safe areas where one is formed by the previous two practical points, the other is formed by the previous two sample points, and only points that are within both safe areas will be deleted. Long et al. (Reference Long, Wong and Jagadish2013; Reference Long, Wong and Jagadish2015) used the concept of the Feasible Direction Range (FDR) to obtain all the simplified trajectories that meet the requirement of the direction changing threshold, and then returns the solution according to the shortest path found. Deng et al. (Reference Deng, Han, Wang, Ranjan, Zomaya and Jie2017) proposed an online version based on Long et al. (Reference Long, Wong and Jagadish2013).
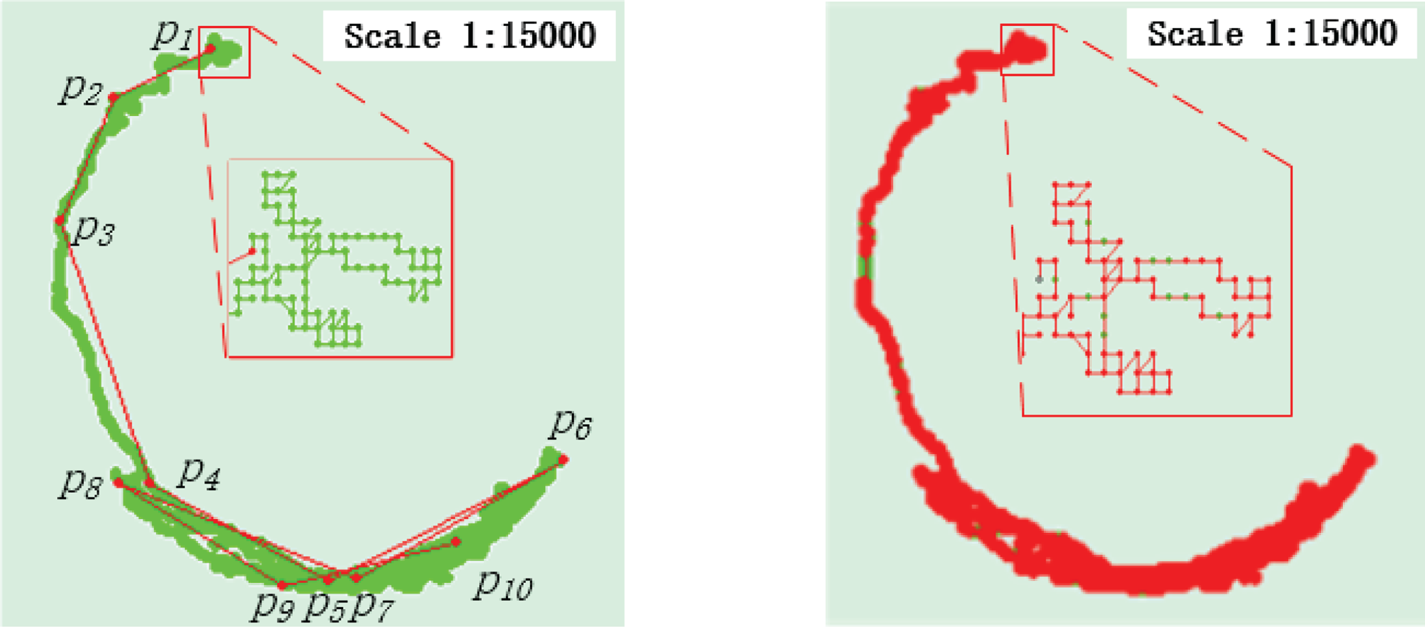
Under the states of stopping or low speed navigation, the trajectory direction varies greatly over a short time due to GPS error or the swing of the ship's heading, and the use of a direction-preserving algorithm will lead to under compression. Figure 3 shows an anchoring ship's trajectory simplification result using a position-preserving algorithm and a direction-preserving algorithm, respectively. It can be seen that just ten points are enough to reflect the movement of an anchoring ship under the influence of tidal current. The simplified trajectory based on the direction-preserving algorithm saves most of the original trajectory points. To solve this problem, the direction-preserving algorithm is used only when the speed is greater than a pre-set speed boundary.
The left diagram shows the compression result based on a position-preserving algorithm. The right diagram shows the compression result based on a direction-preserving algorithm. The green line represents the original trajectory, and the red line represents the simplified trajectory.

2.3. Speed-preserving algorithm
In some existing position-preserving algorithms or direction-preserving algorithms, speed preservation is included. For example, Zhu et al. (Reference Zhu, Miao and Liu2014) and Meratnia and By (Reference Meratnia and By2004) determined whether or not to save points using the difference in the speed values between the previous and next trajectory segment, and if the difference exceeded a certain speed threshold, they saved the point. Potamias et al. (Reference Potamias, Patroumpas and Sellis2006) determined whether to save points using the difference in speed values between the previous two practical points and the previous two sample points. Vries and Someren (Reference Vries and Someren2012) determined whether to save points using the difference between the actual speed and the linearly interpolated speed, and according to their experiments, this method could provide better stop retention at the same compression rate. However, this algorithm is an off-line algorithm.
These studies indicate that a single simplification algorithm used on ship trajectory data will not get satisfactory results. Therefore, it is necessary to establish an algorithm considering position, direction and velocity preservation.
3. ALGORITHM DESCRIPTION: IMPROVED DOTS ALGORITHM
DOTS minimises the ISSED to preserve the location of the original trajectory as much as possible. The effect is better than that of existing algorithms. However, DOTS lacks direction preservation and speed preservation functions. Therefore, the main purpose of this paper is to improve the DOTS such that it retains direction and speed information.
3.1. Definitions
Before establishing the Vessel Trajectory Simplification algorithm, the following definitions should be given.
Definition 1 (Location point): A location point, which is denoted as  $p_{i}=( x_{i}, \; y_{i}, \; t_{i}) $, is a location sample with a position and timestamp. x i is the latitude, y i is the longitude, t i is the timestamp and i ∈ [1, n].
Definition 2 (Trajectory stream): The trajectory stream is defined as a series of location points arranged in chronological order, which is denoted as  $T=\{p_{1}, \; p_{2}, \; \ldots, \; p_{k}, \; \ldots\}$. The compressed trajectory stream of T is denoted as
 $T^{\prime}=\{ p_{1}^{\prime}, \; p_{2}^{\prime}, \; \ldots, \; p_{k}^{\prime}, \; \ldots\} $.
Definition 3 (The direction of a trajectory segment line): The line segment between two adjoining points in T is denoted as  $\overrightarrow{l_{{j}}}=\overrightarrow{p_{{j}}p_{{j}+1}}$, 1 ≤ j ≤ n − 1. True north is 0°, and the angle of the clockwise rotation to the
 $\overrightarrow{l_{{j}}}$ is the direction of trajectory segment line, which is denoted as
 $\theta ( \overrightarrow{l_{{j}}}) $.
Definition 4 (The angular difference between two directions): For two directions θ 1 and θ 2, the angular difference between θ 1 and θ 2, which is denoted as  $\Delta ( \theta_{1}, \; \theta_{2}) $, is defined as the minimum of the angle of the clockwise rotation from θ 1 to θ 2 and that from θ 2 to θ 1. That is,
 $\Delta ( \theta_{1}, \; \theta_{2}) =\min\{ \vert \theta_{1}-\theta_{2}\vert, \; 2\pi -\vert \theta_{1}-\theta_{2}\vert \} $.
Definition 5 (The compression angular error of a segment line):  $\overrightarrow{l_{s{j}}}=\overrightarrow{p_{s{j}}p_{s{j}+1}}$ is a compressed segment line in T ′, and its compression angular error, which is denoted by
 $\varepsilon_{\theta }( \overrightarrow{l_{s{j}}}) $, is defined as the greatest angular difference between
 $\theta ( \overrightarrow{l_{s{j}}}) $ and
 $\theta ( \overrightarrow{l_{k}}) $, where
 $\overrightarrow{l_{k}}=\overrightarrow{p_{k}p_{k+1}}$ is one segment line in T approximated by
 $\overrightarrow{l_{s{j}}}$. This means that
 $\varepsilon_{\theta }( \overrightarrow{l_{s{j}}}) =\max( \Delta ( \theta ( \overrightarrow{l_{s{j}}}) \theta ( \overrightarrow{l_{k}}) ) ) $, and
 $t_{sj}\le t_{k}<t_{k+1}\le t_{sj+1}$.
Definition 6 (The difference between two speeds): For two speeds v 1 and v 2, the difference between v 1 and v 2, which is denoted by  $\Delta ( v_{1}v_{2}) $, is defined as the absolute value of v 1 − v 2, which means that
 $\Delta ( v_{1}v_{2}) =\vert v_{1}-v_{2}\vert $. The speed on this segment is replaced by the average speed
 $v( \overrightarrow{l_{{j}}}) $, and the unit is knots (kn).
Definition 7 (The compression speed error of a segment line):  $\overrightarrow{l_{s{j}}}=\overrightarrow{p_{s{j}}p_{s{j}+1}}$ is a compressed segment line in T ′, and its compression speed error, which is denoted by
 $\varepsilon_{v}( \overrightarrow{l_{s{j}}}) $, is defined as the greatest speed difference between
 $v( \overrightarrow{l_{s{j}}}) $ and
 $v( \overrightarrow{l_{k}}) $, where
 $\overrightarrow{l_{k}}=\overrightarrow{p_{k}p_{k+1}}$ is one segment line in T approximated by
 $\overrightarrow{l_{s{j}}}$. This means that
 $\varepsilon _{v}( \overrightarrow{l_{s{j}}}) =\max( \Delta ( v( \overrightarrow{l_{s{j}}}) v( \overrightarrow{l_{k}}) ) ) $, and
 $t_{sj}\le t_{k}<t_{k+1}\le t_{sj+1}$.
Definition 8 (The compression rate): The size of T is defined as the number of location points, which is denoted as  $\vert T \vert $. The size of T ′ is denoted as
 $\vert T^{\prime} \vert $. With the compression rate
 $r=\vert T^{\prime} \vert /\vert T \vert $, the smaller r is, the more points that need to be deleted.
3.2. DOTS algorithm
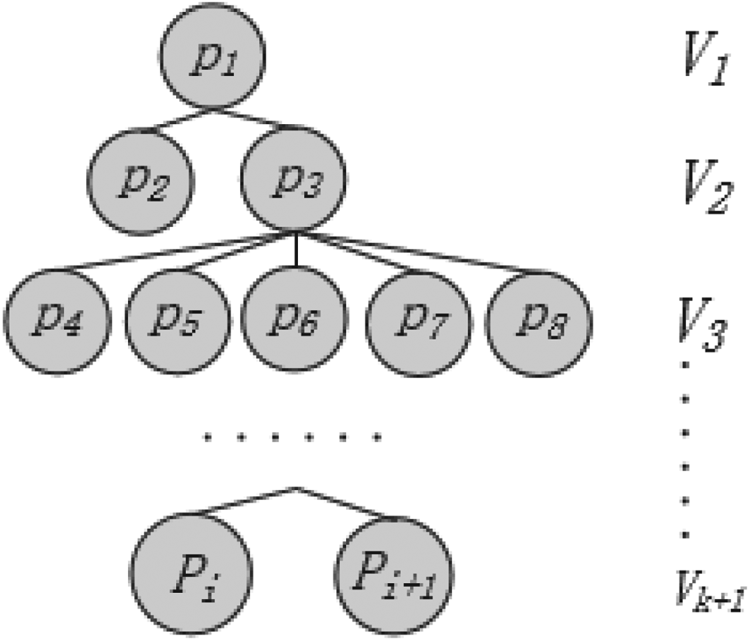
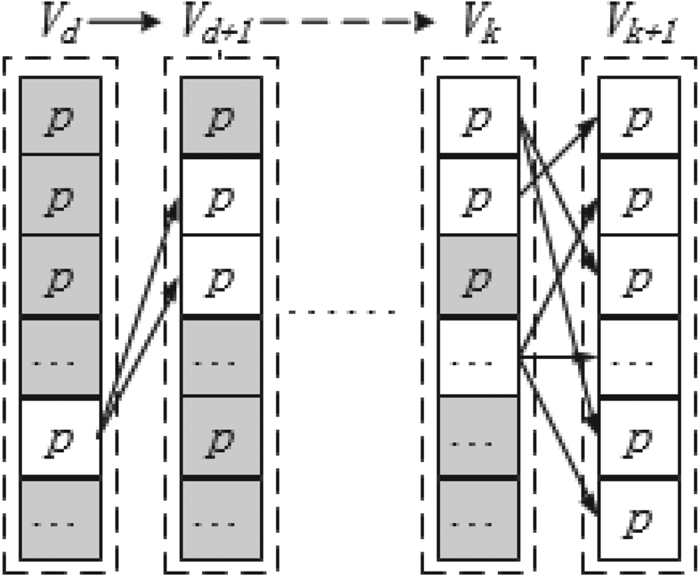
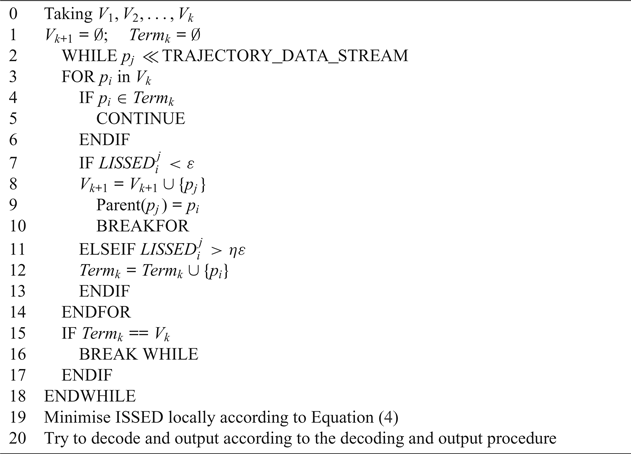
In this paper, the online compression of an AIS trajectory is realised by improving the DOTS algorithm. Therefore, the DOTS algorithm needs to be described first. The DOTS algorithm uses incremental Directed Acyclic Graph (DAG) construction to realise online trajectory compression, and its process is summarised in Algorithm 1. The function of DAG is to choose the minimum ISSED point in the V k layer as the parent of p j. It can create a k + 1 layer compression path tree as shown in Figure 4. The 1-alive-element layers will decode and output a single vertex to the simplified trajectory T ′ step by step. The meaning of 1-alive-element layers is represented in Figure 5, in which the alive vertices are marked in light shading, and the dead ones are marked in dark shading. An “alive” vertex is the point that is connected to the V k+1 layer, and a “dead” vertex is the point that is not connected to the V k+1 layer.
Compression path tree.

Decoding procedure of DOTS algorithm.

Incremental DAG construction.

SED can be described by equation:
 $$SED_{k}=\sqrt{\left( x_{k}-x_{k}^{\prime} \right)^{2}+\left( y_{k}-y_{k}^{\prime} \right)^{2}}$$
where:
 $$x_{k}^{\prime}=x_{i}+\frac{t_{k}-t_{i}}{t_{j}-t_{i}}(x_{j}-x_{i})\quad y_{k}^{\prime}=y_{i}+\frac{t_{k}-t_{i}}{t_{j}-t_{i}}(y_{j}-y_{i})$$
where i and j are the start and end point numbers of the approximated trajectory and k is the number of any point between p i and p j, and  $1\le i<k<j\le \vert T\vert$.
 $LISSED_{i}^{\, j}$ can be described by equation:
 $$\begin{align} LISSED_{i}^{\,j}&=\sum\limits_{i<k<j} SED^{2}\left(p_{k},p_{k}^{\prime} \right)=\left( c_{1}^{2}+c_{3}^{2}\right)\left( j-i-1 \right)+(c_{2}^{2} +c_{4}^{2})\left(S_{t^{2}}^{\,j-1}-S_{t^{2}}^{i} \right)\notag\\&\quad +2\left(c_{1}c_{2}+c_{3}c_{4} \right)\left( S_{t}^{\,j-1}-S_{t}^{i}\right)+\left( S_{x^{2}}^{\,j-1}+S_{X^{2}}^{i} \right)+\left(S_{y^{2}}^{\,j-1}+S_{y^{2}}^{i} \right)\notag\\&\quad -2c_{1}\left(S_{x}^{\,j-1}+S_{x}^{i} \right)+2c_{3}\left(S_{y}^{\,j-1}+S_{y}^{i} \right)-2c_{2}\left(S_{xt}^{\,j-1}+S_{xt}^{i}\right)+2c_{4}(S_{yt}^{\,j-1}+S_{yt}^{i})\end{align}$$
where:
 $$\begin{align}c_{1}&=\frac{x_{i}t_{j}-x_{j}t_{i}}{t_{j}-t_{i}}\quad c_{2}=\frac{x_{j}-x_{i}}{t_{j}-t_{i}}\quad c_{3}=\frac{y_{i}t_{j}-y_{j}t_{i}}{t_{j}-t_{i}}\quad c_{4}=\frac{y_{j}-y_{i}}{t_{j}-t_{i}}\\ S_{x}^{i}&=\sum\limits_{j=1}^i x_{j} \quad S_{y}^{i}=\sum\limits_{j=1}^i y_{j} \quad S_{t}^{i}=\sum\limits_{j=1}^i t_{j} \quad S_{x^{2}}^{i}=\sum\limits_{j=1}^i x_{j}^{2}\\ S_{y^{2}}^{i}&=\sum\limits_{j=1}^i y_{j}^{2} \quad S_{t^{2}}^{i}=\sum\limits_{j=1}^i t_{j}^{2} \quad S_{xt}^{i}=\sum\limits_{j=1}^i {t_{j}x_{j}} \quad S_{yt}^{i}=\sum\limits_{j=1}^i {t_{j}y_{j}} \end{align}$$
The ISSED of the simplified trajectory T ′ can be described by equation:
 $$ISSED=\sum_{p_{k_{i}\in T^{\prime}}}^i {LISSED}_{k_{i}}^{k_{i+1}}$$
If there are multiple points in V k that satisfy  ${LISSED}_{i}^{\, j}<\varepsilon$, the optimal point is selected using equation:
 $$Parent^{\ast }(p_{j})={\alpha_{p_{i}}+{LISSED}_{i}^{\,j}}$$
 $\alpha_{p_{i}}$ is the ISSED from p 1 to p i.
This section briefly describes the structure of the compressed path tree and the construction process of the layers in the DOTS algorithm and gives the calculation formula of the distance scale in the DOTS algorithm. The DOTS algorithm can be used to create a ship trajectory compression path tree online and output sampling points. The distance scale used by DOTS can preserve the spatial and temporal information of the ship trajectory.
There are two key points in DAG that can be optimised to limit the compression angle error and the compression speed error. One is that when p j selects the parent node in V k (Step 7 to 10), it needs to add the judgment of the compression angle error and compression speed error so that the two errors are within an allowable range. The other is that in the judgment of the termination condition of DAG (Step 11 to 12), the judgment of the termination condition of the angle error and speed error should be added. How to implement these two key points will be explained in Sections 3.3 and 3.4, and the implementation process will be explained in Section 3.5.
3.3. Optimising DOTS algorithm using direction-preserving
To make DOTS have the function of direction preservation, DOTS is modified. According to a pre-set speed boundary v b, if v ≤ v b, the position-preserving algorithm is used, and otherwise the compression angular error judgement is added to the parent vertex selection process, which is denoted as  $\varepsilon_{\theta}( \overrightarrow{p_{{i}}p_{{j}}}) \le \varepsilon_{\theta }$. The time complexity of DOTS is O(N 2/M),
 $N=\vert T\vert$, and M is the number of layers. If the program judges each
 $\varepsilon_{\theta }( \overrightarrow{p_{{i}}p_{{j}}}) $, the time complexity is O((N/M)2), and the time complexity of the whole algorithm is O((N/M)2N). To make the optimisation algorithm not increase the time complexity of the original algorithm, the concept of fdr can be used.
 $fdr( \overrightarrow{p_{{i}}p_{{i}+1}}) $ represents a directional range of the segment line
 $\overrightarrow{p_{{i}}p_{{i}+1}}$, the centre direction is
 $\theta ( \overrightarrow{p_{{i}}p_{{i}+1}}) $ and the width is 2
 $\varepsilon _{\theta }$. It is denoted as:
 $$fdr \left(\overrightarrow{p_{{i}}p_{{i}+1}} \right)=[\theta \left( \overrightarrow{p_{{i}}p_{{i}+1}}\right)-\varepsilon_{\theta }\theta \left(\overrightarrow{p_{{i}}p_{{i}+1}} \right)+\varepsilon_{\theta}]$$
Given  $fdr( \overrightarrow{p_{{i}}p_{{j}}}) $, if
 $\theta ( \overrightarrow{p_{{i}}p_{{j}}}) \in fdr( \overrightarrow{p_{{i}}p_{{j}}}) $, then
 $\varepsilon_{\theta }( \overrightarrow{p_{{i}}p_{{j}}}) <\varepsilon_{\theta }$.
Here:
 $$fdr(\overrightarrow{p_{{i}}p_{{j}}}) = \bigcap \limits_{i\le h\le j} {fdr(\overrightarrow{p_{h}p_{h+1}})}$$
and  $fdr( \overrightarrow{p_{{i}}p_{{j}}}) $ can be obtained by:
 $$fdr( \overrightarrow{p_{{i}}p_{{j}}} ) =fdr(\overrightarrow{p_{{i}}p_{{j}-1}})\cap fdr(\overrightarrow{p_{{j}-1}p_{{j}}})$$
Given  $fdr( \overrightarrow{p_{{i}}p_{{j}-1}}) $, the time complexity of calculating
 $fdr( \overrightarrow{p_{{i}}p_{{j}}} ) $ is O(1), which is the same as that of calculating
 ${LISSED}_{i}^{\, j}$.
In DOTS, the search termination condition for p i is  ${LISSED}_{i}^{\, j}>\eta \varepsilon $. To minimise the compression rate, the termination condition based on the directional compression is defined as:
 $${\rm If }fdr(\overrightarrow {p_ip_j} ) = \emptyset,{\rm then}\theta (\overrightarrow {p_ip_{j + k}} ) \notin fdr(\overrightarrow {p_ip_{j + k}} )$$
If the condition Equation (8) is satisfied, it is impossible to find a point after p j that satisfies  $\theta (\overrightarrow{p_{{i}}p_{{j}+k}}) \in fdr(\overrightarrow{p_{{i}}p_{{j}+k}}) $.
Proof [Proof of Equation (8)] According to Equation (7), there is:
 $$\begin{align} fdr(\overrightarrow{p_{{i}}p_{{j}+1}} ) =fdr(\overrightarrow{p_{{i}}p_{{j}}} ) \cap fdr(\overrightarrow{p_{{j}}p_{{j}+1}} ) \\ fdr(\overrightarrow{p_{{i}}p_{{j}+2}} ) =fdr(\overrightarrow{p_{{i}}p_{{j}+1}} ) \cap fdr(\overrightarrow{p_{{j}+1}p_{{j}+2}} ) \\ \cdots\cdots \\ fdr(\overrightarrow{p_{{i}}p_{{j}+k}} ) =fdr(\overrightarrow{p_{{i}}p_{{j}+k-1}} ) \cap fdr(\overrightarrow{p_{{j}+k-1}p_{{j}+k}} ) \end{align}$$
If  $fdr(\overrightarrow{p_{{i}}p_{{j}}} ) =\emptyset $, then
 $fdr(\overrightarrow{p_{{i}}p_{{j}+k}} ) =\emptyset $, then
 $\theta (\overrightarrow{p_{{i}}p_{{j}+k}}) \notin fdr(\overrightarrow{p_{{i}}p_{{j}+k}}) $.
This section solves two problems related to direction preservation. One solution is to convert the judgment of  $\varepsilon_{\theta }(\overrightarrow{p_{{i}}p_{{j}}}) <\varepsilon_{\theta }$ to that of
 $\theta (\overrightarrow{p_{{i}}p_{{j}}}) \in fdr(\overrightarrow{p_{{i}}p_{{j}}}) $, since
 $fdr(\overrightarrow{p_{{i}}p_{{j}}}) $ can be obtained quickly with time complexity O(1) when
 $fdr(\overrightarrow{p_{{i}}p_{{j}-1}}) $ is known. The other is that the direction termination condition can dynamically determine the range of the direction compression check to ensure the minimum direction compression rate.
3.4. Optimising DOTS algorithm using speed-preserving
Similar to the direction-preserving algorithm, by defining a feasible speed range, as long as the velocity of the compressed trajectory is within the feasible speed range, the original trajectory can be considered to be replaced by the compressed trajectory.
Definition 9 (Feasible speed range):  $\overrightarrow{p_{k}p_{k+1}} (1\le {\rm k}<{\rm n}) $ is one segment of T. The feasible speed range of
 $\overrightarrow{p_{k}p_{k+1}}$, which is denoted by
 $fvr(\overrightarrow{p_{k}p_{k+1}}\vert \varepsilon _{v}) $, is defined as a speed range [v lv h] under the condition of the speed threshold
 $\varepsilon_{v}$. The centre speed is
 $v(\overrightarrow{p_{k}p_{k+1}}) $, the width is
 $2\varepsilon_{v}$,
 $v_{l}=\max(0, \; v(\overrightarrow{p_{k}p_{k+1}} ) -\varepsilon_{v}) $ and
 $v_{h}=v(\overrightarrow{p_{k}p_{k+1}} ) +\varepsilon_{v}$. Then,
 $fvr(\overrightarrow{p_{k}p_{k+1}}\, \vert\, \varepsilon_{v}) =[v(\overrightarrow{p_{k}p_{k+1}} ) -\varepsilon_{v}(\overrightarrow{p_{k}p_{k+1}} ) +\varepsilon_{v}]$.
Given that  $\overrightarrow{p_{{i}}p_{{j}}}\ (1\le i<j\le n) $ is a subset of T, according to the definition of
 $fvr$, is obtained
 $fvr(\overrightarrow{p_{{i}}p_{{j}}}\vert \varepsilon_{v}) $ as:
 $$f\kern-3pt vr(\overrightarrow{p_{{i}}p_{{j}}}\,\vert\,\varepsilon_{v}) =\bigcap_{i\le k< j} {f\kern-3pt vr(} \overrightarrow{p_{k}p_{k+1}}\vert \varepsilon_{v})$$
From here in this paper,  $fvr(\overrightarrow{p_{{i}}p_{{j}}}) $ is used to represent
 $fvr(\overrightarrow{p_{{i}}p_{{j}}}\thinspace\vert\thinspace \varepsilon_{v}) $.
Theorem 1: For the trajectory stream  $T=\{ p_{{1}}, \; p_{{2}}, \; \ldots, \; p_{k}, \; \ldots\} $,
 $v(\overrightarrow{p_{{i}}p_{{j}}}) \in fvr(\overrightarrow{p_{{i}}p_{{j}}}) $ is a sufficient and necessary condition for
 $\varepsilon_{v}(\overrightarrow{p_{{i}}p_{{j}}}) \le\varepsilon_{v}$.
Proof of the sufficient condition. If  $v(\overrightarrow{p_{{i}}p_{{j}}}) \in fvr(\overrightarrow{p_{{i}}p_{{j}}}) $, according to Equation (9), when i ≤ k < j, then
 $v(\overrightarrow{p_{{i}}p_{{j}}}) \in fvr(\overrightarrow{p_{k}p_{k+1}}) $ and
 $\Delta (v(\overrightarrow{p_{{i}}p_{{j}}}), \; v(\overrightarrow{p_{k}p_{k+1}} ) ) \le \varepsilon_{v}$. As
 $\varepsilon_{v}(\overrightarrow{p_{{i}}p_{{j}}}) =\max(\Delta (v(\overrightarrow{p_{{i}}p_{{j}}}), \; v(\overrightarrow{p_{k}p_{k+1}} ) ) ) $ (
 $1\le k<k+1\le j) $,
 $\varepsilon _{v}(\overrightarrow{p_{{i}}p_{{j}}}) \le \varepsilon_{v}$.
Proof of the necessary condition. If  $\varepsilon_{v}(\overrightarrow{p_{{i}}p_{{j}}}) \le \varepsilon_{v}$, then
 $\varepsilon _{v}(\overrightarrow{p_{{i}}p_{{j}}}) =\max(\Delta (v(\overrightarrow{p_{k}p_{k+1}} ) v(\overrightarrow{p_{{i}}p_{{j}}}) ) ) \le \varepsilon _{v}\ (i\le k<j) $, and
 $v(\overrightarrow{p_{{i}}p_{{j}}}) \in fvr(\overrightarrow{p_{k}p_{k+1}}) $. Therefore, there must be
 $v(\overrightarrow{p_{{i}}p_{{j}}}) \in fvr(\overrightarrow{p_{{i}}p_{{j}}}) $.
According to Theorem 1, check  $\varepsilon _{v}(\overrightarrow{p_{{i}}p_{{j}}}) \le \varepsilon_{v}$ is equal to check
 $v(\overrightarrow{p_{{i}}p_{{j}}}) \in fvr(\overrightarrow{p_{{i}}p_{{j}}}) $.
If the value of  $fvr(\overrightarrow{p_{{i}}p_{{j}}}) $ is known, then:
 $$f\kern-3pt vr(\overrightarrow{p_{{i}}p_{{j}+1}})=f\kern-3pt vr(\overrightarrow{p_{{i}}p_{{j}}})\cap f\kern-3pt vr(\overrightarrow{p_{{j}}p_{{j}+1}})$$
According to Equation (10), after checking  $v(\overrightarrow{p_{{i}}p_{{j}}}) \in fvr(\overrightarrow{p_{{i}}p_{{j}}}) $, the time complexity of obtaining
 $fvr(\overrightarrow{p_{{i}}p_{{j}+1}}) $ is reduced from O(N) to O(1); thus, the time complexity of checking
 $v(\overrightarrow{p_{{i}}p_{{j}+1}}) \in fvr(\overrightarrow{p_{{i}}p_{{j}+1}}) $ is O(1).
This is the same as the direction-preserving algorithm's termination condition. The speed termination condition is as follows:
 $$\hbox{If }f\kern-3pt vr(\overrightarrow{p_{{i}}p_{{j}}} ) =\emptyset,\hbox{ then } v(\overrightarrow{p_{{i}}p_{{j}+k}})\notin f\kern-3pt vr(\overrightarrow{p_{{i}}p_{{j}+k}})$$
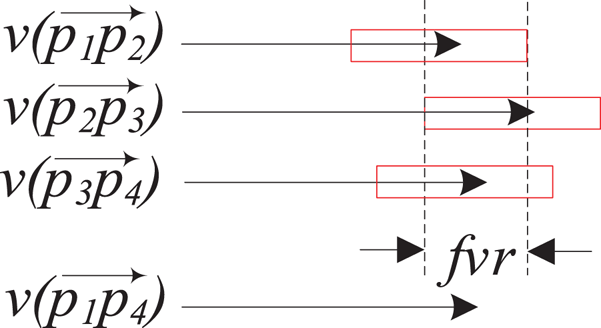
Figure 6 is used to better explain the meaning of Theorem 1 and the speed termination condition.  $v(\overrightarrow{p_{1}p_{2}}) $,
 $v(\overrightarrow{p_{2}p_{3}}) $ and
 $v(\overrightarrow{p_{3}p_{4}}) $ are three continuous route speeds. If the compression speed error is
 $\varepsilon_{v}$, the error allowable range of three speeds can be obtained (represented by rectangles). If speed
 $v(\overrightarrow{p_{1}p_{4}}) $ of the simplified route
 $\overrightarrow{p_{1}p_{4}}$ is in three rectangles, it means that
 $v(\overrightarrow{p_{1}p_{4}}) $ can replace
 $v(\overrightarrow{p_{1}p_{2}}) $,
 $v(\overrightarrow{p_{2}p_{3}}) $ and
 $v(\overrightarrow{p_{3}p_{4}}) $. To improve calculation speed, the intersection
 $fvr$ of
 $v(\overrightarrow{p_{1}p_{2}}) $,
 $v(\overrightarrow{p_{2}p_{3}}) $ and
 $v(\overrightarrow{p_{3}p_{4}}) $ can be obtained from Equation (10). If
 $v(\overrightarrow{p_{1}p_{4}}) $ is in the range of
 $fvr$, the errors between
 $v(\overrightarrow{p_{1}p_{4}}) $ and any of the three speeds will not exceed
 $\varepsilon_{v}$. If
 $fvr$ is ∅, it means that the three speeds do not intersect, so
 $v(\overrightarrow{p_{1}p_{4}}) $ must not belong to
 $fvr$, which is the speed termination condition.
Illustration of Theorem 1 and the speed termination condition.

This section solves two problems related to speed preservation. One solution is to convert the judgment of  $\varepsilon _{v}(\overrightarrow{p_{{i}}p_{{j}}}) \le \varepsilon_{v}$ to that of
 $v(\overrightarrow{p_{{i}}p_{{j}}}) \in fvr(\overrightarrow{p_{{i}}p_{{j}}}) $ since
 $fvr(\overrightarrow{p_{{i}}p_{{j}}}) $ can be obtained as quickly as
 $fdr(\overrightarrow{p_{{i}}p_{{j}}}) $ with time complexity O(1) when
 $fvr(\overrightarrow{p_{{i}}p_{{j}-1}}) $ is known. The other is that the speed termination condition can dynamically determine the range of the speed compression check to ensure the minimum speed compression rate.
3.5. Algorithm implementation
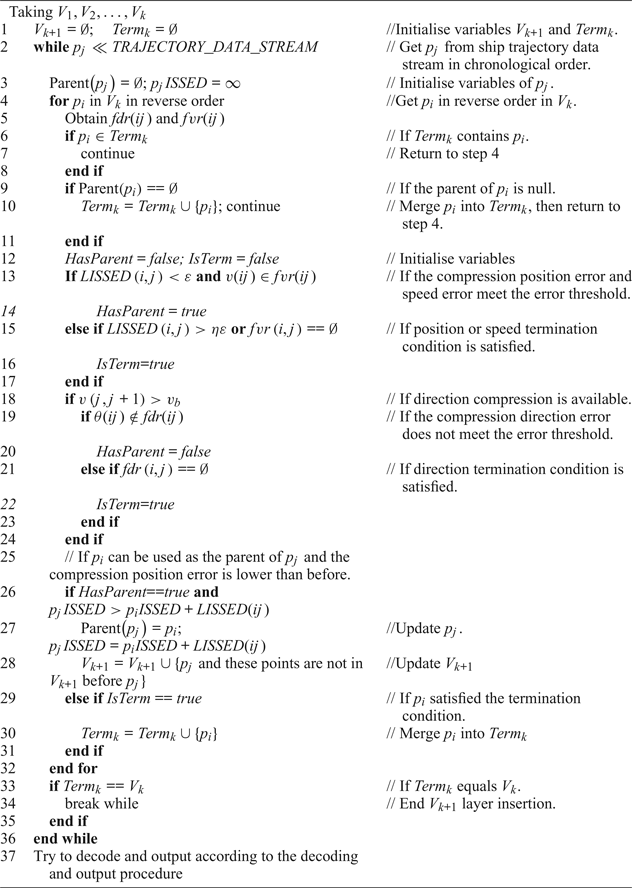
The modified algorithm is called the DOTS* algorithm in this paper, and the layer construction process is shown in Algorithm 2. The process needs to have two variables, V k+1 and Term k. V k+1 stores the points of the current layer, and Term k stores the points in V k that satisfy the termination condition. To reduce the time complexity of calculating  $\varepsilon_{\theta }(\overrightarrow{p_{{i}}p_{{j}}}) \le \varepsilon_{\theta }$ and
 $\varepsilon_{v}(\overrightarrow{p_{{i}}p_{{j}}}) \le \varepsilon_{v}$, in step 4, search for the parent node of p j from V k in reverse order. HasParent indicates whether p j has a parent node, and IsTerm indicates whether p i satisfies the termination condition. If HasParent}==\textit{true, steps 26 to 28 select the minimum ISSED point in V k as the parent of p j and update p j and V k+1. “Merge” means that if the point is not in V k+1, it will be inserted, and otherwise the point is updated. The decoding and output process of DOTS* is the same as that of DOTS.
Layer construction process of DOTS*.

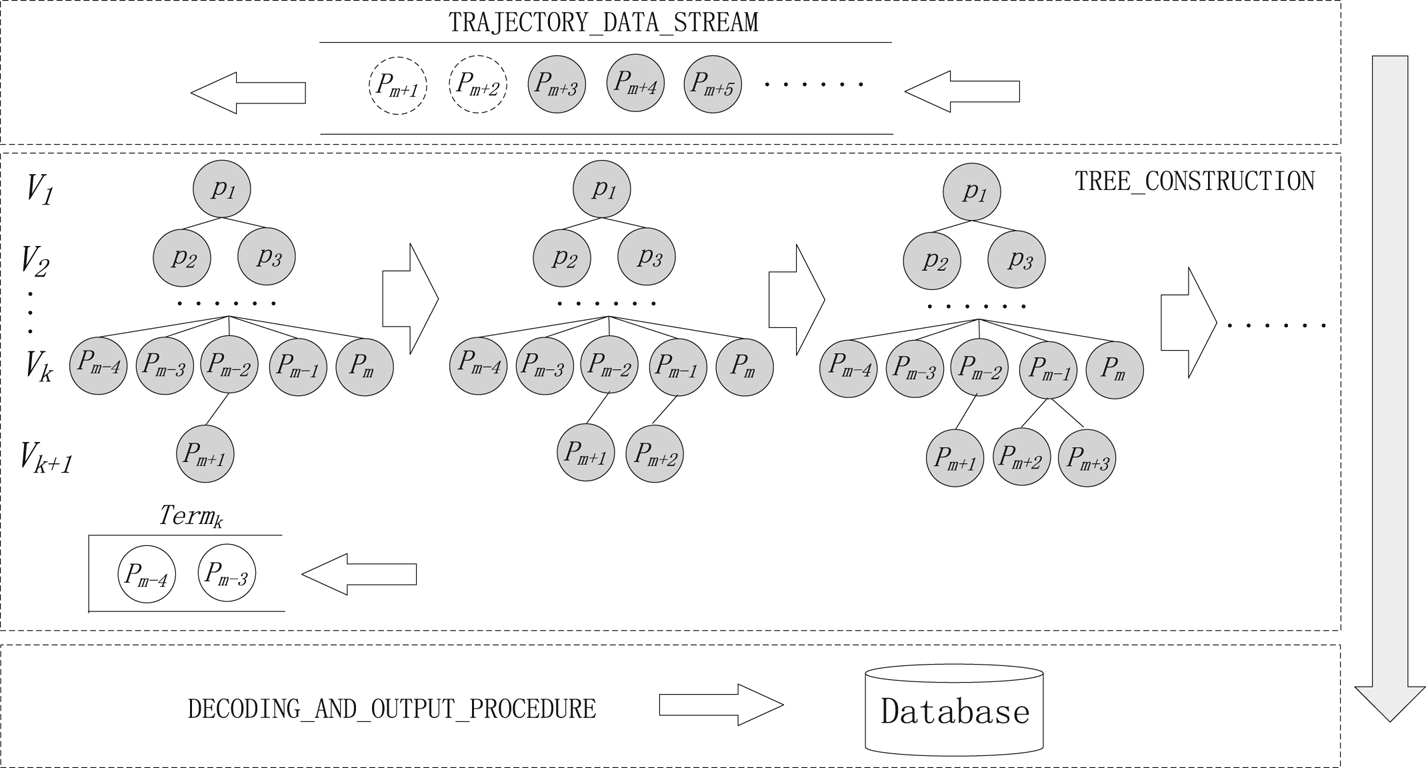
Figure 7 used to better explain Algorithm 2. The figure is composed of three main parts, which are represented by dotted rectangles. TRAJECTORY_DATA_STREAM manages received but unprocessed points and outputs them to the compression path tree in sequence. TREE_CONSTRUCTION is responsible for the construction of the compression path tree. Term k manages the points in the V k layer that satisfy the termination conditions. DECODING_AND_OUTPUT_PROCEDURE is responsible for outputting simplified trajectory points to the database. TREE_CONSTRUCTION is the main part of the algorithm, the V k+1 layer is created in order from left to right in Figure 7. p m+1, p m+2 and p m+3 are newly added points in V k+1. For the points satisfying three conditions of  $LISSED(i, \; j) <\varepsilon $,
 $v(ij) \in fvr(ij) $ and
 $\theta (ij) \notin fdr(ij) $ at the same time (the last condition is judged only when the speed is greater than v b), the point whose
 $p_{i}ISSED+LISSED(ij) $ is the minimum as the parent of p j. In addition, p i satisfying conditions Parent
 $(p_{i} ) ==\emptyset$,
 $LISSED(i, \; j) >\eta \varepsilon $,
 $fvr(i, \; j) ==\emptyset$ and
 $fdr(i, \; j ) ==\emptyset$ is put into Term k. When Term k contains all points in V k, the construction of V k+1 is completed, and then the decoding and output procedure is executed.
DOTS* algorithm structure. The top part is used to manage unprocessed points. The middle part is used to build the compression path tree. The bottom part is used to output the final simplified trajectory points.

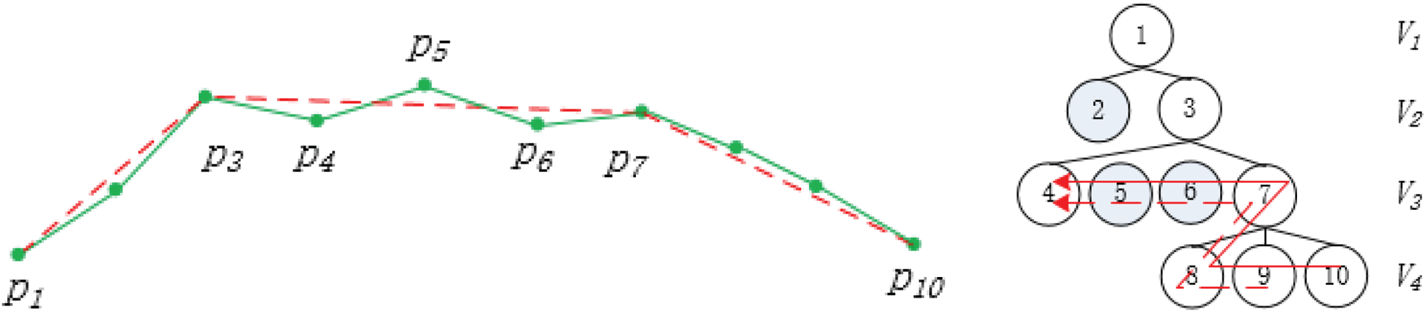
The layer construction process of DOTS* does not increase the time complexity of DOTS. The main reason is that in step 5 in Algorithm 2, the calculation process can be explained using Figure 8. There are 10 points, V 1 to V 3 are the layers that have been processed, and V 4 is the layer being processed. In V 4, after processing p 8, fdr(7, 8) and  $fvr{(7, \; 8) }$ need to be temporarily preserved. When dealing with p 9, fdr(7, 9) and
 $fvr{(7, \; 9) }$ are calculated by fdr(7, 8) and
 $fvr{(7, \; 8) }$ first and then the parent of p 9 is searched in reverse order in layer V 3. fdr(6, 9) and
 $fvr{(6, \; 9) }$ can be calculated by fdr(7, 9) and
 $fvr{(7, \; 9) }$, until V 3 is fully searched. Similarly, when dealing with p 10, fdr(7, 10) and
 $fvr{(7, \; 10) }$ can be calculated by fdr(7, 9) and
 $fvr{(7, \; 9) }$. Therefore, the time complexity of obtaining fdr(ij) and
 $fvr(ij) $ is O(1). It should be noted that there is a list maintained in DOTS* that stores the points that have been received but have not yet been inserted into the tree. If the current point finds a parent in the tree, to ensure the correct calculation of fdr and fvr, DOTS* will insert the current point and these points are not in V k+1 before the current point into the tree (Step 28 in Algorithm 2). For example, in Figure 8, p 5 and p 6 did not find the parent in V 2, but p 7 found the parent p 3, DOTS would ignore p 5 and p 6, and DOTS* would need to insert p 5, p 6 and p 7 into V 3. For points without parents, they need to be inserted into Term k and do not perform the error check, but they must be used to calculate fdr and fvr. Therefore, steps 9 to 11 are located behind step 5.
The left diagram is the original (green solid line) and simplified (red dashed line) trajectories. The right diagram is the corresponding compression path tree. The dashed arrow is the computation direction of fdr and fvr of p 9, and the solid arrow is the computation direction of fdr and fvr of p 10.

Experimental results indicate that when  $v(j, \; j+1) >v_{b}$, the position-preserving algorithm is performed before executing the direction-preserving algorithm, and the simplification result is better than the direction-preserving algorithm only. Because only the direction-preserving algorithm is performed, in order to make the position compression error not too large, the direction error threshold must be set to a smaller value, which is not conducive to obtaining a low compression rate. When the position-preserving algorithm is added, a higher direction error threshold can be set. In the case of a low compression rate, it can not only get a small position error but also retain the steering information.
The time complexity of computing fdr and fvr are O(1), which is the same as that of LISSED. Therefore, the time complexity of DOTS* is O(N 2/M), the same as that of DOTS.
4. EXPERIMENTAL RESULTS
To validate the efficiency and effectiveness of the simplification, the DOTS* algorithm is compared with typical position-preserving and direction-preserving algorithms using the same sample trajectories of 976 ships under the same compression rate. The total number of original AIS position reports is 1,621,319. The data were collected through a network of AIS base stations set up by VTS along the Ningbo coast. The Ningbo Maritime Bureau built 13 base stations and a command centre in 2013, which can achieve full coverage of AIS signals in major port areas. The AIS location data is stored in the form of latitudes and longitudes. Before compression, the geographic coordinates can be converted to planar coordinates using the Mercator coordinate conversion equation (Zhang et al., Reference Zhang, Liu, Zhang, Shi and Cai2015).
4.1. Noise filtering
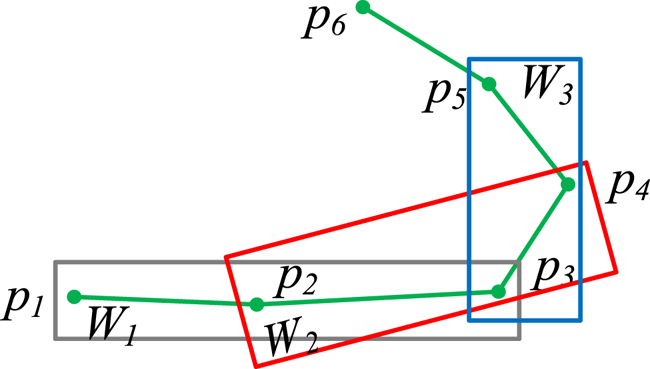
AIS data is never perfectly accurate due to GPS noise and other factors. If the noise is not filtered, the experimental results will be affected. Due to the large inertia of a ship, the ship's trajectory should be continuously changing, and an abnormal jump point can be considered as noise. Based on this idea, this paper uses multiple moving interpolation smoothing to filter the AIS noise in trajectories. The specific steps are explained in Figure 9. There are six points that can be used to calculate the course and speed from p 1 to p 5. p 3 is the checked point. There are three moving windows: W 1, W 2 and W 3 and each window contains three points. In the three windows, the position, course and speed of the first point and the third point, and the time of the three points to interpolate the position, course and speed of the intermediate point are used, respectively. If the difference between the interpolations of a window and the received values is greater than the pre-set threshold value, 1 is added to the noise count of p 3. When the noise count of p 3 is greater than 2, it can be deleted as noise. For the first two points and the last three points of the whole trajectory, if they increase the noise count in the calculation, they are deleted; otherwise, they are retained. The use of multiple interpolation filtering rather than one interpolation filtering is to prevent normal points from being deleted as noise when encountering points with large changes in course or speed, such as p 3. In this paper, the position threshold is set to 0·5 NM, the course threshold is set to 20° and the speed threshold is set to 2 kn. As the course is unstable at low speed, the algorithm only filters the course at the points whose speed is greater than v b. In addition, for distances between two adjacent points larger than 0·5 NM, they are cut into two trajectories.
Multiple moving interpolation smoothing.

4.2. Error definition
To fully measure the effectiveness of the DOTS* algorithm, the algorithm was tested with seven error criteria, including the average SED error  $\overline{\varepsilon (T, \; T^{\prime}) }$, maximum SED error max
 ${\varepsilon (T, \; T^{\prime}) }$, average direction error
 $\overline{\varepsilon_{\theta }(T, \; T^{\prime}) }$, maximum direction error max
 ${\varepsilon_{\theta }(T, \; T^{\prime}) }$, average speed error
 $\overline{\varepsilon_{v}(T, \; T^{\prime}) }$, maximum speed error max
 ${\varepsilon_{v}(T, \; T^{\prime}) }$ and stop retention rate p stop. The stop retention rate is equal to the number of the compression trajectory stops divided by the number of the original trajectory stops. The error equations are as follows:
 $$\begin{align} \overline{\varepsilon (T,T^{\prime})}&=\frac{1}{n}\sum\limits_{i=1}^n {SED(p_{i},p_{i}^{\prime})} \end{align}$$
 $$\begin{align} \overline{\varepsilon_{\theta}(T,T^{\prime})}&=\frac{1}{n-1}\sum\limits_{i=1}^{n-1} \Delta (\theta (\overrightarrow{p_{{i}}p_{{i}+1}}), \theta (\overrightarrow{pred(p_{{i}})succ(p_{{i}+1})})) \end{align}$$
 $$\begin{align} \overline{\varepsilon_{v}(T,T^{\prime})}&=\frac{1}{n-1}\sum\limits_{i=1}^{n-1} \Delta (v(\overrightarrow{p_{{i}}p_{{i}+1}}), v(\overrightarrow{pred(p_{{i}})succ(p_{{i}+1})})) \end{align}$$
 $$\begin{align} \max \varepsilon (T,T^{\prime})&=\max_{1\leq i\leq n} {SED(p_{i},p^{\prime})} \end{align}$$
 $$\begin{align} \max \varepsilon_{\theta }(T,T^{\prime})&=\max_{1\leq i\leq n-1} \Delta (\theta(\overrightarrow{p_{{i}}p_{{i}+1}}),\theta(\overrightarrow{{pred(p}_{{i}}){succ(p}_{{i}+1})})) \end{align}$$
 $$\begin{align} \max \varepsilon_{v}(T,T^{\prime})&=\max_{1\leq i\leq n-1} \Delta(v(\overrightarrow{p_{{i}}p_{{i}+1}}),v(\overrightarrow{{pred(p}_{{i}}){succ(p}_{{i}+1})})) \end{align}$$
 $$\begin{align} p_{stop}&=T_{stop}^{\prime}/T_{stop} \end{align}$$
4.3. Error comparison
In this paper, the stop regions are the regions where the speed is less than 1 kn, and the same stop region does not count repeatedly. We set v b = 4 kn. Through the experiment, it was found that different  $\varepsilon_{\theta }$s and
 $\varepsilon_{v}$s will obtain different upper compression rates. Therefore, to obtain different compression rates,
 $\varepsilon_{\theta }$ and
 $\varepsilon_{v}$ are set to the three combinations of 0·1 kn and 5°, 1 kn and 5° and 4 kn and 20°, respectively.
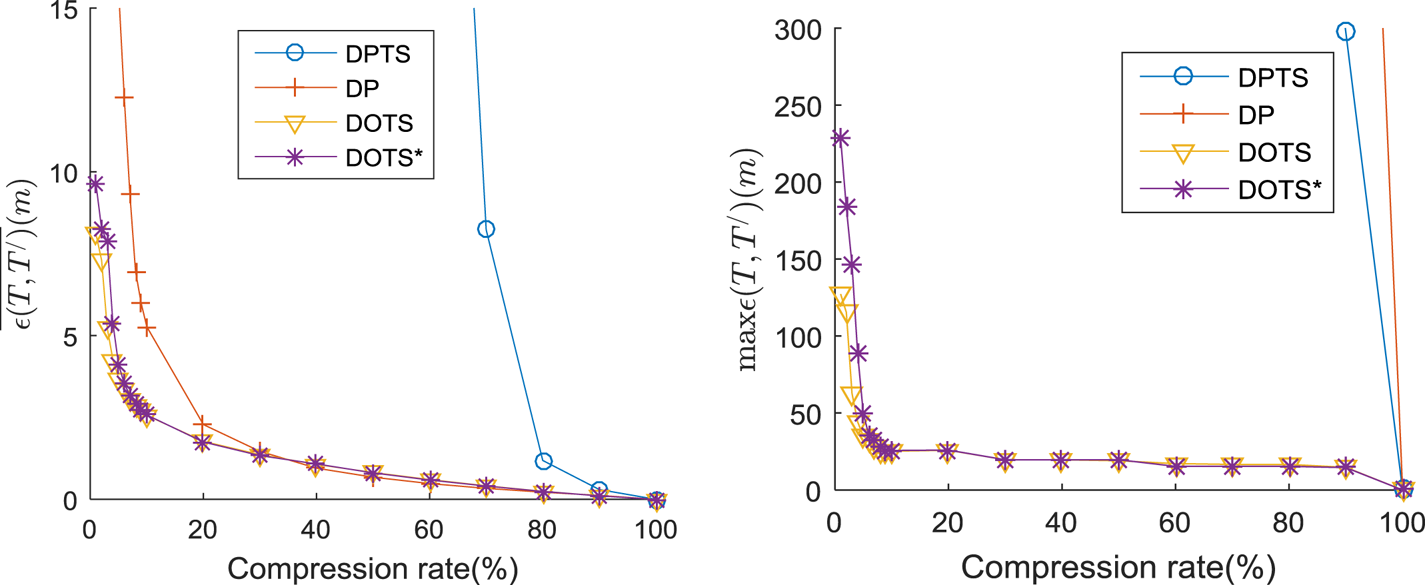
Figure 10 gives the  $\overline{\varepsilon (T, \; T^{\prime}) }$ and max
 ${\varepsilon (T, \; T^{\prime}) }$ comparisons of the four algorithms. It can be seen that the
 $\overline{\varepsilon (T, \; T^{\prime}) }$ and max
 ${\varepsilon (T, \; T^{\prime}) }$ of DOTS* are larger than those of DOTS under a very small compression rate. The main reason is that DOTS* considers the direction and speed changes and, to achieve a small compression ratio, DOTS* must set a larger ε than DOTS under a very small compression rate. However, when the compression ratio is not very small, DOTS* uses LISSED as the compression scale. This only changes the position of the sampling point, and the influence on the compression ratio is not obvious. The reason why
 $\overline{\varepsilon (T, \; T^{\prime}) }$ and max
 ${\varepsilon (T, \; T^{\prime}) }$ of DPTS and DP are significantly larger than those of DOTS* is that DPTS and DP do not preserve the time characteristics of the trajectory.
Average SED error (left) and Maximum SED error (right) comparison.

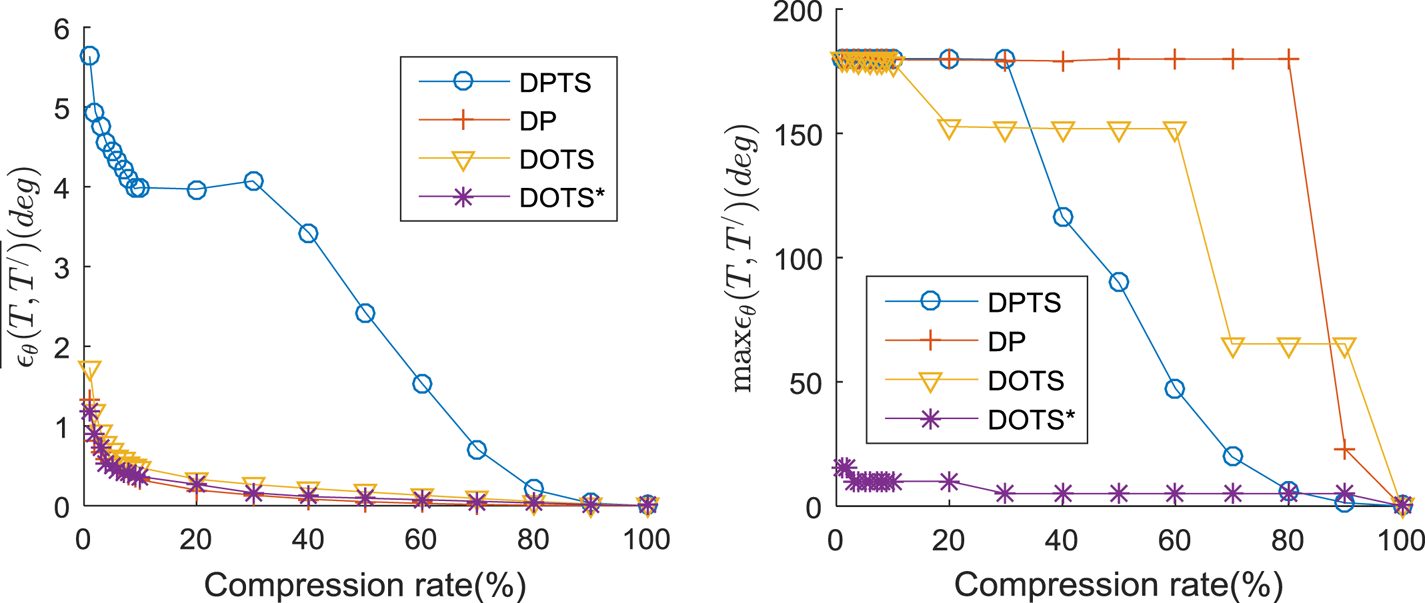
Figure 11 shows the  $\overline{\varepsilon_{\theta }(T, \; T^{\prime}) }$ and max
 ${\varepsilon_{\theta }(T, \; T^{\prime}) }$ comparisons of the four algorithms. As a ship's course is unstable when stopping or sailing at a low speed, the experiment only compares the direction error of the speed greater than 4 kn. The AIS data volume is large and contains a large number of stop positions. Therefore, the
 $\overline{\varepsilon_{\theta }(T, \; T^{\prime}) }$ of DOTS* is not much different from other algorithms except for DPTS. However, DOTS* preserves the points with large directional changes, thus making its max
 ${\varepsilon _{\theta }(T, \; T^{\prime}) }$ significantly better than those of other algorithms.
Average direction error (left) and Maximum direction error (right) comparison.

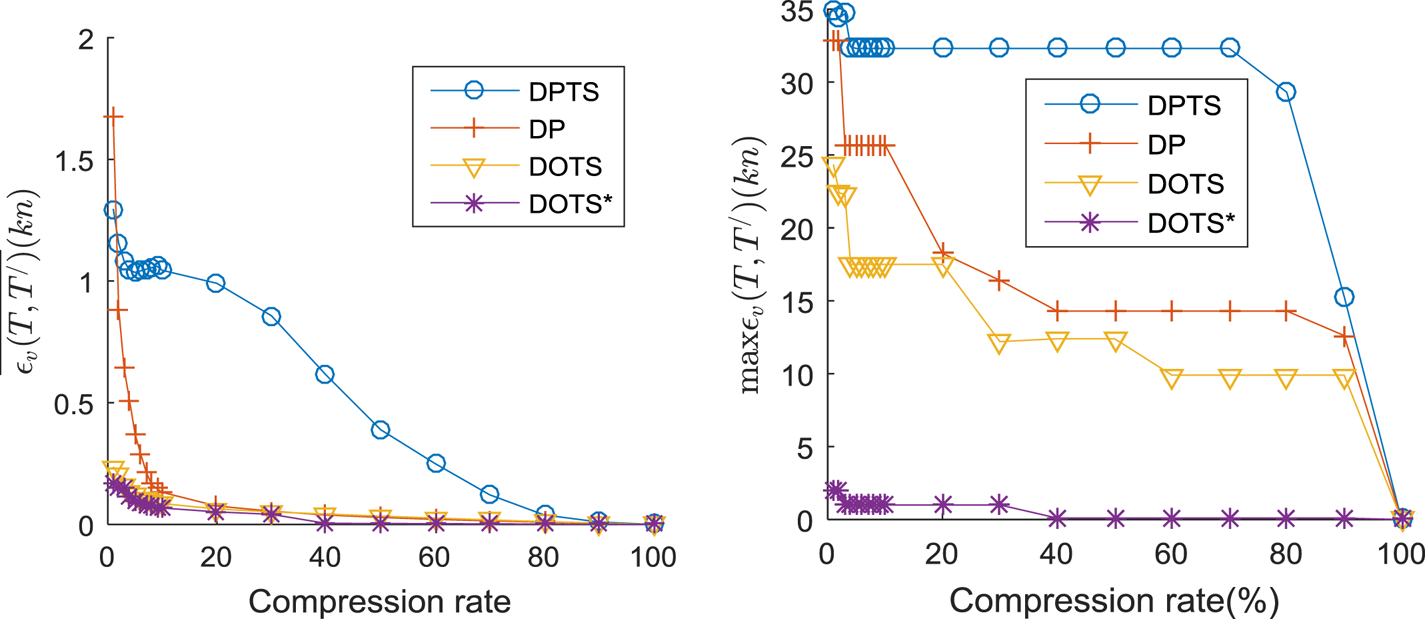
Figure 12 gives the  $\overline{\varepsilon_{v}(T, \; T^{\prime}) }$ and max
 ${\varepsilon _{v}(T, \; T^{\prime}) }$ comparisons of the four algorithms. The
 $\overline{\varepsilon _{v}(T, \; T^{\prime}) }$ of DOTS* is close to that of DOTS but is significantly smaller than those of DP and DPTS, mainly because both DOTS* and DOTS preserve the time information of the trajectory. However, DOTS* limits the magnitude of the speed change and thus, max
 ${\varepsilon_{v}(T, \; T^{\prime}) }$ is significantly better than for the other algorithms.
Average speed error (left) and Maximum speed error (right) comparison.

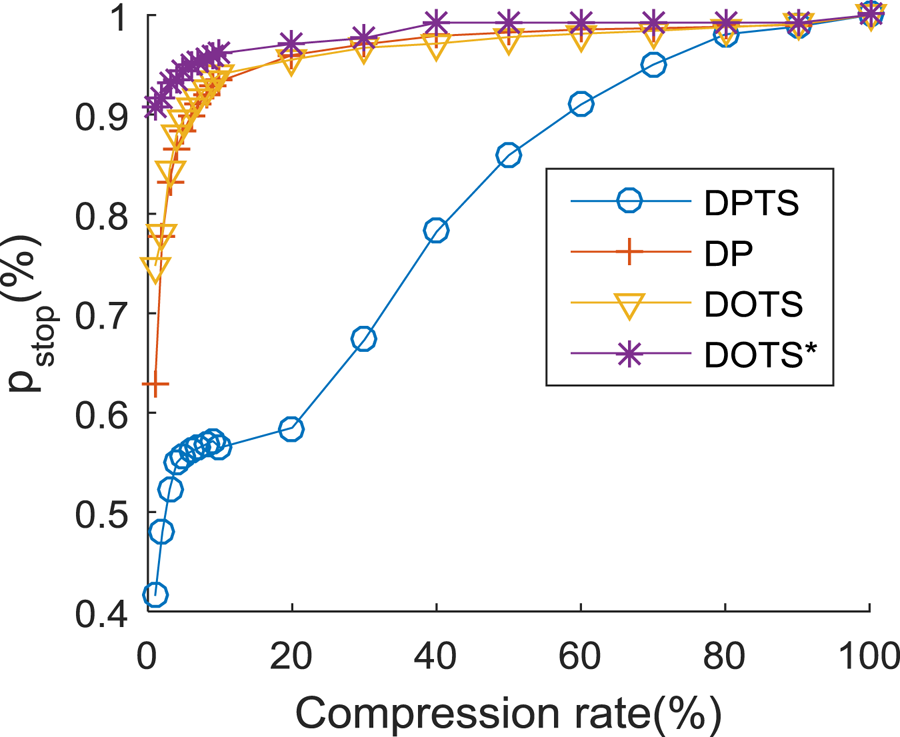
Figure 13 shows the p stop comparisons of the four algorithms. As DOTS* considers speed preservation, it can preserve more stops than the other algorithms at the same compression rate.
Stop retention rate comparison.

4.4. The validation of visual observation
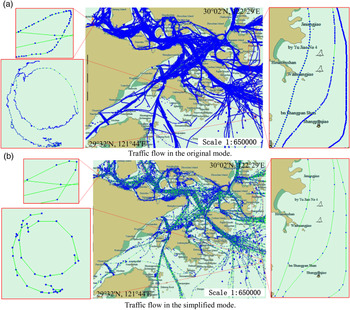
To evaluate the visual effectiveness of the DOTS* algorithm and to analyse the macroscopic traffic flow situation, the original and simplified AIS trajectories were imported into an Electronic Chart Display and Information System (ECDIS). The total number of simplified AIS positions is 166,007, which is approximately 10% of the original trajectories. It can be seen from Figure 14 that the simplified trajectories preserve the shape of the original trajectory very well, including the stand on vessel (right side diagram), the course changing vessel (upper left corner diagram) and the anchored vessel (lower left corner diagram). Therefore, the simplified trajectories can describe the macroscopic traffic flow situation almost as accurately as the original trajectories.
Macroscopic traffic flow comparison before and after compression.

4.5. Direction-preserving
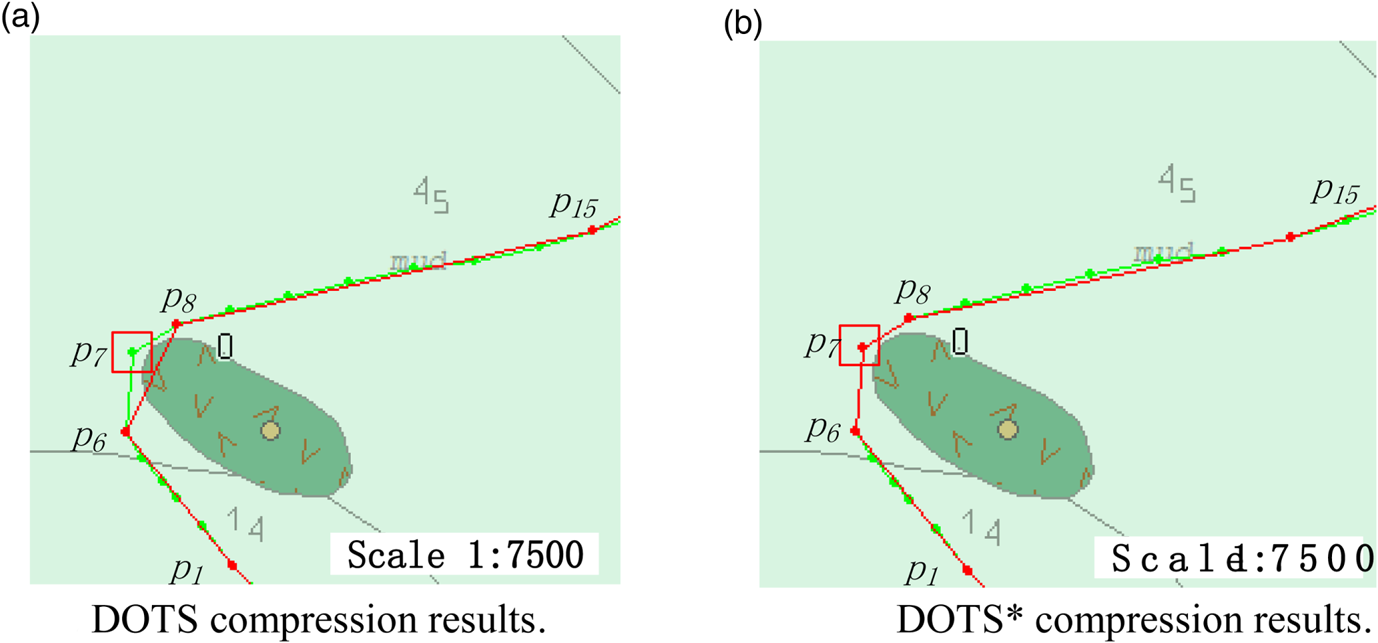
Figure 15 shows the effect of compressing a vessel trajectory around a shoal by using DOTS and DOTS* at the same LISSED threshold. The starting turning point is p 6, the ending turning point is p 8,  $\theta (\overrightarrow{p_{6}p_{7}}) =5$,
 $\theta (\overrightarrow{p_{7}p_{8}}) =59$ and
 $\theta (\overrightarrow{p_{6}p_{8}}) =26$. As
 $\hbox{LISSED}(6, \; 8) <\varepsilon $, in the simplified trajectory compressed by DOTS,
 $\overrightarrow{p_{6}p_{7}}$ and
 $\overrightarrow{p_{7}p_{8}}$ are replaced by
 $\overrightarrow{p_{6}p_{8}}$. DOTS made the simplified trajectory cross the shoals, but the original trajectory was around the shoals. In the DOTS* algorithm, fdr(6, 7) = [−5, 15], fdr(7, 8) = [49, 69], and
 $fdr(6, \; 8) =fdr(6, \; 7) \cap fdr(7, \; 8) =\emptyset $; thus,
 $\theta (\overrightarrow{p_{1}p_{3}}) \notin fdr(6, \; 8) $, that is,
 $\varepsilon_{\theta }(\overrightarrow{p_{6}p_{8}}) >\varepsilon_{\theta }$. Point p 7 was preserved, and important course change information was not lost.
Preserving important direction changing information.

4.6. Stop retention
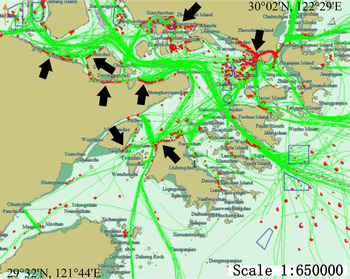
Figure 16 shows the distribution of stop locations in the study area, including berthing, anchoring and drifting ships. The stop locations within or near the anchorage are anchored ships. The stop locations near the land are berthing ships. The arrows indicate some of the main wharf areas of Ningbo Zhoushan port.
Stop area distribution. The red points are the stop locations, and the areas surrounded by blue solid lines are anchorages.

5. CONCLUSIONS
The wide adoption of AIS has led to a huge volume of spatial trajectories. To reduce memory requirements and delete redundant data, an AIS trajectory online simplification algorithm is proposed. First, this paper describes previous work on AIS trajectory simplification, and analyses the problems of these algorithms. Subsequently, the paper describes research on trajectory simplification from three aspects: position-preserving algorithms, direction-preserving algorithms and speed-preserving algorithms. Second, an improved DOTS online compression algorithm is proposed, which is called DOTS*. In order not to increase the time complexity of DOTS, the concepts of FDR and FVR are used to solve the problem of direction preservation and speed preservation. Finally, to validate the efficiency and effectiveness of the proposed algorithm, DOTS* is compared with typical position-preserving and direction-preserving algorithms. Comparisons include average SED error, maximum SED error, average direction error, maximum direction error, average speed error, maximum speed error and stop retention rate. The experimental results show that, at the same compression rate, DOTS* has obvious improvement in information preservation. To evaluate the visual effectiveness of the DOTS*, the results of macro traffic flow compression, direction-preserving and stop retention were visualised. Simplified trajectories can describe the macroscopic traffic flow situation almost as accurately as the original trajectories. Direction preservation can avoid the change of original trajectory semantics meaning. Distribution of stop locations conforms to anchorage and wharf planning. The above statistical analysis and visualisation show DOTS* can preserve the position, direction and speed information well using online compression.
The limitation of this paper is that the error threshold is set uniformly. For different types and sizes of ships, stability and manoeuvrability are different; intuitively, large ships and small ships, container ships and oil tankers should be considered separately. In addition, hydrological conditions should be taken into consideration in compression. This requires the combination of electronic chart data. Future research will take these influencing factors into consideration to obtain a more scientific and more satisfactory simplified trajectory. A future extension study is to use the DOTS* algorithm for incremental learning of ship behaviour to improve the ability of automatic perception of changes in the marine traffic environment.
FINANCIAL SUPPORT
This work was partly supported by “the National Natural Science Foundation of China” (grant number 51709165) and the Fundamental Research Funds for the Central Universities (grant number 3132015009). The author gratefully acknowledges support from the Liu Kong Aiju Education Fund in Ningbo University.