


1. Introduction
Ice thickness and bed topography are essential boundary conditions for numerical modelling studies of the Greenland ice sheet. The previous bed-elevation dataset available for such applications was generated over a decade ago from data collected during the 1970s (Reference Letréguilly, Huybrechts and ReehLetréguilly and others, 1991). With recent improvements in the quality of other boundary conditions (e.g. ice surface elevation and accumulation), the accuracy of this dataset now poses a serious limitation to reliable simulations of the ice sheet’s dynamics and future behaviour. In this paper, we present a new bed-elevation dataset specifically developed for numerical modelling applications that addresses this limitation. In 1993, a 150 MHz ice-penetrating radar (IPR), developed and operated by the Remote Sensing Laboratory, University of Kansas, was included in the NASA-funded Program for Arctic Regional Climate Assessment (PARCA) (Reference ThomasThomas and others, 2001). Yearly airborne surveys since then have yielded a wealth of new ice-thickness data (Reference GogineniGogineni and others, 2001). Here we report on the use of these thickness data, in conjunction with the data collected during the 1970s, the latest surface digital elevation model (DEM) and a new bathymetric dataset, to produce an improved ice-thickness and bed dataset for the island of Greenland and the surrounding continental shelf. A comparison with the previously available bed-elevation data was undertaken to investigate the differences between the old and new datasets.
2. Data Sources and Methodology
Detailed descriptions of the data used to derive the surface DEM and ice-thickness grid have been presented elsewhere (Reference Bamber, Ekholm and KrabillBamber and others, 2001a,Reference Bamber, Layberry and Goginenib), and, as a consequence, only a summary of the most relevant points is presented here. The primary dataset used to produce the ice-thickness grid was the IPR data collected by the University of Kansas between 1993 and 1999 (Reference GogineniGogineni and others, 2001). A previous, and fairly extensive, set of IPR data was collected during the 1970s by the Technical University of Denmark (DTU) (Reference Bogorodsky, Bentley and GudmandsenBogorodsky and others, 1985).These data had, however, relatively poor navigation, resulting, as discussed below, in poor accuracy for the derived bed elevation. Nonetheless, these older data were found to be useful in areas where there was sparse coverage by the Kansas data. The coverage of the DTU and Kansas IPR data used here is shown in Figure 1.
Plot of the IPR flight-lines flown in the 1970s by the DTU (in grey) and in the 1990s by the University of Kansas

The surface DEM was derived from a variety of sources depending primarily on whether the surface was ice or rock. Over the former, the primary data source was a combination of European Remote-sensing Satellite-1 (ERS-1) and Geosat radaraltimetry (Reference Bamber, Ekholm and KrabillBamber and others, 2001a). Biases related to the local surface slope were removed with the aid of a spatially extensive and extremely accurate (∼10cm) dataset of airborne laser measurements (Reference Krabill, Thomas, Martin, Swift and FrederickKrabill and others, 1995). Over exposed rock outcrops and in coastal areas a combination of airborne stereo-photogrammetry, synthetic aperture radar (SAR) interferometry and digitized cartographic maps was used. These various datasets were combined to produce a DEMat roughly 1km postings (Reference Bamber, Ekholm and KrabillBamber and others, 2001a). This is a higher resolution than is typically required formodelling purposes and is greater than the spatial density of the ice-thickness data. The DEM was therefore regridded to a resolution of 5 km, to match the ice-thickness grid using linear-distance weighted averaging. Although 5km is higher than the resolution generally used by numerical models (typically 20 km), more detailed, regional studies using, for example, first-order models of individual basins or flow features can require this level of detail (Reference Joughin, Fahnestock, Macayeal, Bamber and GogineniJoughin and others, 2001). This is discussed further below.
The bed DEM was obtained by subtracting ice thicknesses, for the grounded part of the ice sheet, from the surface DEM. Areas of floating ice were identified manually and not included in this step. Bed elevations were extended to include the continental shelf (necessary for past glacial model runs) using the International Bathymetric Chart of the Arctic Ocean (IBCAO). This has a resolution of 2.5 km (Reference Jakobsson, Cherkis, Woodward, Macnab and CoakleyJakobsson and others, 2000; Reference JakobssonJakobsson, 2002). It was sub-sampled at 5 km and then merged into the bed DEM by forcing the bathymetry to match the elevations in the bed DEM at the land/ocean boundary.
3. Data Accuracy
Crossover analysis was used to assess the accuracy of the ice-thickness datasets, both for internal consistency and for consistency between different years. The 1970s data had an average crossover difference of 130 m, due primarily to errors in the navigation data rather than the actual thickness measurement. The 1990s data had an average crossover difference of 15 m. We believe that these differences provide a reasonable estimate of the accuracy of the individual thickness measurements from the two datasets. The accuracy of the gridded dataset, however, is dependent on the proximity to, as well as the source of, the IPR data. Clearly the highest accuracies are on the order of, or better than, 15 m1. The lowest accuracies will be in areas where interpolation from DTU data was necessary.
The data were averaged locally in a polar stereographic coordinate system using a linear-distance weighting method, resulting in a quasi-regular grid of mean x, y, z with roughly 5 km spacing. The thickness, z, at each gridpoint was given by the weighted average of the data within the search radius of the cell centre, and the mean x, y values by the similarly weighted averages of the positions of each radar data point. The 1990s data were given a factor 10 higher weighting relative to the 1970s data, based on the error estimates derived from the crossover analysis. This initial averaging of the data reduced the number of points used in the final interpolation, decreased the disparity between along- and across-track spacing, and allowed filtering on the basis of the standard deviations of the mean ice thicknesses and other criteria. Initial filtering involved the removal of data points with only one contributing depth estimate. This removed a small number of 1990s gridpoints that appeared to be due to errors in the navigation data.
Ordinary kriging was used to interpolate the averaged data onto a regular grid. The geostatistical properties of the data were obtained by computing a semivariogram. Here, we used a single semivariogram for the whole dataset, which was based on a spherical model with a sill of 80 km (beyond which the spatial correlation in the data can be ignored) and a relative nugget effect of 0.3. The nugget value of 160 m2 is the variance for vanishingly small lag and represents measurement error (Reference Deutsch and JournelDeutsch and Journel, 1998).
Coverage over the ice sheet with surface elevation data was excellent due to the availability of the geodetic mission data from Geosat (providing dense coverage up to 72° N) and ERS-1 geodetic phase data, providing dense coverage north of 72° N (Reference Bamber, Ekholm and KrabillBamber and others, 2001a). The accuracy of the surface DEM over the ice sheet was found to be a function of the local slope (averaged over 5 km) and ranged between –0.38±1.07 m and –4.43±6.12 m for slopes of 0.1– 1.2°. The mean accuracy over the whole ice sheet was –0.18±5.37 m. Over ice-free terrain the accuracy varied between about 20 and 200 m depending on the type of data available (Reference Bamber, Hardy and JoughinBamber and others, 2001a).
No estimates for the accuracy of the IBCAO data are provided in the literature, but as with all the other datasets discussed here, the gridded dataset was derived primarily from linear track data (ships and submarines in this instance) and interpolated onto a regular grid. In the vicinity of data points, the accuracy is likely to be on the order of 10–20 m, while for quite large areas, particularly those where multi-year sea ice is present, the accuracy is likely to deteriorate to a few hundred metres. The accuracy of the bathymetry is only a consideration for paleoclimate reconstructions, but, as discussed later, the ice sheet appears not to have extended significantly during glacial periods.
4. Results and Discussion
The ice-surface DEM is shown in Figure 2. The surface topography, as would be expected, captures all the features associated with ice flow, and there is little degradation of this dataset, compared with the 1km original, for the purposes of modelling ice dynamics. Drainage basins and ice divides can be clearly identified, and even relatively small features, such as the valley in which Petermann Gletscher flows (see Fig. 3 for location), are well defined. It should be noted, however, that DEM resolution can affect the estimate of runoff calculated. This is because runoff models usually parameterize temperature based on latitude, longitude and elevation (Reference Van de Wal and EkholmVan de Wal and Ekholm, 1996). A comparison of the runoff calculated using a 10 and 3 km resolution DEM of the ice sheet produced a difference of 13%, equivalent to 40 km3 a–1 (Reference Reeh and StarzerReeh and Starzer, 1996). The explanation for this was believed to be associated with the smoothing-out of valley floors, raising their mean elevation above the threshold for melt to take place, in the case of the coarser DEM. A comparison between a 2.5 km and our 1 km DEM showed little difference, suggesting that, at resolutions below 2.5 km, this effect is not important (Reference Bamber, Hardy and JoughinBamber and others, 2001a). There may, however, be a resolution-induced effect at 5 km.
A planimetric shaded relief plot of the surface topography over Greenland from the 5 km resolution DEM presented here. Contours for 1600 m and above are plotted at 200 m intervals.

Contour plot of bed elevations over the ice sheet and surrounding continental shelf. Areas in Greenland where the bed elevation was below sea level are shaded to indicate basal depressions. The contour interval used is 500 m, but countours at ±250 m are also plotted. The box in the northeast indicates the coverage of the shaded relief plot in Figure 4.

Figure 3 is a contour plot of the bed elevations over Greenland and the continental shelf. The shelf is fairly extensive on the eastern side of the island, particularly at around 66° N, reaching a minimum depth of around 580 m below sea level between Greenland and Iceland. In fact, the continental shelf for the Arctic Ocean comprises as much as 53% of its total area (Reference JakobssonJakobsson, 2002), which is substantially higher than the equivalent figure for any other ocean. These facts might suggest the ice sheet has the potential for considerable expansion during glacial conditions. Geological and numerical modelling evidence suggests, however, that the ice sheet was significantly extended only in the south at the Last Glacial Maximum (Reference SiegertSiegert, 2001) and that its total volume was about 12% greater than it is at present.
Areas below sea level in Figure 3 beneath the ice sheet are shaded to highlight the bed lows. There is an extensive bed depression in the centre of the island, caused by loading of the ice sheet on the lithosphere. There are, however, several areas close to the margin (where isostatic compensation is less dominant) that are also substantially below sea level. Of particular note is the fairly continuous and deep (particularly to-ward the margin) trench in the northeast sector of Greenland. This trench lies close to the northeast Greenland ice stream (NEGIS) (Reference Fahnestock, Bindschadler, Kwok and JezekFahnestock and others, 1993), and toward the margin would be below sea level even without the presence of the ice sheet (Reference Bamber, Layberry and GogineniBamber and others, 2001b). It seems likely, therefore, that the location of the NEGIS and the trench are related. The impact of basal topography on the existence and characteristics of the NEGIS has also been investigated in detail using velocity data from SAR interferometry and inverse modelling (Reference Joughin, Fahnestock, Macayeal, Bamber and GogineniJoughin and others, 2001).
Figure 4 is a shaded relief plot looking down the trench towards the coast. To indicate the location of the ice stream, 50 and 100 ma–1 contours of balance velocity have been superimposed on the topography. Balance velocities are an excellent proxy for the depth-averaged, steady-state velocity field (Reference Bamber, Hardy and JoughinBamber and others, 2000). It is evident that the area of enhanced flow follows the trench very closely in its upper reaches. Toward the margin a second area of enhanced flow, from the north, can be seen to flow into the deepest part of the trench. Several bed-elevation profiles across the trench are plotted in Figure 5a. The depth of the trench varies between around 250m in the upper part and as much as 650 m near the margin.
A shaded relief perspective plot of the 5 km resolution bed-elevation data presented here. The view is to the northeast, looking down the direction of flow of the NEGIS, toward the coast. The region plotted is shown by the box in Figure 3. The 50 and 100 m a–1 contours from balance velocities for the ice sheet have been superimposed to indicate the location of the NEGIS. The three solid lines indicate the location of the cross-profiles plotted in Figure 5a and b.

(a) Three profiles of bed elevation running across the area where the NEGIS flows. The locations of the profiles are indicated in Figure 4. (b) As for (a), but for a 20 km smoothed version of the bed elevations to indicate the character of the bed topography captured by a typical numerical model of the ice sheet.
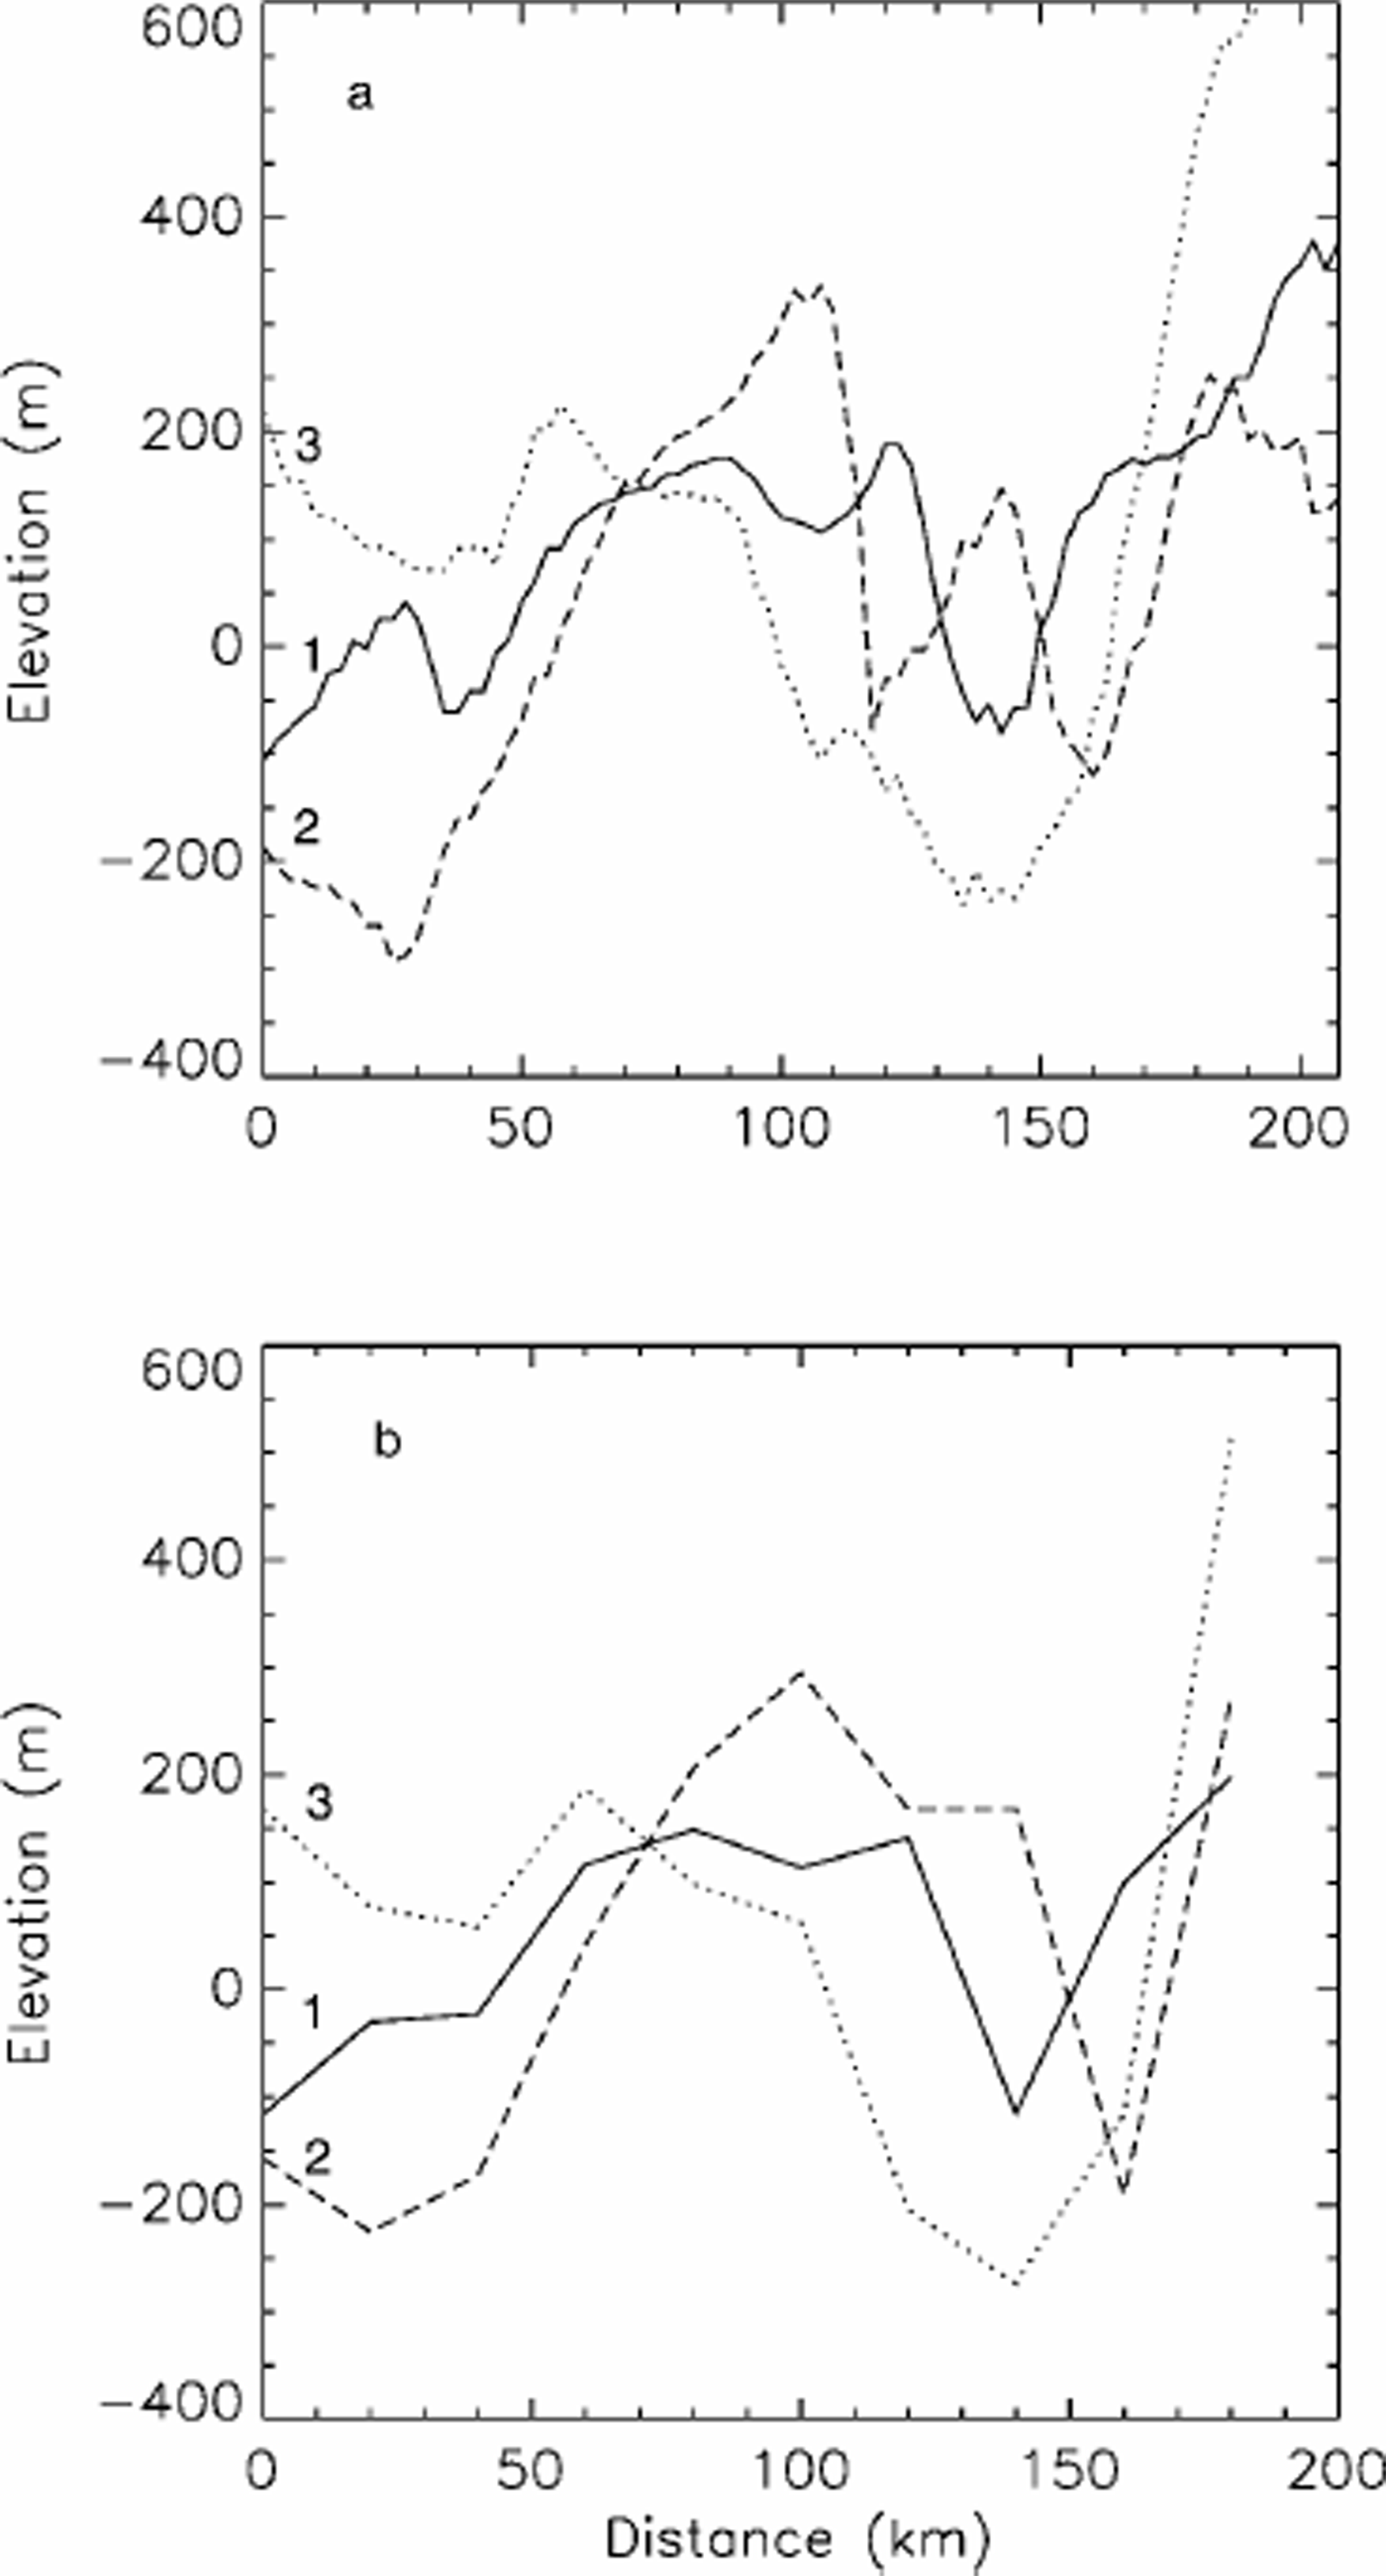
For profiles 1 and 2, the ice thickness, Z, increased by about 15% because of the trench. This extra thickness of ice has two effects: (i) it increases the driving stress by 15%, and (ii) it produces a warmer layer of ice near the bed. If the exponent in Glen’s flow law is taken to be 3, then the ice-surface velocity is proportional to the fourth power of Z. A 15% increase in Z can therefore result in a 75% increase in velocity (from (i) above) without any need for invoking additional processes at the bed such as basal sliding. We suggest, therefore, that to adequately model the NEGIS, a bed topography that contains and adequately resolves the trench seen in Figure 4 is required. To investigate this further, the 5 km grid was regridded, using bilinear interpolation, to 20 km. This is the typical resolution used for modelling the ice sheet (Reference Huybrechts, Letréguilly and ReehHuybrechts and others, 1991; Reference Letréguilly, Huybrechts and ReehLetréguilly and others, 1991). The three cross-profiles shown in Figure 5a are reproduced for this 20 km dataset in Figure 5b. Profile 3 captures the trench fairly well, as it is a relatively broad feature near the margin (Fig. 3). In the upstream section, however, it is only partially resolved and, for profile 1, by a single gridpoint only.
Bed elevations for the NEGIS derived from our 5 km surface DEM and the Letréguilly grid are shown in Figure 6. There is no evidence of a trench in the upper reaches, and the general form of the topography looks very different. It seems likely, therefore, that models using this ice-thickness dataset to define the bed topography would be unlikely to capture the NEGIS, even if run at a suitable resolution, with longitudinal stresses and/or an ice-stream sub-model included. We also note that, for the upper 400 km of the NEGIS, the driving stresses are relatively high (50–100 kPa) (Reference Layberry and BamberLayberry and Bamber, 2001) and thus internal deformation will make a significant contribution to the velocity of the ice here. For this portion of the NEGIS an ice-stream model, using vertically integrated stresses, is therefore not appropriate. It is only in the lower third, when the NEGIS reaches the deep trough near the margin (Reference Layberry and BamberLayberry and Bamber, 2001), that an ice-stream model may be applicable.
A shaded relief perspective plot of the bed-elevation data, derived from the old ice-thickness dataset (Reference Letréguilly, Huybrechts and ReehLetréguilly and others, 1991) for the NEGIS. The coverage and viewing geometry is identical to Figure 4.

The bed topography for the whole of Greenland, derived from the Letréguilly grid, is plotted in Figure 7. Comparison with the new bed DEM, shown in Figure 3, indicates that there are substantial differences. For example, the basal topography around the glaciers discharging into the northern margin of the ice sheet are poorly represented in Figure 7. There is no clear depression for Humboldt Gletscher, and the shapes of the troughs beneath Petermann and Ryder Gletscher are poorly defined. Elsewhere, particularly near the margins, the Letréguilly grid fails to capture the detail that may be crucial for adequately representing the flow behaviour of relatively narrow outlet glaciers. These outlet glaciers are, however, important in determining the mass balance and dynamic behaviour of the ice sheet, as they are responsible for almost all the discharge of solid ice (i.e. mass not lost by ablation).
Contour plot of bed elevations for the whole of the ice sheet, derived from the old ice-thickness dataset (Reference Letréguilly, Huybrechts and ReehLetréguilly and others, 1991). Other details are as for Figure 3.

5. Conclusions
Two new datasets have been combined to produce a high-resolution and -accuracy DEM for the bed of Greenland and the surrounding continental shelf. The new bed-elevation data show considerably more detail over Greenland than was previously available, especially near the margins, around outlet glaciers, where many of the airborne surveys have been concentrated in recent years. The new bed data indicate that a well-defined and extensive, but relatively narrow, trench lies beneath the upper part of the NEGIS, a feature that is not identified in earlier bed datasets. We conclude that the use of this new, improved bed topography is a prerequisite for adequately modelling the ice stream, as is a model with sufficient resolution to resolve the basal trench and one which incorporates internal ice deformation. We also conclude that the increased ice thickness, due to the presence of the trench, is sufficient to increase ice-deformation velocities by about 75% without the need to invoke any other mechanisms. In addition, the deeper ice is likely to be warmer, and therefore softer, and deformation is also likely to be enhanced within the ice stream due to reorientation of the crystal fabric. If these factors are taken into account, it is possible to explain the velocities within the upper two-thirds of the ice stream through processes of internal deformation alone in a similar manner to the proposed flow characteristics of Jakobshavn Isbræ (Reference Echelmeyer and HarrisonEchelmeyer and Harrison, 1990; Reference Iken, Echelmeyer, Harrison and FunkIken and others, 1993).
Acknowledgements
The work in this paper was funded by U.K. Leverhulme Trust grant F/182/BJ.



