I. INTRODUCTION
The ever increasing demand for high data rates in communication systems such as terrestrial trunked radio (TETRA) at 450 MHz, universal mobile telecommunications system – at 900 and 2.1 GHz – and worldwide interoperability for microwave access (WiMAX) – at 2.45 and 3.5 GHz – and long-term evolution, requires complex modulation schemes such as 64 quadrature amplitude modulation and orthogonal frequency division multiplexing. These standards generate signals with high peak to average ratios, and therefore conventional power amplifiers are operated in large back-off in order to meet the linearity requirements requested by the 3rd Generation Partnership Project (3GPP) specifications [1]. Under these conditions, the efficiency of the power amplifier is reduced considerably. To cope with this issue, advanced transmitter techniques such as linear amplification through nonlinear components [Reference Cox2] and delta sigma transmitter [Reference Johnson and Stapleton3] have been proposed. These techniques transform the amplitude and phase modulated signal into a signal with constant amplitude before amplification. Shaping of the quantization noise permits high signal-to-noise ratios in the vicinity of the desired frequency band. As a result, efficient but nonlinear switch mode amplifiers can be used without deteriorating the linearity of the transmitted signal. Compared to other compound III–V semiconductor materials, gallium nitride (GaN) provides some specific material characteristics including wide bandgap, high breakdown field, high thermal conductivity, and high saturated velocity. As a result GaN is suitable for the implementation of high-power amplifiers with high-power densities as high as 40 W/mm, and for high frequencies up to 100 GHz.
The present paper is arranged as follows. In the first part a class AB amplifier for WiMAX applications, at 3.5 GHz is proposed that is integrated into a low temperature cofired ceramics (LTCC) package. In the second part a class S demonstrator is presented that operates in the TETRA band at 450 MHz. For each of the two approaches, design and implementation aspects are complemented by integration aspects including thermal management issues.
II. CLASS AB POWER AMPLIFIER
A) Design and implementation of class AB power amplifier
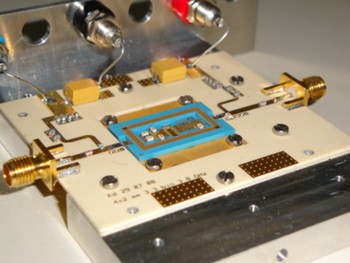
For WiMAX applications, a class AB amplifier was designed in the frequency range from 3.3 to 3.8 GHz. The output power should be higher than 44 dBm and the power added efficiency (PAE) about 30%. The device technology is based on 3-in. wafer grown by metal-organic chemical vapor deposition on semi-insulating SiC substrates. The technology incorporates a 0.5 µm gate technology including optimized field plates. The operation bias is determined by the power density of 6 W/mm achieved at an operation bias of 35 V [Reference Waltereit4], and the geometry of the powerbars has been chosen to achieve 25 W output power. The small-signal gain was specified to be higher than 6 dB across the band. The amplifier was realized in hybrid technology on a high-frequency laminate (Rogers RO4003). Additionally, a LTCC package for the powerbar (8 mm gate width) incorporating pre-matching elements was realized. The motivation for the design concept of this class AB amplifier was to simplify the interchangeability of the powerbar (e.g. in case of malfunction), to provide a modular integration concept and mechanical protection of the powerbar within the LTCC package. The baseplate of the LTCC package is used for the thermal management of the GaN powerbar. The LTCC package was designed with a 3D EM simulation tool (CST Microwave Studio). A photograph of the realized class AB amplifier is shown in Fig. 1.
Class AB amplifier for WiMAX operation.

B) Measurement results
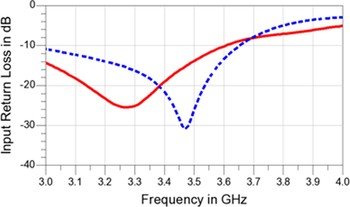
The class AB amplifier was characterized and the corresponding measurement results are presented. For the small-signal measurements the test results (solid red curves) and the simulation results (dotted blue curves) are compared. Simulation and measurement results show slight deviations due to different uncertainties (e.g. modeling of the powerbars, spread of the components, etc.). All measurements were done with a drain voltage of 35 V in continuous wave (CW). The quiescent drain current is 878 mA. The input return loss is shown in Fig. 2. In the frequency range from 3.3 to 3.8 GHz the input return loss is better than 7 dB.
Input return loss of class AB amplifier (simulation (dotted) versus measurements (solid)).

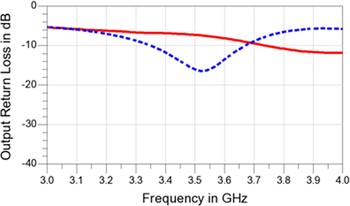
The output return loss is shown in Fig. 3. For the frequency range from 3.3 to 3.8 GHz, the output return loss is better than 7 dB.
Output return loss of class AB amplifier (simulation (dotted) versus measurements (solid)).

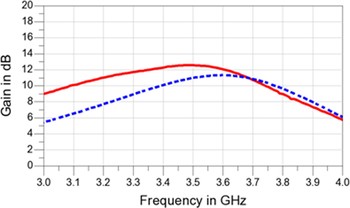
The small-signal gain is shown in Fig. 4. In the frequency range from 3.3 to 3.8 GHz the measured small-signal gain is in the range from 9 to 12.6 dB.
Small-signal gain of class AB amplifier (simulation (dotted) versus measurements (solid)).

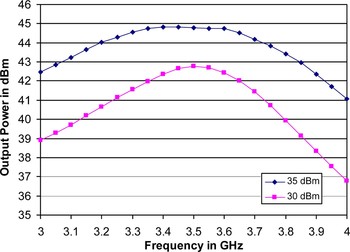
The output power versus frequency measurements are shown in Fig. 5. The CW output power at 35 dBm input power ranges from 43.4 dBm (22 W) to 44.8 dBm (30 W) in the frequency band from 3.3 to 3.8 GHz.
Output power of class AB amplifier at 35 dBm input power.

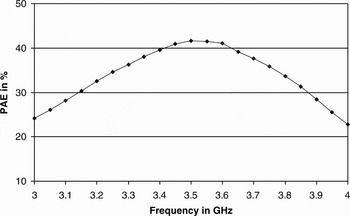
The PAE versus frequency is shown in Fig. 6. In the frequency range from 3.3 to 3.8 GHz the PAE at 35 dBm input power is in the range of 33–42%.
PAE of class AB amplifier at 35 dBm input power.

All measurement results meet or even exceed the design specifications of the class AB power amplifier.
III. SWITCH MODE CLASS S POWER AMPLIFIER
A) Architecture
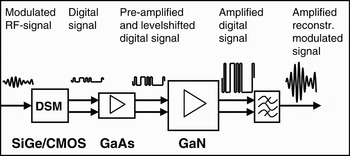
Unlike analog approaches (classes A, B, and C) which show theoretical limitations in efficiency, switch mode amplifier approaches (classes D, E, and F) suggest a theoretical efficiency of 100%, assuming alternate drain-voltage and drain-current. Class-D power amplifiers for example uses two or more transistors as switches to generate a rectangular waveform of either the drain-voltage (voltage mode) or the drain-current (current mode). The transistors are controlled by a rectangular pulse sequence and the width of the pulses is varied proportional to the instantaneous amplitude of the desired output signal. This pulse sequence can be generated by a mixed signal device using different approaches. The pulse width modulation approach typically results in very short pulses, and is limited by the switching speed of practical transistors used as power switches. An alternative can be the delta sigma modulator (DSM) approach and with a proper design the oversampling ratio, i.e. the ratio between RF frequency and switching rate, can be reduced from a typical value of 4:1 to 2.5:1. The principal architecture of the class S power amplifier is presented in Fig. 7. The DSM, which is implemented as a mixed-signal SiGe-BiCMOS MMIC, converts the analog low-power RF signal into a differential digital bit stream with high linearity. A gallium arsenide driver amplifier suitable for high-speed digital signals with data rates up to 12.5 GB/s is used for level shifting to drive the final-stage GaN-HEMT MMIC power switch. Finally, a comb line filter reconstructs the original modulated analog RF signal.
Architecture of class S amplifier.

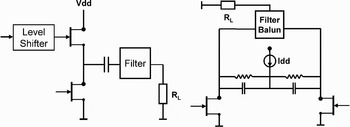
The final stage can be implemented in different architectures. Dependent on the topology of the switching transistors and the resulting current and voltage waveforms, a voltage switched and a current switched amplifier can be implemented. Figure 8 shows the principal schematics. Ideally, the voltage waveform of the voltage switched amplifier shows rectangular shape while the current waveform shows sinusoidal half waves. For the current switched version relations are vice versa.
Principal schematic for voltage switched amplifier (left) and current switched amplifier (right).

The voltage switched amplifier scores for the simplicity of the output filter. Moreover, the derivation of a feedback signal for linearity enhancement is easily done by sensing the voltage at the output capacitor. One drawback is the complex control of the gate of the upper transistor. A level shifter must accommodate the high-voltage swing at this gate with high switching speed. In contrast, the gates of the current switched amplifier transistors show both low amplitudes and can be controlled by complementary voltages. The price to pay is a floating differential output signal and thus a balun is necessary for the conversion into a single ended output. Moreover, this approach needs a current source and the implementation of feedback is more difficult. The switching of high currents can lead to voltage spikes at the transistors. But here again GaN components are well suited for this application. Another critical state can occur under operation with a DSM signal. During long periodes of high or low signals, one of the transistors is switched off and the high filter voltage swing forces the gate-drain connection of the FET into conduction. This effect (addressed as third quadrant problem) can lead to destruction of the component and must be avoided by protection measures. For the construction of the amplifier prototype presented in the following sections the current switched architecture was chosen. This was mainly due to the simplicity of controlling the transistor gates. The construction of a high-speed level shifter was found more challenging and risky than the design of an appropriate balun–filter combination. To minimize transistor losses, the device geometries have been optimized for low on-state resistance. The third quadrant issue was addressed by introducing protection diodes in each amplifier drain path.
B) Design and implementation of class S power amplifier
1) DELTA SIGMA MODULATOR
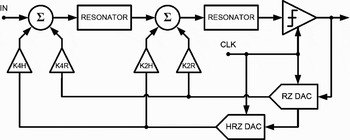
This type of modulator converts the analog signal into a digital 1-bit signal stream, which can be used as input to a switch mode amplifier. A fourth-order continuous-time LC approach [Reference Ostrovskyy, Gustat, Scheytt, Ortmanns and Manoli5] was chosen to implement the bandpass delta sigma modulator (BDSM) (Fig. 9). The simulation and realization in SiGe-technology was done by the institute for Innovations for High Performance microelectronics in Frankfurt/Oder, Germany.
Block diagram of fourth-order bandpass DSM.

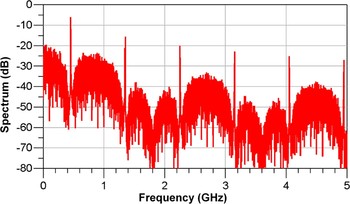
The feedback coefficients in Fig. 9 are optimized for an optimum quantization error function leading to a high signal-to-noise ratio in the vicinity of the carrier frequency band, containing the modulated information. A typical spectrum of the delta sigma modulated signal is displayed in Fig. 10.
Wide-band spectrum of a BDSM signal.

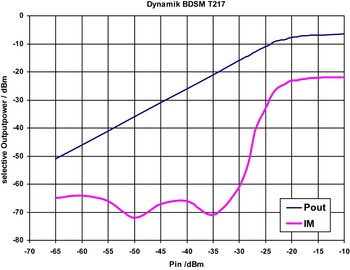
As can be seen from Fig. 10, the out-of-band noise is widely spread from DC to more than 5 GHz, whereas most of the noise is concentrated on the frequency range from DC to about 3 GHz. As a result, the switching amplifier of the class S approach has to cope with a very broadband signal. The dynamic range of the current 450 MHz version of the modulator – driven by a five tone signal – is depicted in Fig. 11. The linear dynamic range was measured to cover more than 40 dB (starting from −65 dBm to more than −25 dBm of input power; solid line). The intermodulation (IM, dashed line) depends on input power and varies from 15 to 50 dB below the carrier output power (solid line).
Dynamic range of this 450 MHz BDSM: signal power and intermodulation distortion of BDSM bit sequence as a function of modulator input power.

2) QUASI-DIGITAL POWER SWITCH (MMIC)
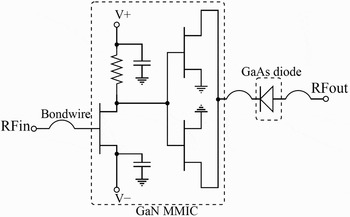
The class S front-end consists of two main components: A 0.5 µm AlGaN/GaN HEMT MMIC [Reference Meliani, Flucke, Wentzel, Würfl, Heinrich and Tränkle6] and a GaAs Schottky diode. A schematic of the circuit is presented in Fig. 12.
Schematic of the switch mode amplifier configuration.

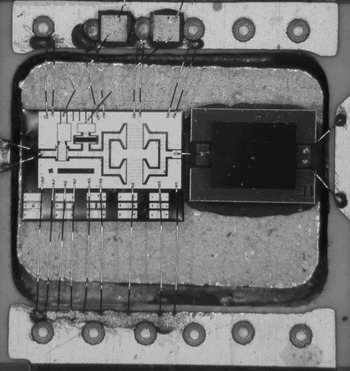
The quasi-digital power switch comprises two stages. The first stage is a resistively loaded 4 × 125 µm transistor. The second stage contains two 8 × 250 µm transistors in parallel. The diode is a 20 fingers high-voltage high-current GaAs Schottky diode (based on a high-voltage HBT process, see [Reference Kurpas, Wentzel, Janke, Meliani, Heinrich and Würfl7]) that is flip-chip mounted on an AlN sub-mount carrier, which allows proper heat sinking of the structure. This element was implemented at the drain of the second stage in order to solve an important issue of amplifiers in current-mode class S operation: Since the output voltage is shaped by the reconstruction filter and thus does not show phase synchronization with the digital input signal, the second stage transistors can reach the third quadrant of operation, i.e. negative drain voltage during the switch-off period, which would distort the output signal and may damage the MMIC. The switch mode amplifier and the diode are mounted on a CuMo heatsink by means of solder preforms. They are electrically connected by using standard ultrasonic bonding technique. In order to reduce losses and parasitic effects generated by the bond wires, the two components as well as the PCB access lines are placed in close vicinity. The MMIC to PCB ground connection was performed using multiple wire bonding techniques in order to decrease the overall wire bonding inductance. The resulting structure was then glued into a recess to align the surface of the MMIC with that of the PCB thus minimizing bond-wire length. The used conducting glue is an easy to handle and reliable two-component silver filled epoxy (H20E) which allows fast curing of the assembled components. A photograph of the MMIC and the diode mounted within the cavity is shown in Fig. 13.
Photograph of the mounted GaN MMIC and GaAs diode.

3) RECONSTRUCTION FILTER
Requirements on the reconstruction filter of switch mode amplifiers are in general very high compared to RF filters commonly used in more conventional transmitter chains. In conventional amplifier chains for communication systems the RF filter needs to fulfill two tasks. First, it must suppress inter modulation products generated by the non-linearity of the high-power amplifier stages that would otherwise reduce the sensitivity of the receiver. Second, the transmitted signal must comply with an emission mask defined by the 3GPP standard [1]. Usually, the amplifier stage is followed by an isolator, hence only the amplitude characteristics of the signal reflected by the RF filter are of interest, but not its phase. The spectrum generated by the BPDSM described in the previous section shows a broadband quantization noise level (Fig. 10). In order to achieve a high level of output power with high efficiency, the above described current mode class D final-stage topology asks for a short-circuit condition in the differential mode of the balanced input port of the filter. According to Section III.B.(1), this condition must be fulfilled over a very broad frequency range from DC to approx. 6 times the carrier frequency, except for a couple of 10 MHz in the vicinity of the signal frequency. The in-band odd mode impedance of the balanced input port should be 65 Ω thus ensuring matching to the final-stage transistors. The single-ended output impedance of the filter is matched to the 50 Ω coaxial N-type connector system, commonly used with base station antennas for mobile communication systems.
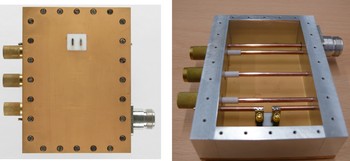
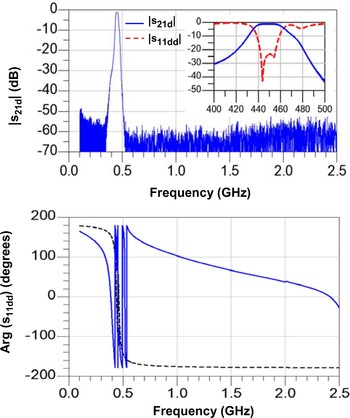
Figure 14 shows photographs of the reconstruction filter. The complex impedance conditions required for class S operation are dealt with by a pre-distortion network (PDNW) consisting of one shunt resonator and two series resonators with lumped SMD components. The series resonators are placed inside the comb line filter housing (right-hand photograph in Fig. 14), the shunt resonator is assembled on the amplifier PCB (not shown here). The top diagram in Fig. 15 visualizes the amplitude performance of the filter [Reference Serebryakova, Blau and Hein8, Reference Serebryakova, Blau and Hein9]. Rejection is higher than 50 dB covering the complete stop band. The inband insertion loss amounts to 1 dB mainly due to the lumped SMD components with limited Q values used with the PDNW. The bottom diagram displays the phase of the signal reflected from the reconstruction filter (measurements, solid blue curve) and the phase of the signal reflected from an optimum filter with ideal lumped elements (dashed black curves). While the optimum filter offers a perfect short – arg(s11dd) = 180° – over the complete stop band, the comb line filter with PDNW shows a non-ideal phase behavior below and above the passband with a continuous decrease in phase with frequency, with a 0° crossover at 2.4 GHz representing an ideal open. The latter characteristics are critical for output power and efficiency.
Photographs of the reconstruction filter in comb line filter technology. Left: view on filter top side with balanced input pins fixed by a PTFE feed through, right: view on filter inside with bottom cover removed.

Mixed mode S parameters of the reconstruction filter (measured as single-ended S parameters in 50 Ω system, then calculated into mixed mode S parameters with 65 Ω odd mode input impedance and 50 Ω single-ended output impedance). Top figure and inset: insertion loss (solid blue curve) and return loss (dashed red curve). Bottom figure: phase of signal reflected from reconstruction filter (measurements, solid blue curve) and reflected from ideal filter with lumped components (theory, dashed curve).

C) Integration aspects
All GaN-SiC devices (transistors, powerbars, MMICs) used in the described demonstrator modules are soldered on heat sink materials with a matched coefficient of thermal expansion with respect to the SiC bulk material. Due to the critical heat sensitivity of these active components, one must optimize heat transfer from the chip to the module baseplate. Beside the copper (Cu) and copper-molybdenum (CuMo) materials, special sandwich composites have been used consisting of Cu and Mo layer materials for good heat spreading. After soldering, all components are inspected by X-ray microscopy for early identification of critical voids. The mounted heat sinks are glued onto the housing baseplate or onto the filter top cover plate in case of the class S amplifier module. The geometry of the heat sinks is close to the GaN-SiC component and fabrication is done by a special wire erosion processing. The thickness of the heatspreaders is matched to the overall module topography, in order to realize shortest electrical bond wires between the GaN-SiC chips and the RF board (PCB) for both, DC bond wires as well as RF bond wires. The assembly of the SiGe DSM, the pre-amplifier stage, and the command control electronics is realized with Chip-and-Wire and SMD technology. The overall architecture of the demonstrators and modules described here is based on a modular design approach enabling the modular replacement of components such as the active GaN power devices, pre-amplifier components, and several generations of SiGe modulator chips. With the modular approach, it is possible to change easily between hardware versions, e.g. of the GaN-SiC devices/components, in order to compare devices and allow us to use the latest versions to ensure best performance of the modules.
D) Characterization of switch mode amplifier
1) AMPLIFIER TUNING USING A PSEUDO RANDOM BIT SEQUENCE (PRBS)
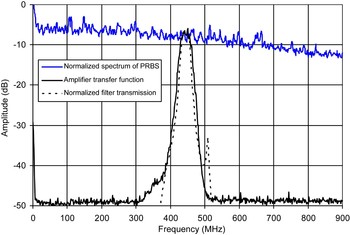
Parasitic drain source capacitances in the final stage transistors of the power switch MMICs typically interact with the lumped shunt capacitor on the PCB. In order to compensate for this effect, the capacitance value of the SMD capacitor needs to be optimized for best transfer function of the complete switch mode amplifier module. This can be achieved by a PRBS with a broadband noise spectrum [Reference Samulak, Serebryakova, Fischer and Weigel10], which is generated by a Xilinx FPGA board. Figure 16 shows the amplifier transfer function in comparison with the broadband noise spectrum of the PRBS and the normalized mixed mode filter transmission coefficient from differential mode at the balanced input port to the single-ended output port (same as |s21d| in top diagram in Fig. 15).
Characterization of amplifier transfer function (solid black curve), for comparison: spectrum of PRBS (solid gray curve) and filter transmission (dashed curve).

2) CLASS D OPERATION
Class D operation was achieved by feeding the amplifier with a differential rectangular 101010-sequence at 900 MB/s, i.e. the fundamental frequency at 450 MHz. The pulses were generated by using a fast ECL receiver chip, which gives complementary output signals of 0.45 Vpp amplitude with 130 ps rise and fall time, respectively. After the filter tuning (see Section III.D.(1)) a tuning procedure was performed to find the optimum bias points for the pre-amplifiers and the GaN power amplifier stages. The time domain signals in class D operation have been recorded at various bias points and for each amplifier stage. A high impedance probe with 7 GHz bandwidth and a fast 40 Gs/s oscilloscope were used for this purpose. The results are also important for comparison with the simulation results. The simulations are done in parallel and allow circuit improvements for the next generations of this switch mode amplifier.
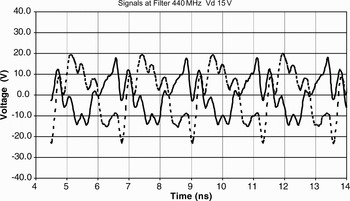
One example for the measurements is shown in Fig. 17. The chart shows the two complementary time domain signals at the filter inputs at fixed drain voltage. From theory the waveforms should have the shape of sinusoidal half waves with 450 MHz frequency. Due to reflections and interaction of the driver with the power stage the signals are distorted.
Time domain signals at filter input pins (drain voltage 15 V).

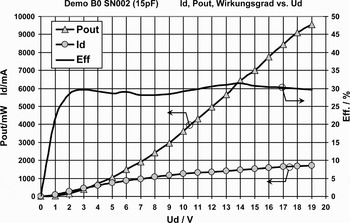
Output power measurements show good results for output power and efficiency (Fig. 18). At maximum supply voltage, an output power exceeding 9 W (curve with triangles) with 30% efficiency has been measured.
Drain efficiency, output power, and drain current versus supply voltage.

3) CLASS S OPERATION
Class S operation was achieved by using a bandpass DSM (see Section B.1) with different input signals. Measurements with sinusoidal single tone at various input levels have been performed. With class S single tone input and 18 V drain voltage biasing, the amplifier yields a maximum output power of 5.8 W (37.6 dBm) with 18.5% drain efficiency.
E) Time domain simulations of switch mode amplifier
Characterization of the switch mode amplifier in class D and class S operation reveals limitations in performance in terms of output power and efficiency. In order to better understand the loss mechanisms, the amplifier setup has been modeled and time domain simulations have been performed, taking into account models for the final-stage transistors representing effects of drain source capacitances and on-state resistances of the transistors in switching operation, and parasitics related to the integration, such as source inductances due to dc bond wires and series inductances introduced by RF bond wires as well as non-ideal filter impedance and phase characteristics and ohmic losses. Simulations in class S operation indicate a loss contribution as follows: 65% due to parasitic related to the power switches, 19% due to ohmic losses in the filter, 10% due to diodes, and 6% due to other contributions. In fact, these numbers indicate, where the losses occur but loss mechanisms do strongly interact. In case of the power switch related losses the root cause for some part of the losses is interaction with the filter, more specifically impedance mismatch and violation of out of band short-circuit condition as discussed in Section III.B.3).
IV. CONCLUSION
Two approaches for implementation of a power amplifier in GaN technology have been presented. The first amplifier is a hybrid class AB implementation for WiMAX applications at 3.5 GHz with emphasis on an LTCC packaging solution at an increased frequency. This amplifier shows good performance exceeding 43 dBm output power with up to 42% PAE. Switching amplifier approaches suggest a theoretical efficiency of 100% while featuring high linearity over a limited bandwidth. Practical implementations, however, have to deal with parasitic effects in the quasi-digital amplifier stage such as drain source capacitances and on-state resistances of the transistors in switching operation, and parasitics related to the integration, such as series inductances introduced by RF bond wires as well as non-ideal filter impedance and phase characteristics and ohmic losses. These effects have been discussed in detail. The class S amplifier described here operates in the TETRA band at 450 MHz. For a CW signal, the measured output power is 5.8 W and drain efficiency is 18.5%. Time domain simulations indicate the potential for higher performance by decreasing on-state resistance of power switches, reduction of parasitic bond-wire inductance, and optimization of filter impedance and phase characteristics.
ACKNOWLEDGEMENTS
This work was partly funded by the Bundesministerium für Bildung und Forschung (BMBF) under contract number 01BU0606. The authors would like to thank Ferdinand-Braun-Institut für Höchstfrequenztechnik (FBH) in Berlin and Fraunhofer Institute for Applied Solid-State Physics (IAF) in Freiburg for providing the semiconductor hardware, i.e. powerbars, MMICs, and diodes including RF models for transient simulations in the time domain, Kurt Blau and Elena Serebryakova from Technische Universität Ilmenau for provision of the reconstruction filters and technical support during tuning process, and Dirk Wiegner and Dieter Ferling from Alcatel-Lucent Deutschland AG for preparation of schematics and initial circuit simulations in the time domain. The authors also wish to thank the Technische Universität Ilmenau with the Zentrum für Innovationskompetenz MacroNano for providing the LTCC package.
 Ulf Schmid received the Dipl.-Ing. degree in electrical engineering from the University of Ulm, Germany, in 2001. From 2002 to 2006 he was a Research Assistant in the Institute of Microwave Techniques, University of Ulm, where his research interest was in the field of planar, low loss antennas for communication and automotive radar applications. From 2006 to 2009 he was a design engineer at Ubidyne GmbH in Ulm, where he was involved in the specification and implementation of analog filters for Ubidyne's unique antenna embedded radio solution for communication base stations. In 2009 he joined European Aeronautic Defence and Space (EADS) Deutschland GmbH, Defence Electronics, Ulm, Germany. His current areas of research interest are in the design of linear, efficient switch mode power amplifiers for wireless communication applications and ultra-wideband high-power Tx modules in GaN technology.
 Rolf Reber received his Diplomingenieur's degree from the University of Karlsruhe, Germany. He joined the Radar Group of AEG-Telefunken Ulm/Germany (which is now part of EADS) in 1987, where he has been engaged in the design and development of microwave components for active phased array antennas. His current work include the development and design of MMICs in GaAs- and GaN-technology dedicated for T/R-modules and the research in the field of modern amplifier topologies for wireless communication.
 Sébastien Chartier was born in Auchel, France, in 1979. He received the Masters degree in microelectronic from the University of Lille, France in 2003 and the Doktor-Ingenieur degree from the University of Ulm, Germany, in 2009. From 2003 to 2007, he was a Research Assistant at the Institute of Electron Devices and Circuits, Ulm, Germany where he developed millimeter-wave SiGe BiCMOS ICs for wireless and automotive radar systems. He joined the Fraunhofer Institute for Applied Solid-State Physics, IAF, Freiburg, Germany in 2007 where he worked on MMIC design using high performance mHEMT technologies for applications up to 300 GHz. In 2009, he joined EADS Deutschland GmbH, Defence Electronics, in Ulm. His main field of research is the design and testing of SiGe BiCMOS ICs, especially for the application in next-generation radar systems as well as the design of GaN-based switch-mode amplifiers for wireless communication.
 Kristina Widmer received her diploma (Dipl.-Ing.) in electrical engineering from the University Stuttgart, Germany, in 2003. In the same year she joined EADS Deutschland GmbH, Defence Electronics, department “T/R modules and MMICs” in Ulm. There she has been working on the development of hybrid circuits, MMICs, and transmit/receive modules. She was involved in the space projects TerraSAR-X and TanDEM-X. Her current research interest is in GaN MMIC design with focus on amplifiers and T/R module design.
 Martin Oppermann was born 1960 in Cologne (Germany). He holds a diploma thesis and a doctor's thesis in Physics from the University of Tübingen. In the department of Applied Physics and in the NMI (Natural and Medical Science Institute), his research activities were in semiconductor electronics and thin film technologies for application in optics and microelectronics. After 2 years semiconductor processing and engineering with the BOSCH company in Reutlingen he started 1993 inside EADS in the department of RF module development and ceramic substrates. As an expert of module technologies, he focussed on mm- and microwave qualified substrate and assembly technologies. In 2007 he became the head of department “T/R modules and MMICs”. Dr. M. Oppermann is a member of the DPG (German Physical Society) and an international member of IMAPS (Intern. Microelectronics and Packaging Society).
 Wolfgang Heinrich received the Dipl.-Ing., Dr.-Ing. and habilitation degrees in 1982, 1987, and 1992, respectively, all from the Technical University of Darmstadt, Germany. Since 1993, he has been with the Ferdinand-Braun-Institut (FBH) at Berlin, Germany, where he is head of the microwave department and deputy director of the institute. Since 2008, he is also professor at the Technical University of Berlin. His present research activities focus on MMIC design with emphasis on GaN power amplifiers, mm-wave packaging, and electromagnetic simulation. Prof. Heinrich has authored or coauthored more than 200 publications and conference contributions. He served as Distinguished Microwave Lecturer for the term 2003/2005 and is currently Associate Editor of the IEEE Transactions on MTT. He was General Chair of the 2007 European Microwave Week in Munich, Germany. Since January 2010, he is President of the European Microwave Association (EuMA).
 Chafik Meliani received his M.S. and Ph.D. degrees in electrical engineering from the University of Denis Diderot, Paris, in 1999 and 2003, respectively. From 1999 to 2003 he worked with France Telecom R&D and Alcatel in Paris, France, on the design of low noise amplifiers, high bitrate circuits and modules beyond 40 Gbps. He joined the Ferdinand-Braun-Institut für Höchstfrequenztechnik (FBH), Berlin, Germany, in 2003, where he is currently a Senior Scientist. His research interests are high bitrate circuits, power amplifiers, and low power front-end dedicated ICs.
 Rüdiger Quay received the Diplom degree in physics from Rheinisch Westfälische Technische Hochschule (RWTH), Aachen, Germany, in 1997, and a second Diploma in economics in 2003. He received his doctoral degree in technical sciences (with honors) from the Technische Universität Wien, Vienna, Austria. In 2009 he received the venia legendi in microelectronics, again from the Technische Universität Wien. He is currently a research engineer with the Fraunhofer Institute of Applied Solid-State Physics, Freiburg, Germany, heading the RF-devices and characterization group. He has authored and coauthored over 100 refereed publications and three monographs. He is a member of IEEE, MTT, and chairman of MTT 6.
 Stephan Maroldt received the Dipl.-Ing. degree in electrical engineering, with emphasis on microelectronics, from Technical University Ilmenau, Germany, in 2006. After graduation he has began working on his Ph.D. degree in the nanotechnology group at the Technical University Ilmenau in the field of GaN HFET technology. Since 2008 he is with Fraunhofer Institute of Applied Solid-State Physics where he has continued working towards the Ph.D. degree. His major field of research is the design and technology for GaN HFET devices and GaN-based microwave switchmode amplifiers circuits.