1. Introduction
The aeolian deposits in the North Pacific Ocean (NPO) serve as important archives for the late Cenozoic palaeoclimate change in the arid Asian interior (Rea et al. Reference Rea, Snoeckx and Joseph1998; Zhang et al. Reference Zhang, Chen, Ji and Li2016). Asian dust flux in NPO sediments has been employed as one of the robust indicators of aridity in the Asian interior (e.g. (Rea et al., Reference Rea, Snoeckx and Joseph1998). The long-term changes in flux of Asian dust have been attributable to the global cooling and/or the effect of uplift of the Tibetan Plateau since at least the early Miocene (Rea et al. Reference Rea, Snoeckx and Joseph1998; Lu & Guo, Reference Lu and Guo2013; Zhang et al. Reference Zhang, Chen, Ji and Li2016). On orbital timescale, the variations of Asian dust are generally correlated with global ice volumes, especially since the middle-Pleistocene transition when the amplitude of the ice sheet began to substantially increase (Lisiecki & Raymo, Reference Lisiecki and Raymo2005; Winckler et al. Reference Winckler, Anderson, Fleisher, McGee and Mahowald2008; Serno et al. Reference Serno, Winckler, Anderson, Maier, Ren, Gersonde and Haug2015).
The general challenge to reconstruct the climate change using aeolian dust archived in NPO sediments is the extraction of the dust fraction from bulk sediments, which also contained volcanic ash, authigenic minerals, hydrothermal products, and biogenic organic carbon, opal and carbonate (Nakai et al. Reference Nakai, Halliday and Rea1993). In the 1980s, a chemical procedure was developed to remove the non-dust fractions through a series of chemical leaches and extract the leaching residuals, which mainly consist of silicate, that is regarded as ‘operationally defined aeolian dust’ (ODED) (Rea & Janecek, Reference Rea and Janecek1981). Later study, however, suggested that this extraction procedure could not exclude the volcanic debris and authigenic minerals in the NPO sediments (Hovan et al. Reference Hovan, Rea, Pisias and Shackleton1989; Weber et al. Reference Weber, Owen, Dickens, Halliday, Jones and Rea1996). Visual technique methods such as smear slides were then employed to estimate the abundance of volcanic ash and helped to obtain the true abundance of aeolian dust (Hovan et al. Reference Hovan, Rea, Pisias and Shackleton1989), though it was sometimes difficult to identify the ash as a result of the alternation (Schacht et al. Reference Schacht, Wallman, Kutterolf and Schmidt2008) and fine grain size of ash (Rose et al. Reference Rose, Riley and Dartevelle2003). Then the contributions of the authigenic minerals and volcanic ash in NPO sediments were determined by means of multivariate statistical techniques using some selected trace elements to identify potential end-member components and quantify the contents of these end-members in each sample (Olivarez et al. Reference Olivarez, Owen and Rea1991; Weber et al. Reference Weber, Owen, Dickens, Halliday, Jones and Rea1996; Scudder et al. Reference Scudder, Murray and Plank2009, Reference Scudder, Murray, Schindlbeck, Kutterolf, Hauff, Underwood, Gwizd, Lauzon and McKinley2016; Pisias et al. Reference Pisias, Murray and Scudder2013).
In recent years, 230Th-normalized 232Th and 4He aeolian flux has been widely used as a robust tool to estimate overall dust accumulation rate in the NPO (Winckler et al. Reference Winckler, Anderson, Fleisher, McGee and Mahowald2008; Serno et al. Reference Serno, Winckler, Anderson, Hayes, McGee, Machalett, Ren, Straub, Gersonde and Haug2014). 232Th and 4He are enriched in continent but low in volcanic materials (Taylor & McLennan, Reference Taylor and McLennan1985) and can thus be the tracers of aeolian dust in the NPO. This approach relies on the observation that the flux of 230Th to the sea floor approximately equals its known production rate from U decay in the overlying water column, thereby allowing the flux of any sedimentary constituent to be estimated from the ratio of the concentration of the constituent to that of 230Th (Francois et al. Reference Francois, Frank, Rutgers van der Loeff and Bacon2004). The good temporal synchronicity between aeolian dust records from the Subarctic North Pacific and north Greenland ice core enabled 230Th-normalized 232Th dust flux to be a chronostratigraphic tool, significantly improving the age determination in Subarctic North Pacific sediments (Serno et al. Reference Serno, Winckler, Anderson, Maier, Ren, Gersonde and Haug2015). However, the short half-life of 230Th (75.7 ka) limited the applicability of this method to sediments that were deposited prior to several glacial cycles (Francois et al. Reference Francois, Frank, Rutgers van der Loeff and Bacon2004).
The radiogenic neodymium (Nd) and strontium (Sr) isotopes, trace elements, clay minerology and grain-size distribution are also effective proxies to estimate the contributions of aeolian dust, volcanic debris and authigenic minerals in the NPO sediments, based on the mixing line relationship between their compositions of local volcanic end-member and the remote Asian dust end-member (Olivarez et al. Reference Olivarez, Owen and Rea1991; Weber et al. Reference Weber, Owen, Dickens, Halliday, Jones and Rea1996; Ziegler et al. Reference Ziegler, Murray, Hovan and Rea2007; Serno et al. Reference Serno, Winckler, Anderson, Hayes, McGee, Machalett, Ren, Straub, Gersonde and Haug2014; Jiang et al. Reference Jiang, Zhou, Nan, Zhou, Zheng, Li, Li and Wang2016; Zhang et al. Reference Zhang, Chen, Ji and Li2016). Their reconstructed Asian dust components were comparable with those estimated from 230Th-normalized 4He and 232Th flux (Serno et al. Reference Serno, Winckler, Anderson, Hayes, McGee, Machalett, Ren, Straub, Gersonde and Haug2014; Xu et al. Reference Xu, Li, Clift, Lim, Wan, Chen, Tang, Jiang and Xiong2015). Of these proxies, Nd and Sr isotopes have been proven to be powerful indicators for tracing the provenance of aeolian dust in NPO sediments (Nakai, Halliday and Rea, Reference Nakai, Halliday and Rea1993; Ziegler et al. Reference Ziegler, Murray, Hovan and Rea2007; Xu et al. Reference Xu, Li, Clift, Lim, Wan, Chen, Tang, Jiang and Xiong2015; Zhang et al. Reference Zhang, Chen, Ji and Li2016). A large dataset of Nd and Sr isotopic compositions existed in the potential source deserts in the Asian interior, which can be used to trace the source of Asian dust and help estimate their contributions (Bory et al. Reference Bory, Biscaye, Svensson and Grousset2002; Chen et al. Reference Chen, Li, Yang, Rao, Lu, Balsam, Sun and Ji2007; Zhao et al. Reference Zhao, Sun, Balsam, Lu, Liu, Chen and Ji2014). Asian dust shows high 87Sr/86Sr ratio and low ϵ Nd value, while the volcanic ash is characterized by low 87Sr/86Sr ratio and high ϵ Nd value (Grousset & Biscaye, Reference Grousset and Biscaye2005). Nd and Sr isotopic signatures of the dust records in NPO sediments have been applied to monitor the past surface processes in response to climatic and tectonic oscillations on the million years timescale (Asahara, Reference Asahara1999; Pettke et al. Reference Pettke, Halliday, Hall and Rea2000; Li et al. Reference Li, Pettke and Chen2011; Zhang et al. Reference Zhang, Chen, Ji and Li2016). However, the Nd and Sr isotopes have rarely been reported to reconstruct the high-resolution evolutions of Asian dust over the glacial–interglacial cycles at orbital and/or suborbital timescale in NPO sediments. A high-resolution Asian dust record over the past several glacial cycles in the NPO would also be helpful to test whether Nd and Sr isotopes are good indicators of Asian dust during glacial–interglacial cycles and also evaluate whether Nd and Sr could be used as a chronostratigraphic tool.
This study extracted ODED from the sediments recovered at ODP site 1209 in the NW Pacific Ocean over the past 500 ka and measured Nd and Sr isotopes, grain-size distribution and trace element concentrations. We found that ODED is actually a mixture of volcanic ash and Asian dust at site 1209. Nd isotope is a robust indicator that reflects the variations of Asian dust over the past five glacial–interglacial cycles. We propose that Nd isotope of ODED fraction in NPO sediments could be used as a chronostratigraphic tool, especially for sediments with no or a limited amount of foraminifera, which inhibited tuning foraminifera δ18O to global benthic δ18O stack for obtaining the orbital-timescale age model.
2. Samples and methodology
2.a. Materials
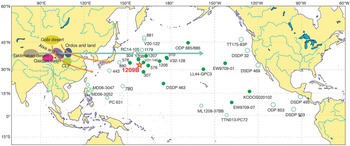
ODP site 1209B (32°39.1081′ N, 158°30.3564′ E) is located on the Southern High Shatsky Rise at a water depth of 2387 m (Fig. 1). Bulk sediments were collected at a sampling interval of 10 cm from ODP site 1209B in the NW Pacific Ocean from the uppermost ∼6 mbsf (meters below sea floor) of the succession, which mainly consists of nannofossil ooze and nannofossil ooze with clay (Shipboard Scientific Party, 2002). The chronologic framework of the upper ∼6 mbsf has been previously developed by a combination of 19 control points by tuning the δ18O record of planktonic and benthic foraminifera to the LR04 δ18O stack (Lisiecki & Raymo, Reference Lisiecki and Raymo2005), and two biostratigraphic events (Fig. 2a, b, c). The average sedimentation rate is 1.36 cm ka−1, and mean sampling resolution is 7.36 ka (Bordiga et al. Reference Bordiga, Beaufort, Cobianchi, Lupi, Mancin, Luciani, Pelosi and Sprovieri2013, Reference Bordiga, Cobianchi, Lupi, Pelosi, Venti and Ziveri2014).
Map showing the locations of ODP site 1209 and other sites in the North Pacific Ocean. Sites labelled with open green and green-filled circles are those with published Nd–Sr isotopic data in circum-Pacific and north central Pacific regions, respectively. The shaded areas in the Asian interior are the potential source regions of Asian dust. Yellow and green arrows indicate transportation of Gobi dust and Taklimakan dust by the East Asian winter monsoon and westerly wind, respectively.

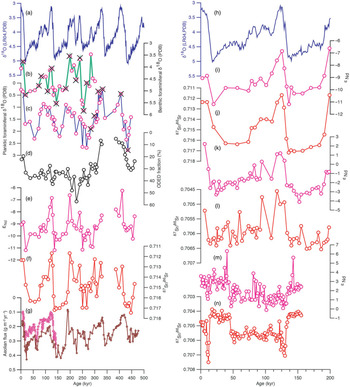
Time series of Nd and Sr isotopic evolutions of the ODED components archived at site 1209B and other sites in the North Pacific Ocean. (a) The global stacked LR04 δ18O curve (Lisiecki & Raymo, Reference Lisiecki and Raymo2005). (b, c) Benthic and planktonic foraminifera δ18O of site 1209B (Bordiga et al. Reference Bordiga, Beaufort, Cobianchi, Lupi, Mancin, Luciani, Pelosi and Sprovieri2013), respectively. The tuning points are also shown. (d) The ODED fraction at site 1209B. (e, f) Nd and Sr isotopic evolutions of the ODED components archived at site 1209B. (g) The dust flux in the equatorial Pacific Ocean (Winckler et al. Reference Winckler, Anderson, Fleisher, McGee and Mahowald2008; Jacobel et al. Reference Jacobel, McManus, Anderson and Winckler2017). (i–n) Nd and Sr isotope evolutions of site 1209 in this study, core MD06-3047 and core MD06-3052, respectively. The Nd and Sr isotopic compositions at cores MD06-3047 and MD06-3052 are from Xu et al. (Reference Xu, Li, Clift, Lim, Wan, Chen, Tang, Jiang and Xiong2015) and Xu et al. (Reference Xu, Li, Clift, Wan, Qiu and Lim2018a), respectively. Data for ODP site 1209B can be found in Supplementary Material.

The ODED component of the bulk samples at site 1209B was extracted based on the method developed by Rea & Janecek (Reference Rea and Janecek1981) and has been described in detail in Zhang et al. (Reference Zhang, Chen, Ji and Li2016). Briefly, c. 4 g of the dry bulk sample was firstly treated with acetic acid, H2O2 and a sodium dithionite-sodium citrate solution buffered with sodium carbonate to remove the carbonate component, the organic matter and the amorphous Fe and Mn oxides and hydroxides, respectively. Then the suspended solution was passed through a 500-mesh (28 μm) sieve. Subsequently, the possible remaining opal and diatom in the <28 μm portion was dissolved and the residue after opal removal is mainly composed of silicate fractions, which is defined as ODED (Olivarez et al. Reference Olivarez, Owen and Rea1991). During the leaching procedure, the large solution/sample ratio and rapid centrifuge separation were used to minimize possible re-adsorption of the REE to the insoluble phases which might result in the artefacts of Nd isotopic compositions for the ODED sediments, as described in detail in Zhang et al. (Reference Zhang, Chen, Ji and Li2016).
2.b. Trace element composition
The extracted ODED samples were completely digested with lithium metaborate/lithium tetraborate mixture in a furnace at 1025 °C. The resulting melt was then cooled and dissolved in an acid mixture containing nitric, hydrochloric and hydrofluoric acids. The trace element concentration in the solution was then analysed by inductively coupled plasma mass spectrometry (ICP-MS) in the State Key Laboratory of Lake Science and Environment, Nanjing Institute of Geography and Limnology, Chinese Academy of Sciences. Analytical uncertainties were <5 %. Six ODED samples were duplicated using ICP-MS (Agilent 7700×) at ALS Chemex Co. Ltd, Guangzhou, China. Analytical uncertainties were <5 %.
2.c. Grain-size analysis
The extracted ODED samples were firstly dispersed by ultrasonification with 10 % (NaPO3)6 solution (Lu & An, Reference Lu and An1997). Then the grain-size distribution was measured using a Malvern Mastersizer S Laser diffraction particle analyser at the State Key Laboratory of Lake Science and Environment, Nanjing Institute of Geography and Limnology, Chinese Academy of Sciences. Replicate analyses indicate that the mean grain size has an analytical error of <2 %.
2.d. Minerals analysis
Six ODED samples were examined by X-ray diffraction (XRD) at Nanjing Agricultural University to determine the minerals. The samples were scanned by a D/max-B XRD with Cu–Ka radiation at 40 kV and 20 mA. The scanning step is 0.01° (2θ) and the scanning range is from 3° to 62° (2θ). The errors were <5 %.
2.e. Nd and Sr isotopes
Approximately 50 mg of the extracted ODED samples was dissolved in a mixture of HNO3 and HF for 36 h in tightly closed Teflon vials at 120 °C. The Sr and Nd elements in the resultant solution were then purified using cation exchange techniques (Zhang et al. Reference Zhang, Chen and Li2015). Briefly, Sr is separated using Sr-Spec resin, and Nd is separated by Ln-Spec resin following enrichment of rare earth elements (REEs) by Tru-Spec resin (Aciego et al. Reference Aciego, Bourdon, Lupker and Rickli2009). Sr and Nd isotopes were determined using a Neptune Plus Multi-Collector ICP-MS (MC-ICP-MS) at the MOE Key Laboratory of Surficial Geochemistry, Department of Earth and Planetary Science, Nanjing University. The instrumental mass bias for Sr and Nd isotopes was corrected by normalizing the 86Sr/88Sr ratio to 0.1194 and the 146Nd/144Nd ratio to 0.7219, respectively. The analytical blank was <1 ng for Sr and <60 pg for Nd. Reproducibility and accuracy of the Sr and Nd isotopic analyses have been periodically checked by running the strontium standard SRM987 and neodymium standard JMCNd2O3, with a mean 87Sr/86Sr ratio of 0.710239 ± 42 (2σ external standard deviation, n = 10) and mean 143Nd/144Nd ratio of 0.512099 ± 15 (2σ external standard deviation, n = 15), respectively. The standard material, BCR-2, is used to verify the chemical procedure. Measurements of ten replicates yielded a mean 87Sr/86Sr value of 0.705015 ± 20 (2σ external standard deviation, n = 10) and a mean 143Nd/144Nd value of 0.512630 ± 15 (2σ external standard deviation, n = 10). For convenience, the 143Nd/144Nd ratios are reported in the epsilon notation (ϵ Nd), where ϵ Nd = (143Nd/144Ndsample/143Nd/144NdCHUR − 1) × 10000; CHUR stands for Chondritic Uniform Reservoir with 143Nd/144Nd ratio of 0.512638 (Jacobsen & Wasserburg, Reference Jacobsen and Wasserburg1980).
3. Results and discussion
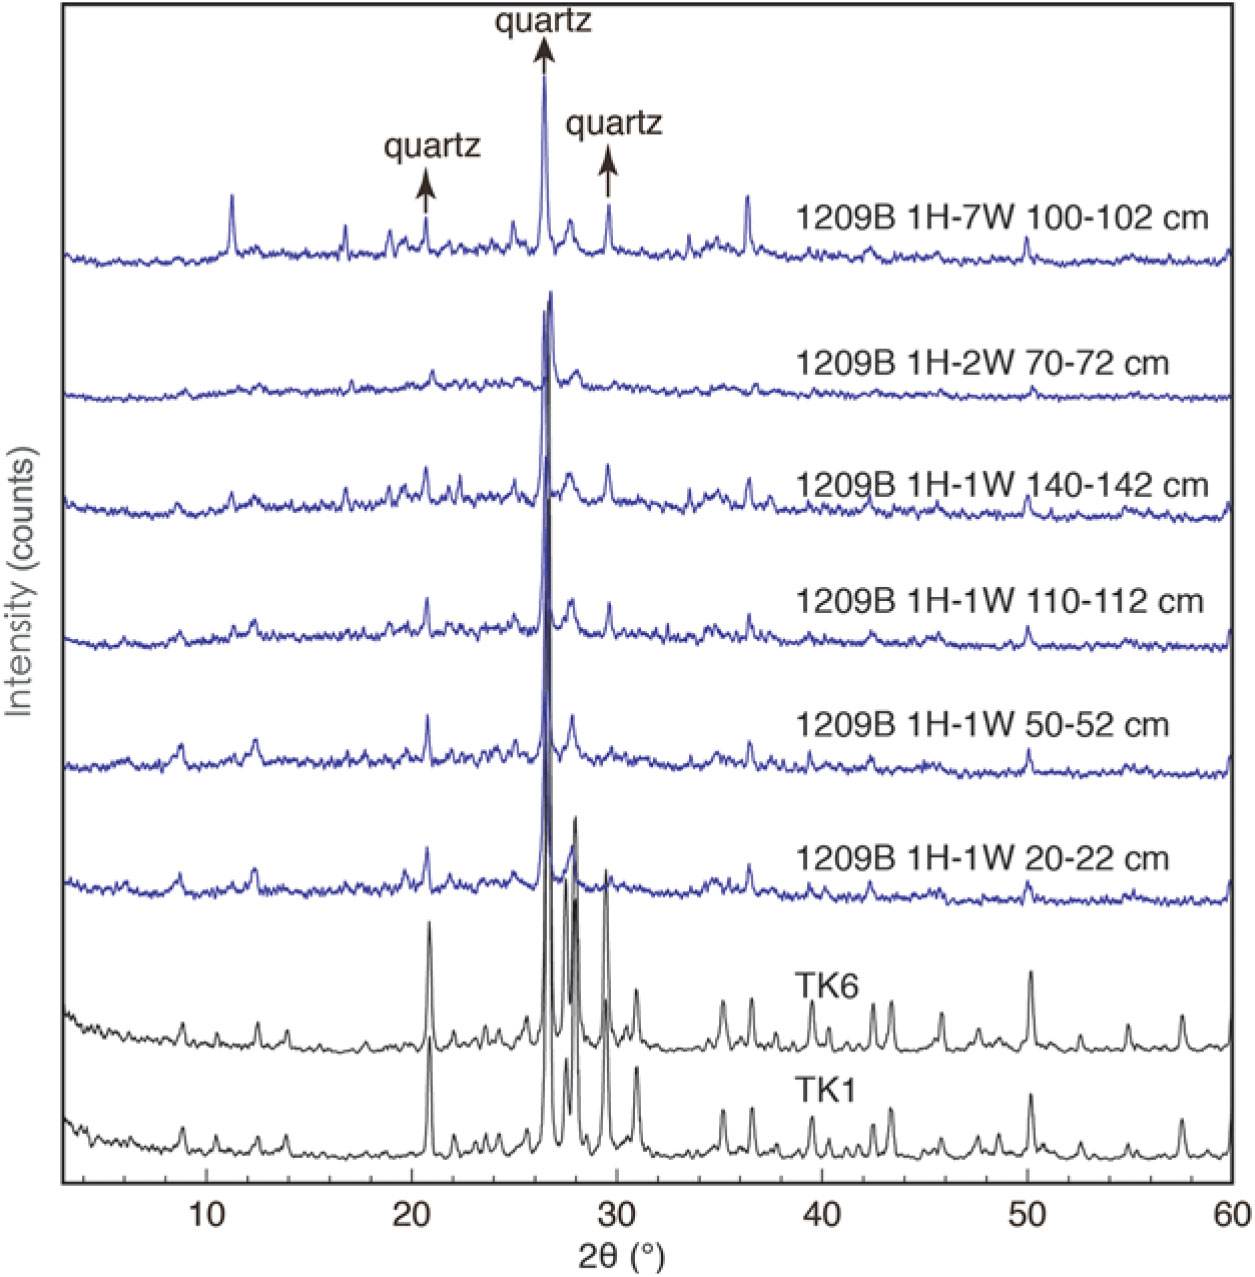
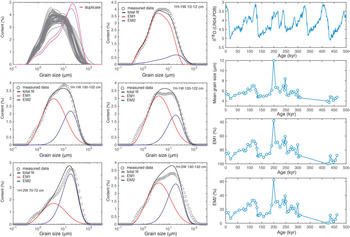
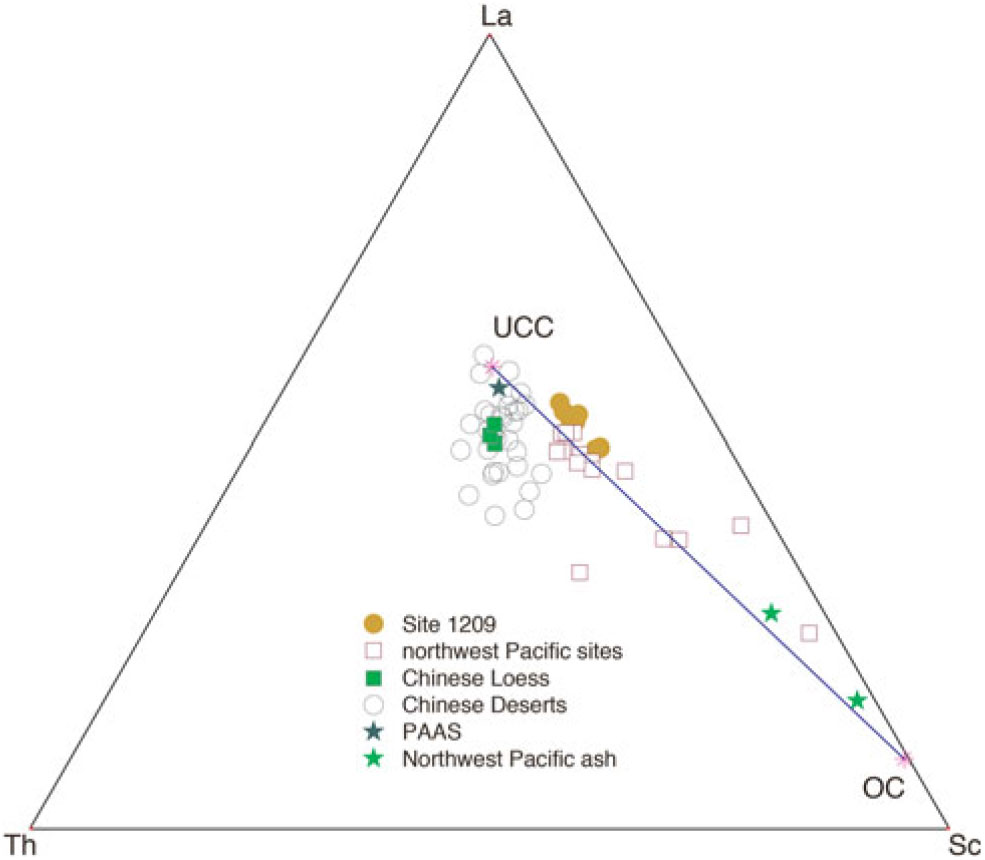
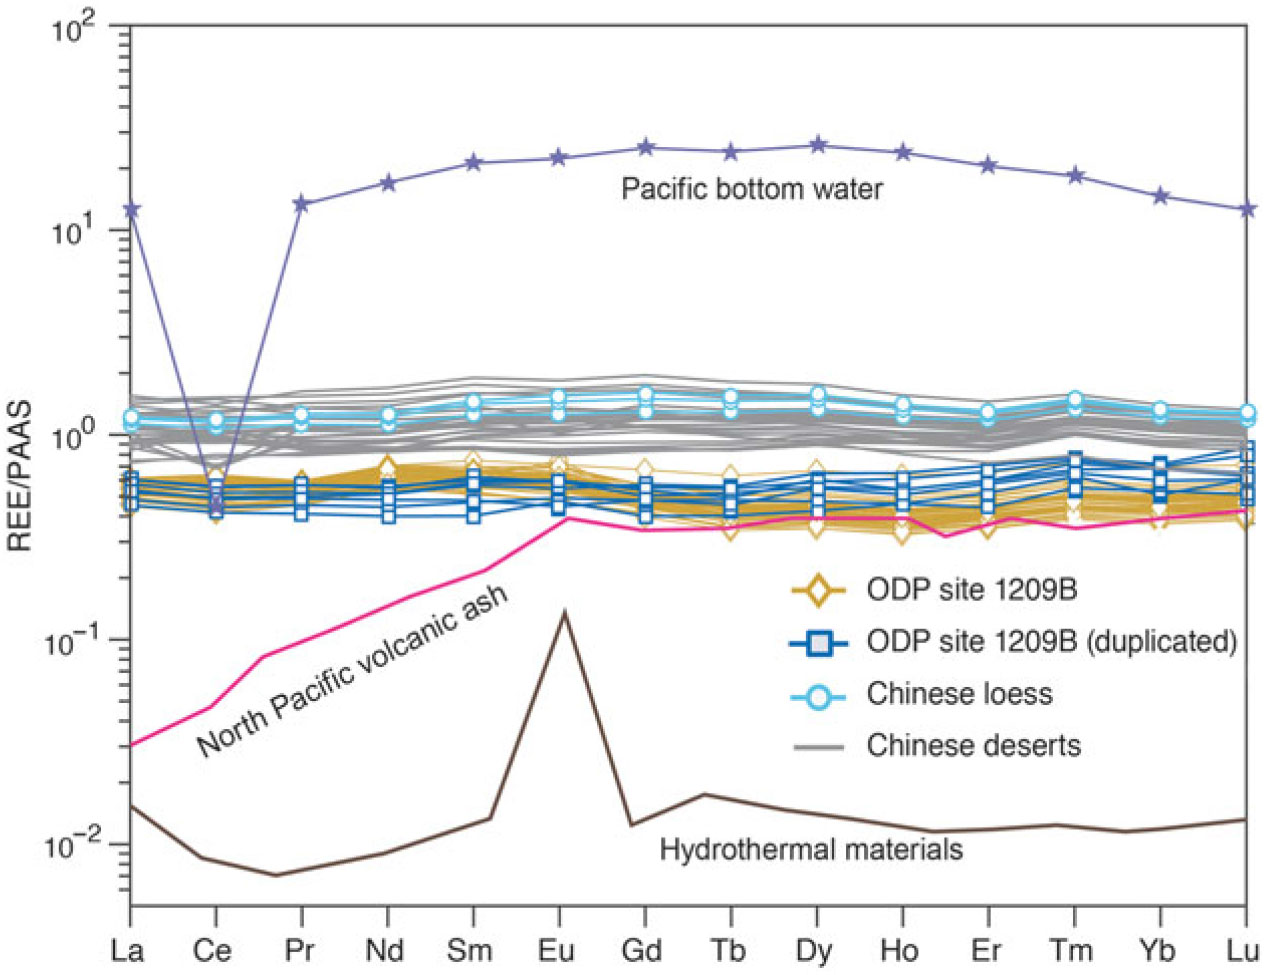
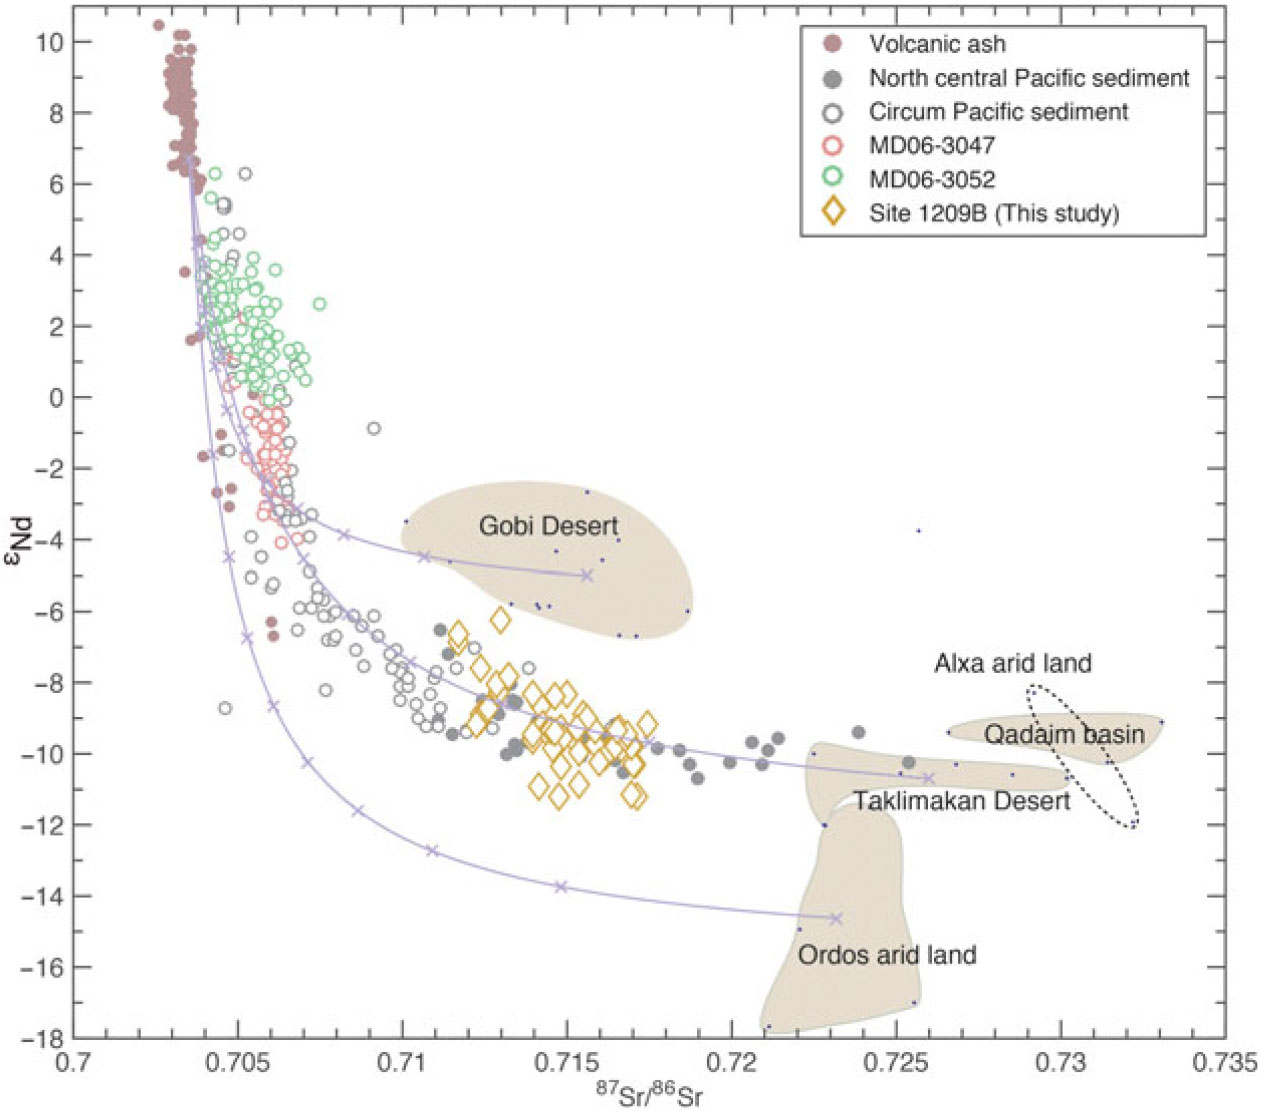
The reconstructed ODED fraction at site 1209B shows no glacial–interglacial variations (Fig. 2d). The XRD results show that quartz is the dominant mineral in the ODED fraction, indicating that Asian dust is the main component (Fig. 3). The grain size ranged from 0.3 μm to 50 μm and was mostly characterized by bimodal patterns, representing two different transport or depositional processes (Bagnold & Barndorff-Nielsen, Reference Bagnold and Barndorff-Nielsen1980). Two independently individual components were separated using the new methods for unmixing sediment bimodal grain-size data (Paterson & Heslop, Reference Paterson and Heslop2015) (Fig. 4). We interpret the end-member 1 (EM1) (fine fraction) as the Asian dust from the remote Asian interior and the coarser fraction (EM2) as representing the volcanic ash derived mainly from the volcanoes around the NW Pacific Ocean, as suggested by Jiang et al. (Reference Jiang, Zhou, Nan, Zhou, Zheng, Li, Li and Wang2016). In the triangular plot of La–Th–Sc, the samples at site 1209 and other Pacific sites locate in the mixing line defined by the upper continental crust and the ocean crust (Zhang et al. Reference Zhang, Chen, Ji and Li2016) (Fig. 5), indicating that the ODED fraction at site 1209B is actually a mixture of Asian dust and volcanic ash. This finding is consistent with the previous study showing that the pre-treatment procedure introduced by Rea & Janecek (Reference Rea and Janecek1981) could not remove the volcanic ash (Weber et al. Reference Weber, Owen, Dickens, Halliday, Jones and Rea1996). The Post-Archaean Australian Shale (PAAS) normalized REE patterns of ODED at site 1209B seemed to support this conclusion. The patterns are generally similar to the <5 μm silicate fraction of Asian deserts and Chinese loess (Zhang et al. Reference Zhang, Zhao, Chen, Ji and Liu2018a), but show relatively lower REE concentrations than that of Chinese loess and Asian deserts. The addition of volcanic ash in the ODED fraction might explain the overall lower REE concentrations at site 1209B (Fig. 6). Nd and Sr isotopes from site 1209B and other sites also identified two end-members’ mixture of aeolian dust from the Asian interior and ash from volcanoes surrounding the North Pacific Oceans in NPO sediments. The Nd and Sr isotopes from ODED samples in north Pacific sediments do not belong to any area of Asian deserts but distribute along the mixing line defined by the volcanic ash and the dust from Asian interior in the binary plot between 87Sr/86Sr ratios and ϵ Nd values (Fig. 7).
X-ray diffraction results of ODED samples at site 1209B and samples from Taklimakan desert (Li et al. Reference Li, Chen, Chen, Yang, Ji and Liu2007).

Grain-size frequency distribution and mathematically fit curves using a new MATLAB® algorithm (Paterson & Heslop, Reference Paterson and Heslop2015) at site 1209. The sample section names are provided in the legend. Also shown are the time series of mean grain size, EM1 and EM2. EM1 – end-member 1; EM2 – end-member 2. The global stacked LR04 δ18O curve (Lisiecki & Raymo, Reference Lisiecki and Raymo2005) is also shown for comparison.

La–Th–Sc ternary diagram. The composition of PAAS, upper continental crust (UCC) and oceanic crust (OC) are from Taylor & McLennan (Reference Taylor and McLennan1985). Compositions of NW Pacific ash, Pacific bottom water and hydrothermal materials are from Bailey (Reference Bailey1993), Ziegler et al. (Reference Ziegler, Murray, Hovan and Rea2007) and Severmann et al. (Reference Severmann, Mills, Palmer and Fallick2004), respectively. The data of NW Pacific sites are from Zhang et al. (Reference Zhang, Chen, Ji and Li2016).

PAAS-normalized REE patterns. Data of volcanic ash in western North Pacific Ocean, hydrothermal materials and the Pacific bottom water are from Bailey (Reference Bailey1993), Severmann et al. (Reference Severmann, Mills, Palmer and Fallick2004) and Ziegler et al. (Reference Ziegler, Murray, Hovan and Rea2007), respectively.

Cross-plot between the 87Sr/86Sr ratios and ϵ Nd values in North Pacific sediments. The Nd and Sr isotopic ratios of volcanic ash follow the published values (McCulloch & Perfit, Reference McCulloch and Perfit1981; Woodhead, Reference Woodhead1989; Defant et al. Reference Defant, Maury, Joron, Feigenson, Leterrier, Bellon, Jacques and Richard1990; Kepezhinskas et al. Reference Kepezhinskas, McDermott, Defant, Hochstaedter, Drummond, Hawkesworth, Koloskov, Maury and Bellon1997; Svensson et al. Reference Svensson, Biscaye and Grousset2000). The Nd and Sr isotopic compositions of the potential dust sources in Asia interior (Taklimakan desert, Gobi desert, Ordos arid lands, Alxa arid lands and the Qaidam basins) are based on previous studies (Bory et al. Reference Bory, Biscaye and Grousset2003; Chen et al. Reference Chen, Li, Yang, Rao, Lu, Balsam, Sun and Ji2007; Li et al. Reference Li, Pettke and Chen2011; Zhao et al. Reference Zhao, Sun, Balsam, Lu, Liu, Chen and Ji2014, Reference Zhao, Sun, Balsam, Zeng, Lu, Otgonbayar and Ji2015). Also shown are the published Nd and Sr isotopic compositions of the sediments from north central Pacific and circum-Pacific oceans (Nakai et al. Reference Nakai, Halliday and Rea1993; Pettke et al. Reference Pettke, Halliday and Rea2002; Seo et al. Reference Seo, Lee, Yoo, Kim and Hyeong2014; Xu et al. Reference Xu, Li, Clift, Lim, Wan, Chen, Tang, Jiang and Xiong2015, Reference Xu, Li, Clift, Wan, Qiu and Lim2018a, Reference Xu, Li, Colin, Clift, Sun, Yu, Wan and Lim2018b). The mixing curves show mixing lines in 10 % steps between the volcanic ash and Asian dust sources. Nd and Sr element concentrations of volcanic ash and potential sources are from Defant et al. (Reference Defant, Maury, Joron, Feigenson, Leterrier, Bellon, Jacques and Richard1990), Zhao et al. (Reference Zhao, Sun, Balsam, Lu, Liu, Chen and Ji2014) and Zhang et al. (Reference Zhang, Zhao, Chen, Ji and Liu2018a).

The variations of Nd isotopes of ODED samples at site 1209 show a ‘sawtooth’ characteristic of glacial–interglacial cycles in ice volume covering the past c. 500 ka (Lisiecki & Raymo, Reference Lisiecki and Raymo2005), with lower (higher) ϵ Nd values corresponding with glacial (interglacial) periods (Fig. 2e). We interpret variations of the Nd isotopes at site 1209 as reflecting relative contribution of windblown Asian dust emitted from the central Asian interior and volcanic weathering products. The Asian end-member supplied high 87Sr/86Sr and low ϵ Nd(0) aeolian dust, while the volcanoes end-member, which is characterized by young volcanic rocks, contributed low 87Sr/86Sr and high ϵ Nd(0) weathering products (Grousset & Biscaye, Reference Grousset and Biscaye2005). Thus, lower ϵ Nd values reflected more contributions of Asian dust in glacial periods, while higher ϵ Nd values indicated more contributions from volcanic ash. It has been shown that Asian dust generation is enhanced during periods of global cooling and is tightly linked to the development of global ice sheets (Lu & Guo, Reference Lu and Guo2013; Zhang et al. Reference Zhang, Chen, Ji and Li2016, Reference Zhang, De Vleeschouwer, Shen, Zhang and Zeng2018b). The consistency of dust records between the NW Pacific, the equatorial Pacific and Antarctica indicated that dust generation in inter-hemispheric source regions exhibited a common response to climate change over late-Pleistocene glacial cycles (Lambert et al. Reference Lambert, Delmonte, Petit, Bigler, Kaufmann, Hutterli, Stocker, Ruth, Steffensen and Maggi2008; Winckler et al. Reference Winckler, Anderson, Fleisher, McGee and Mahowald2008; Jacobel et al. Reference Jacobel, McManus, Anderson and Winckler2017). We propose that the excellent agreement between ϵ Nd values at site 1209B and LR04 stack over the past 500 ka provides a new chronostratigraphic tool for NPO sediments. Nd isotope is preferred, as it has a limited grain-size effect, compared with Sr isotope, which was influenced by grain size to some extent (Grousset & Biscaye, Reference Grousset and Biscaye2005; Chen et al. Reference Chen, Li, Yang, Rao, Lu, Balsam, Sun and Ji2007). The dust component (EM1) unmixed by our grain-size distribution data shows a general sawtooth shape typical of the marine δ18O (Lisiecki & Raymo, Reference Lisiecki and Raymo2005) (Fig. 4), supporting that dust could be a potential chronostratigraphic tool in NPO sediments.
However, one factor might complicate the explanation that Nd isotope could be used as a chronostratigraphic tool in NPO sediments. The variations of Nd isotope at site 1209B in glacial cycles might be caused by the source shifting of Asian dust, as the source deserts in the Asian interior exhibit different Nd and Sr isotopic compositions (Chen et al. Reference Chen, Li, Yang, Rao, Lu, Balsam, Sun and Ji2007) (Fig. 7). The Taklimakan desert and Mongolian Gobi desert are generally considered to be the main source areas for the long-range transportation of Asian dust (Sun et al. Reference Sun, Zhang and Liu2001; Shao et al. Reference Shao, Wyrwoll, Chappell, Huang, Lin, McTainsh, Mikami, Tanaka, Wang and Yoon2011). Gobi dust exhibits a more radiogenic Nd isotopic composition than Taklimakan dust (Chen et al. Reference Chen, Li, Yang, Rao, Lu, Balsam, Sun and Ji2007). Thus, the low ϵ Nd values at site 1209B during the glacial might be attributable to the increase of Taklimakan dust, while high ϵ Nd values during the interglacial might be the result of the increase of Gobi dust (Fig. 7). However, which desert(s) are the main sources of Asian dust in the NW Pacific Ocean is still debated (Seo et al. Reference Seo, Lee, Yoo, Kim and Hyeong2014; Xu et al. Reference Xu, Li, Clift, Wan, Cai and Chen2016). The scatter plot of Nd and Sr isotopes shows that the Taklimakan desert might be the main source of aeolian dust archived in 1209 core sediments (Fig. 7). The Gobi desert may not be the main source of aeolian dust at site 1209, as it is generally believed that Gobi dust can only reach the NW margin of the Pacific Ocean by means of the near-surface East Asian winter monsoon (Sun et al. Reference Sun, Zhang and Liu2001; Shao et al. Reference Shao, Wyrwoll, Chappell, Huang, Lin, McTainsh, Mikami, Tanaka, Wang and Yoon2011; Zhao et al. Reference Zhao, Sun, Balsam, Lu, Liu, Chen and Ji2014). Nevertheless, we propose that the relative contributions of Asian dust to volcanic ash during the glacial–interglacial cycles, rather than source shift of Asian dust, are the dominant factor for the sawtooth patterns of Nd and Sr isotopes. Support also comes from the high-resolution Nd and Sr isotopic compositions of the ODED component from core MD06-3047 located in the western Philippine Sea, also exhibiting a ‘sawtooth’ pattern over the past 200 ka (Xu et al. Reference Xu, Li, Clift, Lim, Wan, Chen, Tang, Jiang and Xiong2015) (Fig. 2k, i). We suggest that the Nd isotope of the ODED component in NPO could be used as a robust indicator of Asian dust and the dust-tuning method as suggested by Serno et al. (Reference Serno, Winckler, Anderson, Maier, Ren, Gersonde and Haug2015) allowed the Nd isotope to be a chronostratigraphic tool in NPO sediments.
The fluctuation of the deposition of volcanism ash is another challenge to the application of Nd isotope as a chronostratigraphic tool in NPO sediments. The volcanic ash has been suggested to be a very important component in NPO sediments (Scudder et al. Reference Scudder, Murray and Plank2009, Reference Scudder, Murray, Schindlbeck, Kutterolf, Hauff, Underwood, Gwizd, Lauzon and McKinley2016), and the volcanism activity has been suggested to be highly correlated with the global δ18O records (Kutterolf et al. Reference Kutterolf, Schindlbeck, Jegen, Freundt and Straub2019). This implies that the glacial–interglacial variations of ϵ Nd values at site 1209B might be generated by the variations of volcanic ash in response to the glacial cycles other than aeolian dust (Fig. 2e). However, a number of uncertainties still exist and more work is needed to decipher how climate controls the volcanic activity (Kutterolf et al. Reference Kutterolf, Schindlbeck, Jegen, Freundt and Straub2019). It has become clear that the global dust generation in inter-hemispheric source regions coherently responds to global climate forcing at least over late-Pleistocene glacial cycles (Lambert et al. Reference Lambert, Delmonte, Petit, Bigler, Kaufmann, Hutterli, Stocker, Ruth, Steffensen and Maggi2008; Winckler et al. Reference Winckler, Anderson, Fleisher, McGee and Mahowald2008; Jacobel et al. Reference Jacobel, McManus, Anderson and Winckler2017) (Fig. 2g). We propose that the generation of Asian dust in response to the glacial–interglacial cycles is the dominant factor in variations of ϵ Nd values at site 1209B. A recent high-resolution Nd and Sr isotopic record core MD06-3052 located on the continental slope of the western Philippine Sea showed a different pattern to site 1209B over the past 150 ka (Xu et al. Reference Xu, Li, Clift, Wan, Qiu and Lim2018a), with the higher ϵ Nd values corresponding to the glacial periods and lower ϵ Nd values corresponding to the interglacial periods (Fig. 2m, n). The siliciclastic sediments in this core are dominantly sourced from the weathering product from volcanic rocks and to a lesser extent Asian dust (Xu et al. Reference Xu, Li, Clift, Wan, Qiu and Lim2018a). During the cold periods, the strong physical erosion and chemical weathering of the exposed volcanic rocks contributed more to the sediments as a result of the large sea-level lowstands and significant exposure of the continental shelf (Xu et al. Reference Xu, Li, Clift, Wan, Qiu and Lim2018a). Thus, attention should be raised when using the Nd isotope as a chronostratigraphic tool in NPO sediments dominated by the weathering product from volcanic rocks rather than aeolian dust.
4. Conclusions
This work extracted ODED from the sediments recovered at ODP site 1209 in the NPO and measured Nd and Sr isotopes, trace elements, minerals and grain size of this component over the past c. 500 ka. The results show that the ODED is a mixture of Asian dust and volcanic ash. The variation of Nd isotope mimics the LR04 curve over the past five glacial–interglacial cycles, with lower (higher) ϵ Nd values during cooling (warm) periods. Nd isotope has a limited grain-size effect and its variation reflects the relative contribution of Asian dust in site 1209 sediments. Asian dust generation is enhanced during periods of global cooling and is tightly linked to the development of global ice sheets. The excellent agreement between our site 1209 ϵ Nd values and LR04 stack over the past 500 ka could provide the orbital-scale age tie points in addition to the benthic-foraminifera δ18O tuning method. We propose that Nd isotope of ODED component would be a good chronostratigraphic tool in NPO sediments, especially for sediments with a limited amount of foraminifera.
Supplementary material
To view supplementary material for this article, please visit https://doi.org/10.1017/S001675681900089X.
Acknowledgements
This research used samples provided by the Ocean Drilling Program (ODP). ODP is sponsored by the US National Science Foundation (NSF) and participating countries under the management of Joint Oceanographic Institutions, Inc. We thank Dr Lin Zeng of Ludong University for helping analyse the grain-size data with the Weibull function. We sincerely appreciate the constructive comments and suggestions from two anonymous reviewers that greatly improved the manuscript. This work was financially supported by the National Natural Science Foundation of China (grant nos. 41702191 and 41430530).
Declaration of interest
The authors declare no conflicts of interest.