INTRODUCTION
Temperature is the most important factor for marine poikilothermic organisms whose metabolic rate is determined by its environmental variables. Different physiological, biochemical and molecular regulation mechanisms provide poikilotherm adaptation/acclimation to various temperature fluctuations (Hochachka & Somero, Reference Hochachka and Somero2002). It is known that membranes play diverse and essential roles as physical barriers, controlling the transport of molecules, establishing ion gradients, and acting in membrane-based cell signalling (Hazel & Williams, Reference Hazel and Williams1990). Various kinds of environmental stress, including temperature, cause alterations in physical properties of cell membrane lipids that are reflected in the membrane dynamics (mainly fluidity). The membrane fluidity influences the adaptive response of the organism to environmental stresses by regulating the activity of membrane-associated enzymes, ion channels and pumps, receptors and others (Hazel & Williams, Reference Hazel and Williams1990; Hazel, Reference Hazel1995). The most consistent biochemical mechanism of poikilotherm acclimation at temperature fluctuations includes ‘homeoviscous adaptation’ of membrane fluidity, which is accompanied by an enlarged unsaturated fatty acid content resulting in increased fluidity at low temperature (Sinensky, Reference Sinensky1974; Hazel & Williams, Reference Hazel and Williams1990; Cossins, Reference Cossins and Cossins1994). The timeframe of ‘homeoviscous adaptation’ during temperature acclimation of bivalves is still unclear (Williams & Somero, Reference Williams and Somero1996; Pernet et al., Reference Pernet, Tremblay, Gionet and Landry2006). The poikilotherm lipid and fatty acid composition response to long-term temperature acclimation was mostly investigated. It was found that changes in membrane lipid fatty acid composition occurred after a period of acclimation, varying in duration from 1 week in case of warm acclimation to several weeks during cold acclimation (Hazel & Williams, Reference Hazel and Williams1990; Williams & Somero, Reference Williams and Somero1996; Pernet et al., Reference Pernet, Tremblay, Redjah, Sévigny and Gionet2008). It has been shown however that intertidal mussel membranes can be restructured within hours in response to temperature fluctuations during the tidal cycle (Dey & Farkas, Reference Dey and Farkas1992; Williams & Somero, Reference Williams and Somero1996; Pernet et al., Reference Pernet, Tremblay, Comeau and Guderley2007). Gills in filter-feeding mussels are more sensitive to various natural environmental effects (Baršienė et al., Reference Baršienė, Rybakovas, Garnaga and Andreikėnaitė2012). Since bivalve mollusc gills represent the site of initial contact with environmental factors, modification of the lipid composition (mainly phospholipids and their fatty acid composition, as well as cholesterol) in the organ reflects the primary compensatory response to stress. The aim of this study was to compare the response of gill cholesterol and phospholipid levels and phospholipid fatty acids composition to acute (24 h) and long-term (14 days) temperature effects in blue mussels Mytilus edulis L. living in a stable aquaculture environment with no tidal effects.
MATERIALS AND METHODS
Sampling and experiments were carried out at the ‘Kartesh’ Biological Research Station of the Zoological Institute RAS (Chupa Bay, Gulf of Kandalaksha, White Sea).
Acute temperature experiment
Mussels Mytilus edulis L. were collected from mariculture collectors in Kruglaya Bay (Kandalaksha Gulf, White Sea) at a depth of 1.5–2.0 m in April (0–3°C) and August (8°C) of 2012. The animals were acclimated to laboratory conditions for 72 h, where water temperature corresponded to the temperature of natural water at the time of experiments. The water temperature in the aquarium was raised from 0–3 to 8°C (in April) and reduced from 8 to 0–3°C (in August). Samples were collected after 1 and 24 h exposure. Thereafter, the mussels were returned to the initial temperature conditions: 0–3 and 8°C. Water in the aquarium was aerated and changed daily, no supplementary feeding was provided. Gill samples (N = 5) were taken for the lipid composition analyses 1, 24 and 72 h later.
Long-term temperature experiment
Mussels Mytilus edulis L. were collected from aquaculture site ‘Sonostrov’ (http://www.mariprod.ru), White Sea (66°09′00″ N 34°10′00″ W) in August 2011. Upon arrival, animals were sorted by size and age (shell length 58.5 ± 3.1 mm, 3+ years old) and acclimated to laboratory conditions for 72 h prior to starting the experiment. Water temperature and salinity in aquaria corresponded to the natural water conditions at the time of experiments and were 15°C and 25 psu, respectively. The long-term temperature experiment involved acclimation (14 days) of the blue mussels to different water temperatures (5, 15 (for control) and 20°C). Animals were fed with ‘Coraliquid’ (Sera, Germany, http://www.sera.de) twice a day. After the experimental exposure periods were over, mussel gills (N = 5) were fixed in 96% ethanol for further analysis.
Lipid composition analysis
The research was carried out using the facilities of the Equipment Sharing Centre of the Institute of Biology, Karelian Research Center RAS.
Lipids were extracted from blue mussel, Mytilus edulis, gills with chloroform/methanol (2:1, v/v) following the method of Folch et al. (Reference Folch, Lees and Sloan-Stanley1957). The extracted lipids were spotted onto silica gel thin-layer chromatography plates ‘Sorbfil’ and separated into different fractions of lipid classes: phospholipids, cholesterol, triacylglycerols and cholesterol ethers, using petroleum ether/diethyl ether/acetic acid (90:10:1, v/v) as the mobile phase. The quantitative composition of total lipid fractions was measured in SF-2000 UV/Vis spectrophotometer (Saint-Petersburg, Russia) at wavelength 540 nm for phospholipids, triacylglycerols and cholesterol ethers fractions, as well as at 550 nm for the cholesterol fraction (Sidorov et al., Reference Sidorov, Lizenko, Bolgova and Nefedova1972; Engelbrecht et al., Reference Engelbrecht, Mari and Anderson1974). Individual phospholipid fractions (phosphatidylinositol, phosphatidylserine, phosphatidylethanolamine, phosphatidylcholine, lysophosphatidylcholine and sphingomyelin) were analysed by high-performance liquid chromatography in isocratic liquid chromatograph with UV detector ‘Stayer’ (Moscow, Russia) using silica gel column Nucleosil 100-7, 250 mm (‘Elsico’, Moscow, Russia) and mobile phase: acetonitrile/hexane/methanol/phosphoric acid (918:30:30:17.5, v/v). The detection wavelength was 206 nm (Arduini et al., Reference Arduini, Peschechera, Dottori, Sciarroni, Serafini and Calvani1996). Peaks were identified by reference to retention times of authentic standards (‘Sigma Aldrich’ and ‘Supelco’, USA). Fatty acid methyl esters (FAME) from the phospholipid fraction were prepared using methanol and acetyl chloride according to Tsyganov's method (Reference Tsyganov1971). FAME were separated in a gas-liquid chromatograph ‘Kristall.4000’ (Yoshkar-Ola, Russia) with flame ionization detector using columns ‘Zebron ZB-FFAP’ (50–0.32 mm) (‘Phenomenex’, USA) and helium as the mobile phase. Mussel phospholipid FAME were identified by comparison with standard mixes (‘Supelco’, USA).
Statistical analysis
The results of the mussel lipid composition changes are given as mean ± SD of five gill samples. Statistical analysis was carried out using StatSoft Statistica v 7.0. Normality of distribution for all datasets was tested with the Kolmogorov–Smirnov test. As a majority of the data was found not to meet homogeneity standards, the data were analysed using the non-parametric Mann–Whitney U as well as a Kruskal–Wallis test with a Tukey post hoc test (Hill & Lewicki, Reference Hill and Lewicki2007). The differences were considered significant at P < 0.05.
RESULTS
Acute temperature effect
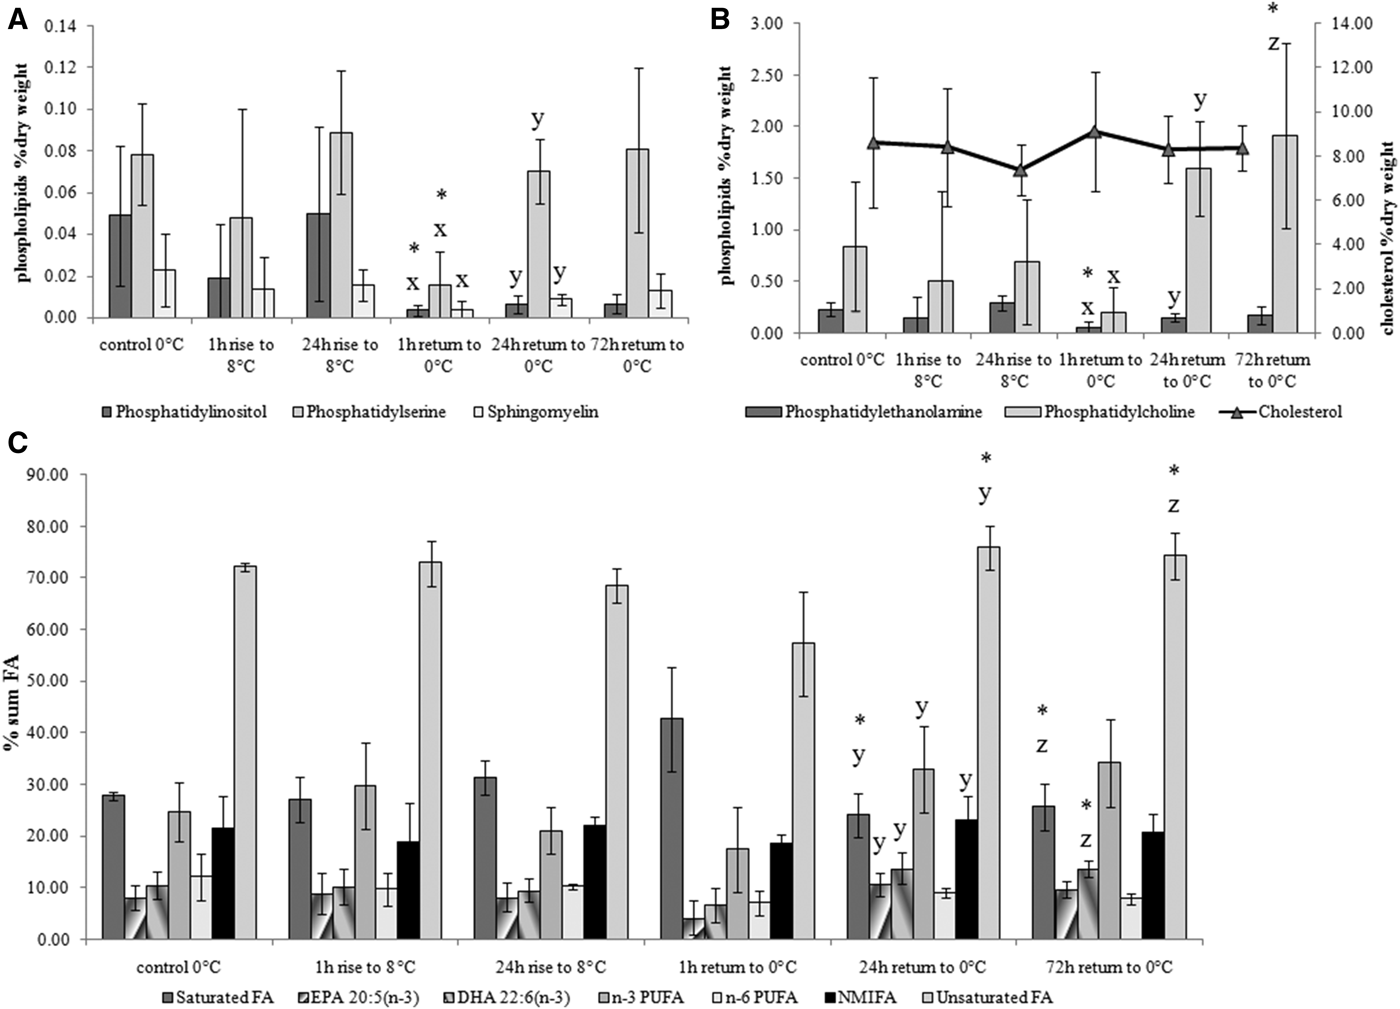
Temperature rise from 0–3 to 8°C during 1 and 24 h did not affect the levels of membrane lipids such as cholesterol, major (phosphatidylcholine and phosphatidylethanolamine) and minor membrane phospholipids (phosphatidylinositol, phosphatidylserine and sphingomyelin) as well as the phospholipid fatty acid composition (Figure 1). Return to the initial temperature (0–3°C) for 1 h caused an acute decrease in the concentration of all phospholipid fractions, whereas longer exposure of the mussels to 0–3°C (for longer than 24 h) led again to a rise in these phospholipids, as well as in n-3 polyunsaturated fatty acids (PUFA) (mainly eicosapentaenoic 20:5n − 3 and docosahexaenoic 22:6n − 3 acids, EPA and DHA, respectively).
Changes in minor (A: phosphatidylinositol, phosphatidylserine and sphingomyelin) and major (B: phosphatidylcholine, phosphatidylethanolamine, cholesterol) membrane lipids and phospholipid fatty acid composition (C) of blue mussels Mytilus edulis gills in response to acute temperature rise from 0–3 to 8°C and return to the initial 0–3°C temperature. Values are means ± SD (N = 5). Significant results in comparison of datasets are indicated by alphabet letters and asterisks. Differences indicated with alphabetic letters were estimated by the non-parametric Mann–Whitney U test, P < 0.05: (x) – comparison of 24 h rise to 8°C with 1 h return to O°C; (y) – comparison of 1 h return to 0°C with 24 h return to O°C; (z) – comparison of 1 h return to 0°C with 72 h return to O°C; other variants of pair-wise comparisons showed no significant differences. Differences indicated with asterisks – were estimated by Kruskal–Wallis test with a Tukey post hoc test, P < 0.05 (same pairs of comparison).

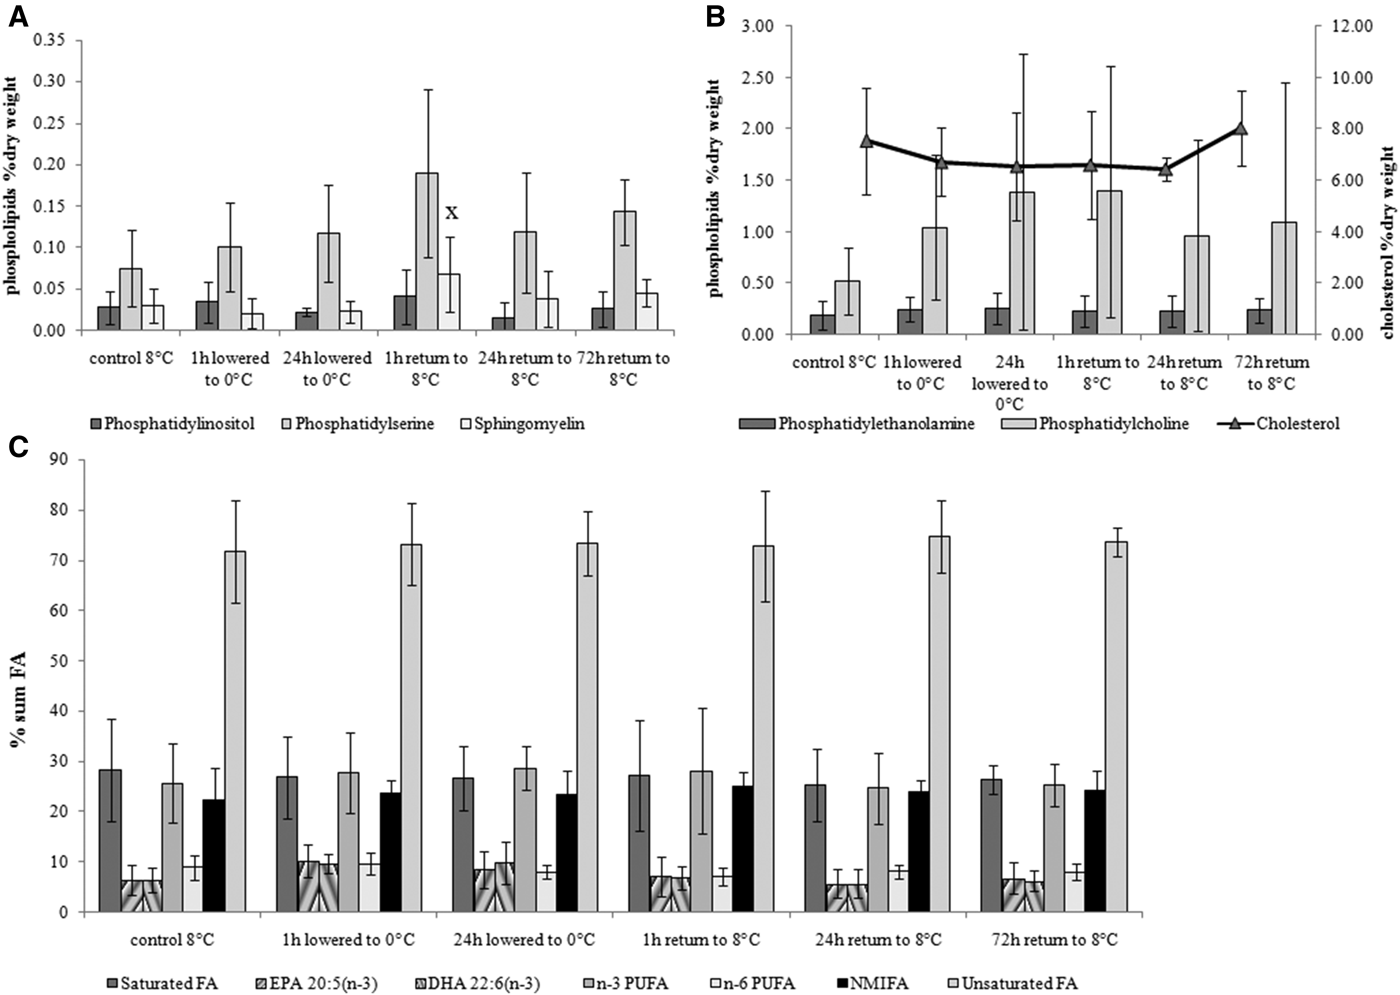
Temperature lowered from 8 to 0–3°C (1 and 24 h) and subsequent return to the initial temperature conditions (8°C) had no effect on the level of cholesterol, phospholipids and their fatty acid composition in blue mussel gills except for sphingomyelin content, which was increased at exposure to 8°C temperature for 1 h (Figure 2).
Changes in minor (A: phosphatidylinositol, phosphatidylserine and sphingomyelin) and major (B: phosphatidylcholine, phosphatidylethanolamine, cholesterol) membrane lipids and phospholipids fatty acid composition (C) in blue mussel Mytilus edulis gills in response to acute temperature drop from 8 to 0–3°C and return to the initial temperature of 8°C. Values are means ± SD (N = 5). Significant results in comparison of datasets are indicated by alphabet letters. Differences indicated with alphabetic letters were estimated by the non-parametric Mann–Whitney U test, P < 0.05: (x) – comparison of 24 h lowered to 0°C with 1 h return to 8°C; other variants of pair-wise comparisons showed no significant differences.
Long-term temperature effect
In the temperature acclimation experiment (14 days) the greatest changes in gill membrane fatty acid composition were revealed under low (5°C) temperature impact (Figure 3). Unlike low temperature impact, which produced an increased level of unsaturated fatty acids including non-methylene-interrupted ones (NMIFA) and decreased the saturated fatty acid concentration in mussel gills, high temperature impact (20°C) caused a reduction in n − 6 PUFA content. A rise in cholesterol level was noted at both temperature impacts (5 and 20°C). A significant increase in phosphatidylserine (PS) and sphingomyelin (SPH) content was observed in the mussels under high temperature (20°C) impact.
Changes in minor (A: phosphatidylinositol, phosphatidylserine and sphingomyelin) and major (B: phosphatidylcholine, phosphatidylethanolamine, cholesterol) membrane lipids and phospholipid fatty acid composition (C) in blue mussel Mytilus edulis gills in response to long-term temperature impact. Values are means ± SD (N = 5). Significant results in comparison with the control are indicated by asterisks and alphabet letters. Differences indicated with asterisks were estimated by the non-parametric Mann–Whitney U test, P < 0.05. Differences indicated with alphabetic letters – were estimated by the Kruskal–Wallis test with a Tukey post hoc test, P < 0.05: (x) – comparison of 5°C with 20°C; other variants of pair-wise comparisons showed no significant differences.
DISCUSSION
Gill membranes of bivalve molluscs represent the site of initial contact with environmental factors (temperature, salinity, etc.). Various kinds of environmental effects induce alterations in membrane physical properties (mainly fluidity) reflected in ion permeability and the activity of membrane-associated proteins (Hazel & Williams, Reference Hazel and Williams1990; Los & Murata, Reference Los and Murata2004). Cholesterol and phospholipids are the main lipid components of biological membranes. The ratio of phospholipids to cholesterol is considered as an indicator of membrane fluidity (Vance & Vance, Reference Vance and Vance2002). Cholesterol is an essential component in animal membranes with multiple effects on their fluidity. Cholesterol is known to increase the order of the surrounding fatty acid chains in membranes (Crockett, Reference Crockett1998; Pernet et al., Reference Pernet, Tremblay, Gionet and Landry2006). It should be noted that in some bivalve molluscs an increased gill cholesterol level was described under short-term temperature changes, whereas in response to long-term temperature acclimation modifications of phospholipids containing PUFA were observed (Pernet et al., Reference Pernet, Tremblay, Gionet and Landry2006; Parent et al., Reference Parent, Pernet, Tremblay, Sevigny and Ouellette2008). It was suggested that the use of cholesterol as a modulator may not require any expenditure of ATP or other reduced cofactors (Crockett, Reference Crockett1998) and hence the modulation of the phospholipid: cholesterol ratio probably provides a metabolically less expensive mechanism of membrane remodelling than de novo synthesis of PUFA-rich phospholipids (Pernet et al., Reference Pernet, Tremblay, Gionet and Landry2006; Parent et al., Reference Parent, Pernet, Tremblay, Sevigny and Ouellette2008). In contrast to these previous reports, the increased cholesterol content in the gills of White Sea blue mussels was probably due to its additional synthesis, required to stabilize gill membrane fluidity under long-term (14 days) exposure to both low (5°C) and high (20°C) temperature, whereas in response to short-term (1 day) temperature stress changes in phospholipid content and their fatty acid composition were noted. A decrease in major membrane phospholipids as well as their minor fractions under rapid temperature change (1 h) from 8 to 0–3°C presumably reflected a non-specific stress reaction of blue mussels to abrupt temperature drop. Prolonged exposure of the mussels to 0–3°C for 24 h caused an increase in the content of a majority of phospholipids and their n-3 PUFA. It is well known that Bivalves cannot de novo synthesize long-chain PUFA (such as EPA and DHA), which need to be obtained from the diet (Pernet et al., Reference Pernet, Tremblay, Gionet and Landry2006). It was suggested that the incorporation and elimination of essential fatty acids in membrane lipids in bivalve molluscs is strongly regulated (Delaunay et al., Reference Delaunay, Marty, Moal and Samain1993; Soudant et al., Reference Soudant, Marty, Moal, Masski and François Samain1998; Parent et al., Reference Parent, Pernet, Tremblay, Sevigny and Ouellette2008; Pernet et al., Reference Pernet, Tremblay, Redjah, Sévigny and Gionet2008). The adaptive mechanism of fatty acid membrane lipids regulation (mainly PUFA-rich phospholipids) to counteract the short-term low temperature effects in the gills of White Sea blue mussels is perhaps less energy expensive than additional synthesis of cholesterol, whereas to acclimate to a long-term low temperature exposure blue mussels use both these mechanisms. Moreover, blue mussel acclimation to 5°C temperature during 14 days promoted an increase in the level of gill phospholipid unsaturated fatty acids together with non-methylene-interrupted fatty acids (NMIFA), which are believed to be also involved in regulation of membrane fluidity in poikilothermic organisms (Rabinovich & Ripatti, Reference Rabinovich and Ripatti1991; Pernet et al., Reference Pernet, Tremblay, Gionet and Landry2006; Barnathan, Reference Barnathan2009). Bivalve molluscs are known to be able to de novo synthesize NMIFA (Zhukova, Reference Zhukova1991). Apparently, blue mussels use the ability for additional synthesis of these fatty acids, which allows them to regulate membrane fluidity under low temperature impact.
Increased PS and SPH content in the gills of mussels acclimated at 20°C and in response to a temperature rise from 0–3 to 8°C can be presumed to indicate changes in the membrane structure and properties (mainly fluidity). A similar response of these phospholipids was noted in our previous study on the experimental effect of salinity on lipid and fatty acid composition of blue mussels Mytilus edulis L. from the White Sea (Nemova et al., Reference Nemova, Fokina, Nefedova, Ruokolainen and Bakhmet2013). It was assumed that in the situation of seawater desalination an increased content of SPH, which plays a multiple role in regulation of cell functions (Vance & Vance, Reference Vance and Vance2002), contributes to the acclimation of blue mussels to low salinity (Nemova et al., Reference Nemova, Fokina, Nefedova, Ruokolainen and Bakhmet2013). Moreover, the rise in PS content in mussel gills exposed to both low and high seawater salinities was supposed to modify the activity of membrane-associated enzymes, ion channels and pumps (Nemova et al., Reference Nemova, Fokina, Nefedova, Ruokolainen and Bakhmet2013). Since these phospholipids are involved in different aspects of cell metabolism, including cell volume regulation, we assume that PS and SPH in conjunction with cholesterol can contribute to adjusting membrane fluidity to prevent the adverse effect of high temperature. It is known that high temperature stress can cause damage to membrane lipids, which can increase the permeability of cell membranes (Kültz, Reference Kültz2005) and induce osmotic changes in gills (Nordlie, Reference Nordlie2009).
Thus, the changes in lipid composition in blue mussel Mytilus edulis gills in response to a rapid temperature change (1 h) is assumed to be a consequence of non-specific physiological reaction of the bivalve to environmental stress (such as shell valves closing). On the other hand, a recovery period longer than 24 h after a temperature decrease, as well as long-term temperature acclimation (14 days), led to modifications in the gill fatty acid composition (for instance, increased unsaturated fatty acids content under low temperature influence) indicating ‘homeoviscous adaptation’ to maintain the membrane integrity and permeability in mussel gills under temperature fluctuations. Keeping in mind the cellular stress response described by Kültz (Reference Kültz2005), one may assume changes in the mussel gill lipid composition in response to acute temperature impact represent its physiological adaptive mechanism and serve the protection of cell membranes (termed ‘cellular stress response’), whereas the lipid composition reaction to long-term temperature influence is to maintain and restore the cell membrane homeostasis under new environmental conditions (termed ‘cellular homeostatic response’).
ACKNOWLEDGEMENTS
The authors are grateful to staff of the White Sea Biological Research Station ‘Kartesh’ of the Zoological Institute of RAS for the possibility to carry out research at the station. We are also deeply grateful to I.V. Sukhovskaya, PhD, researcher at the Laboratory of Ecological Biochemistry, Institute of Biology, Karelian Research Centre of RAS for assistance in conducting the experiments and sampling of mussels.
FINANCIAL SUPPORT
The study was supported by federal funding for governmental-order project theme No. 51.3, No. 01201358735 and grants from the Russian Presidential programme ‘Leading Scientific Schools’ SS 1642.2012.4 and SS-1410.2014.4, the Russian Foundation for Basic Research No. 12-04-93081-Norv_a and No. 12-04-32205-mol_a, the RAS Presidium programme ‘Living Nature’ (Reg. no 01201262107).