Introduction
The endocannabinoid (eCB) system, including eCBs, cannabinoid receptors, and enzymes regulating the level of eCBs, is present in the central nervous system of all mammals. In most cases, eCBs act as retrograde messengers binding to the widely distributed CB1 receptors (CB1Rs) to inhibit the neurotransmitter release at both excitatory and inhibitory synapses (Kreitzer & Regehr, 2001Reference Kreitzer and Regehr a ,Reference Kreitzer and Regehr b ; Ohno-Shosaku et al., Reference Ohno-Shosaku, Maejima and Kano2001; Wilson & Nicoll, Reference Wilson and Nicoll2001; Freund et al., Reference Freund, Katona and Piomelli2003; Yazulla, Reference Yazulla2008). In addition to the two main cannabinoid receptors [CB1R and CB2 receptor (CB2R)], G protein-coupled receptor 55 (GPR55) has been suggested as a cannabinoid receptor since it is activated by anandamide, an endogenous cannabinoid, and tetrahydrocannabinol, an exogenous cannabinoid (Ryberg et al., Reference Ryberg, Larsson, Sjogren, Hjorth, Hermansson, Leonova, Elebring, Nilsson, Drmota and Greasley2007). In fact, GPR55 is a receptor that is also responsive to other cannabinoids (Oka et al., Reference Oka, Nakajima, Yamashita, Kishimoto and Sugiura2007; Ryberg et al., Reference Ryberg, Larsson, Sjogren, Hjorth, Hermansson, Leonova, Elebring, Nilsson, Drmota and Greasley2007). While GPR55 is implicated in several physiological and pathophysiological functions (Liu et al., Reference Liu, Song, Jones and Persaud2015), its role in the retina is as yet unknown. Early case reports in the 1970s suggested the existence of cannabis-mediated visual effects in humans, although the specific mechanisms or activation pathways are still not defined. Cannabis consumption can lead to an increase in glare recovery for low contrast stimuli (Adams et al., Reference Adams, Brown, Haegerstrom-Portnoy, Flom and Jones1978), a reduction in Vernier and Snellen acuities (Kiplinger et al., Reference Kiplinger, Manno, Rodda and Forney1971; Adams et al., Reference Adams, Brown, Flom, Jones and Jampolsky1975), blurred vision (Noyes et al., Reference Noyes, Brunk, Avery and Canter1975), and changes in color discrimination and photosensitivity (Dawson et al., Reference Dawson, Jimenez-Antillon, Perez and Zeskind1977). Given that most of these effects undoubtedly have a retinal component, recent investigations have focused on examining the endogenous cannabinoid system in the retina.
Cannabinoid receptor expression patterns are well documented in rodent and primate retinas (Yazulla et al., Reference Yazulla, Studholme, McIntosh and Deutsch1999; Straiker et al., Reference Straiker, Stella, Piomelli, Mackie, Karten and Maguire1999a ,Reference Straiker, Maguire, Mackie and Lindseyb; López et al., Reference López, Tagliaferro, Onaivi and López-Costa2011; Zabouri et al., Reference Zabouri, Bouchard and Casanova2011a ,Reference Zabouri, Ptito, Casanova and Bouchard b ; Cécyre et al., Reference Cécyre, Zabouri, Huppé-Gourgues, Bouchard and Casanova2013), including vervet monkeys (Bouskila et al., Reference Bouskila, Burke, Zabouri, Casanova, Ptito and Bouchard2012, Reference Bouskila, Javadi, Casanova, Ptito and Bouchard2013a ,Reference Bouskila, Javadi, Casanova, Ptito and Bouchard b ). The latter species were used as the animal model to study the distribution of cannabinoid receptors in the retina and revealed cell-type specific expression profiles of CB1R, CB2R, and GPR55. While CB1R is present in retinal neurons (Bouskila et al., Reference Bouskila, Burke, Zabouri, Casanova, Ptito and Bouchard2012) and CB2R is strictly expressed in glial Müller cells (Bouskila et al., Reference Bouskila, Javadi, Casanova, Ptito and Bouchard2013a ), GPR55 is exclusively found in rod photoreceptors (Bouskila et al., Reference Bouskila, Javadi, Casanova, Ptito and Bouchard2013b ). A variety of anatomical and functional visual effects of cannabinoids have also been reported for every retinal cell type in both rodents and fish (Yazulla, Reference Yazulla2008; Cécyre et al., Reference Cécyre, Zabouri, Huppé-Gourgues, Bouchard and Casanova2013). However, these studies did not investigate GPR55 because of its recent and controversial deorphanization as a cannabinoid receptor (Henstridge et al., Reference Henstridge, Balenga, Ford, Ross, Waldhoer and Irving2009). Despite neuroanatomical and physiological evidence showing that the eCB system can modulate the activity of retinal cells in mammals, very little is known about the specific contribution of GPR55 in retinal functioning. Only one study has reported that palmitoylethanolamide can increase aqueous humor outflow through the trabecular meshwork, which appears to be mediated by GPR55 (Kumar et al., Reference Kumar, Qiao, Kumar and Song2012). This finding indirectly suggests that GPR55 plays a role in the eye.
Full-field electroretinography is widely used as a measure of retinal function (McCulloch et al., Reference McCulloch, Marmor, Brigell, Hamilton, Holder, Tzekov and Bach2015). Electroretinogram (ERG) recordings represent the sum of electrical current over the entire retina, light-evoked responses in photoreceptors (cones and rods), neurons (horizontal cells, bipolar cells, amacrine cells, and ganglion cells), glial cells (Müller cells), and epithelial cells (Steinberg et al., Reference Steinberg, Linsenmeier and Griff1985). Amplitude, latency, and overall shape of the ERG waves depend on the intensity of the flash and its duration, as well as the adaptation state of the retina. While scotopic ERGs represent the contribution of the rod system in dark-adapted conditions, photopic ERGs represent the contribution of the cone system in light-adapted conditions. In the present study, we investigated the effect of the intravitreal injection of lysophosphatidylglucoside (LPG), an agonist of GPR55 (Guy et al., Reference Guy, Nagatsuka, Ooashi, Inoue, Nakata, Greimel, Inoue, Nabetani, Murayama, Ohta, Ito, Aoki, Hirabayashi and Kamiguchi2015), or CID16020046 (CID), a selective GPR55 antagonist (Kargl et al., Reference Kargl, Balenga, Parzmair, Brown, Heinemann and Waldhoer2012), on the dark-adapted and light-adapted full-field ERGs in vervet monkeys. Given that GPR55 is exclusively expressed in rods (Bouskila et al., Reference Bouskila, Javadi, Casanova, Ptito and Bouchard2013b ), we hypothesized that the modulatory effect of GPR55 would manifest itself only in the ERG curves obtained in scotopic conditions.
Material and methods
Animals
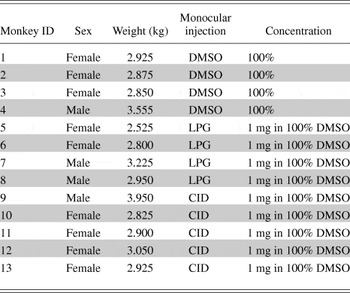
A total of 13 adult vervet monkeys (Chlorocebus sabaeus) were used for this study: four monkeys received an intravitreal injection of dimethyl sulfoxide (DMSO, the vehicle), four monkeys were monocularly injected with LPG (a selective agonist of GPR55), and five monkeys with CID (a potent and selective antagonist of GPR55) (Table 1). The animals were born and raised in enriched environments in the laboratories of the Behavioral Science Foundation (St-Kitts, West Indies). The animals were fed with primate chow (Harlan Teklad High Protein Monkey Diet; Harlan Teklad, Madison, WI) and fresh local fruits, with water available ad libitum. All experiments were performed according to the guidelines of the Canadian Council on Animal Care (CCAC) and the Association for Research in Vision and Ophthalmology (ARVO) Statement for the Use of Animals in Ophthalmic and Vision Research. The experimental protocol was also reviewed and approved by the local Animal Care and Use Committee (University of Montreal, Protocol No. 14-007) and the Institutional Review Board of the Behavioral Science Foundation. None of the animals were sacrificed for this study.
Profile of the animals used in this study

Animal preparation for ERG recording
The method for ERG recordings in the vervet monkey has been previously described (Bouskila et al., Reference Bouskila, Javadi, Palmour, Bouchard and Ptito2014) and is briefly reported here. The animals were sedated with an intramuscular injection of a mixture of ketamine (10 mg/kg; Troy Laboratories, Glendenning, New South Wales, Australia) and xylazine (1 mg/kg; Lloyd Laboratories, Shenandoah, IA). This mixture has a minimal effect on the ERG (Nair et al., Reference Nair, Kim, Nagaoka, Olson, Thule, Pardue and Duong2011). The depth of sedation was maintained at a sufficient level to prevent the animals from moving, but without causing respiratory depression. In this condition, the pupils were fully dilated to approximately 9 mm in diameter and the accommodation reflex was paralyzed with topical application of 1% tropicamide (Mydriacyl®) and 2.5% phenylephrine hydrochloride (Mydfrin®) (Alcon Laboratories, Fort Worth, TX). Intraocular pressure was monitored before and after the recording session by applanation tonometry (TonoPen XL®, Reichert Technologies, Depew, NY). The eyes were treated with 0.5% proparacaine hydrochloride (Alcaine®, Alcon Laboratories, Fort Worth, TX) to anesthetize the cornea. The eyes were then protected by application of 2.5% methylcellulose (Gonak; Akorn, Inc., Buffalo Grove, IL) to prevent corneal drying. Body temperature was maintained between 36.5 and 38°C with a heating pad. Recording sessions lasted approximately 2 h for each animal, after which they were allowed to recover in their cage, and then returned to their prior naturalistic setting.
Drug administration
Intravitreal injections were performed in one eye only when the animals were in a sedated state. After inspection and examination of the eyes and lids, a topical anesthetic was applied over the injection site. The conjunctival and corneal surfaces were then moistened with methylcellulose (Moisture Eyes, Bausch Lomb, Rochester, NY) for 3 min. The eye was covered with sterile coatings and a Barraquer eye speculum (1.75 in., 10 mm wide small blades; Storz Ophthalmics, St Louis, MO) held the eyes open. The LPG was synthesized using the method described by Guy et al. (Reference Guy, Nagatsuka, Ooashi, Inoue, Nakata, Greimel, Inoue, Nabetani, Murayama, Ohta, Ito, Aoki, Hirabayashi and Kamiguchi2015), where its specificity and selectivity were successfully tested on the spinal cord of mice and chicken. The antagonist CID was purchased from Tocris Bioscience (Cat. No. 4959, Ellisville, MO). With a 30G needle, 50 μL of drug solution (LPG or CID) were injected into the vitreous cavity, 2 mm posterior to the corneal limbus. A similar volume (50 μL) of the vehicle DMSO was injected into the vitreous of one eye in four control animals in order to rule out the possibilities that the injection per se and/or change in intraocular pressure caused the effects attributed to the drugs. When the needle was removed, the injection site was compressed for a minute using a sterile cotton swab to avoid reflux. Before and after ERGs recordings, the fundi of both eyes were inspected with a PanOptic ophthalmoscope (Welch Allyn, New York, NY). The following week, topical antibiotic ointment was administered to the eye that had been injected, twice daily for 4 days.
Visual stimulation
Full-field stimulation was produced with an UTAS BigShot Ganzfeld light source (UTAS E-3000 electrophysiology equipment; LKC Technologies, Inc., Gaithersburg, MD) that was placed in front of the animal’s face. The intensity of the flashes ranged from 0.00025 to 790 (cd s)/m2 delivered in full-field conditions, with a duration of <5 ms. Xenon flash luminance of 2.5 to 790 (cd s)/m2 (0–25 dB in LKC units) was used for photopic conditions and Light-Emitting Diode (LED) flash luminance of 2.5 × 10⁻⁴ to 6 (cd s)/m2 (−40 to 4 dB in LKC units) for scotopic conditions. Between stimuli, delay intervals of at least 15 s were implemented at high flash intensities when the eyes were dark-adapted. In light-adapted conditions, a steady background-adapting field (30 cd/m2) was maintained inside the Ganzfeld to continually saturate the rod system. Flash intensities and background luminance were calibrated using a research radiometer (IL1700 Photometer, International Light Inc., Newburyport, MA) with a SED033 detector placed at 36 cm from the source (at the same location as the cyclopean eye).
ERG recording
All experimental protocols followed the guidelines of the ISCEV (Marmor et al., Reference Marmor, Fulton, Holder, Miyake, Brigell and Bach2009; Bouskila et al., Reference Bouskila, Javadi, Palmour, Bouchard and Ptito2014; McCulloch et al., Reference McCulloch, Marmor, Brigell, Hamilton, Holder, Tzekov and Bach2015). ERG recordings and signal processing ERGs were carried out in the morning. The recorded eye was covered with a corneal contact lens electrode (Jet electrodes, Diagnosys LLC, Lowell, MA) moistened with 1% carboxymethylcellulose sodium (Refresh Celluvisc, Allergan Inc., Markham, ON). The electrode was equipped with four small posts that kept the eyelid open. Reference and ground gold disc electrodes (model F-E5GH; Grass Technologies, Astro-Med, Inc., West Warwick, RI) were kept in place with adhesive paste (Ten20 conductive EEG paste, Kappa Medical, Prescott, AZ) at the external canthi and forehead, respectively. Responses were amplified 10,000 times and filtered with a band pass from 1 to 500 Hz except for the oscillatory potentials, which were extracted with the LKC software with a band pass from 75 to 500 Hz. Each trace included a 20 ms pre-stimulus baseline. The recording protocol for assessing the effect of the drugs is summarized in Figure 1.
Schematic illustration depicting a typical ERG recording session following monocular intravitreal injections in vervet monkeys. DMSO, dimethyl sulfoxide; LPG, lysophosphatidylglucoside; CID, CID16020046; LA, light adaptation; Phot, photopic.

Statistical analysis
For the waveform analysis, the amplitude of the a-wave was measured from the baseline to the trough of the a-wave. The amplitude of the b-wave was measured from the trough of the a-wave to the peak of the b-wave. The latency was defined from the onset of the flash to the trough (a-wave) or peak (b-wave). If these values fell within the acceptable time window (a-wave: 10–50 ms from flash, b-wave: 50–150 ms from flash), and they were within 3 s.d. above or below the mean, then they were saved. A repeated measure analysis of variance (ANOVA) was used to determine if the values extracted from the ERG curves in the DMSO-injected group were different from the LPG-injected group or the CID-injected group. Each mixed model ANOVA included one repeated measures factor (intensity of the flash) and one between group factors (drug: DMSO, LPG, or CID).
Results
No changes in the fundus of the eyes were observed after the intravitreal injection in any of the animals. There were also no differences in the intraocular pressure (before: 11 ± 3 mm Hg; after: 11 ± 4 mm Hg) or the pupil size (before: 8.8 ± 0.3 mm; after: 8.8 ± 0.3 mm).
LPG increases the scotopic b-wave amplitude
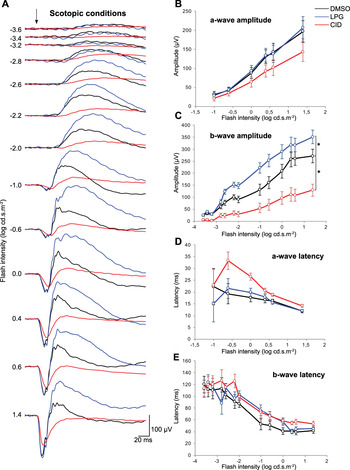
The effect of LPG on the scotopic ERG was comparable across monkeys. Fig. 2A illustrates the average ERG waveform in dark-adapted conditions following the intravitreal injection of DMSO, LPG, or CID at 13 stimulus intensities. Each curve was generated from a simple mean across monkeys. As can be seen in the traces, the intravitreal injection of LPG increases the amplitude of the scotopic ERG. This effect was not significant for the a-wave amplitude (P = 0.972, Fig. 2B), but was significant for the b-wave amplitude (P = 0.050, Fig. 2C). On average, LPG caused the scotopic b-wave amplitude to increase by 36% relative to the control (DMSO).
Increase of the scotopic b-wave amplitude after intravitreal injection of LPG and decrease after CID. (A) Mean scotopic ERG responses after intravitreal injection of DMSO (black), LPG (blue), or CID (red) are shown for 13 flash intensities. On the one hand, the intravitreal injection of LPG, a GPR55 agonist, significantly increased the b-wave amplitudes. On the other hand, an overall significant decreased in the b-wave amplitude is observed after CID injection. (B–E) Averaged ERG amplitude and latency values are plotted as a function of flash intensities following injection. Error bars represent ±s.e.m. The * indicates a significant overall difference (P < 0.05) of CID and DMSO, or LPG and DMSO.

In addition, the effect was significant at several specific flash intensities [−2.6 log (cd s)/m2, P = 0.010; −2.2 log (cd s)/m2, P = 0.007; −2.0 log (cd s)/m2, P = 0.012; −1.0 log (cd s)/m2, P = 0.015; −0.6 log (cd s)/m2, P = 0.028] and marginally significant at other flash intensities [0 log (cd s)/m2, P = 0.077; 1.4 log (cd s)/m2, P = 0.074]. At the rod standard flash [−2.2 log (cd s)/m2], a flash intensity that corresponds to rod-driven responses, the increase caused by the injection of LPG was 52 ± 18 μV (52% relative to DMSO). At the combined rod-cone standard flash [0.6 log (cd s)/m2], a flash intensity that corresponds to mixed-rod-cone responses, LPG lead to an increase of 56 ± 40 μV (22% relative to DMSO). The latencies of LPG were comparable to DMSO [no significant difference for a-wave latency (P = 0.915, Fig. 2D) or the b-wave latency (P = 0.413, Fig. 2E)].
CID decreases the scotopic b-wave amplitude
The effect of CID on the scotopic ERG was comparable across monkeys. Fig. 2A illustrates the average ERG waveform in scotopic conditions. The most apparent feature of these curves is that the intravitreal injection of CID decreased the amplitude of the scotopic ERG. This effect was not significant for the a-wave amplitude (P = 0.197, Fig. 2B), but was significant for the b-wave amplitude (P = 0.004, Fig. 2C). CID had no significant effect on the latency for the a-wave (P = 0.113, Fig. 2D) or the b-wave (P = 0.089, Fig. 2E). The average decrease of the scotopic b-wave amplitude was 66%.
In addition, the effect of CID on the amplitude of the b-wave was significant at every individual flash intensity [−3.6 log (cd s)/m2, P = 0.003; −3.4 log (cd s)/m2, P = 0.003; −3.2 log (cd s)/m2, P = 0.002; −2.8 log (cd s)/m2, P = 0.018; −2.6 log (cd s)/m2, P = 0.003; −2.2 log (cd s)/m2, P = 0.001; −2.0 log (cd s)/m2, P = 0.006; −1.0 log (cd s)/m2, P = 0.027; −0.6 log (cd s)/m2, P = 0.024; 0 log (cd s)/m2, P = 0.016; 0.4 log (cd s)/m2, P = 0.007; 0.6 log (cd s)/m2, P = 0.002; 1.4 log (cd s)/m2, P = 0.004]. At the rod standard flash [−2.2 log (cd s)/m2], CID decreased the b-wave amplitude by 66 ± 15 μV (67%) relative to DMSO. At the combined rod-cone standard flash [0.6 log (cd s)/m2], CID decreased the b-wave amplitude by 153 ± 37 μV (59%) relative to DMSO.
The oscillatory potentials are not affected by either compound
A one-way ANOVA was performed on the summed amplitude of the oscillatory potentials at the standard flash [optimal intensity of 0.6 log (cd s)/m2; Bee, Reference Bee2001; Bouskila et al., Reference Bouskila, Javadi, Palmour, Bouchard and Ptito2014]. The results show that there was no significant difference between the vehicle and the agonist for the amplitude (DMSO,
 $\bar x$
= 61.9 ± 14.4 μV; LPG,
 $\bar x$
= 68.9 ± 11.3 μV; P = 0.674) or latency (DMSO,
 $\bar x$
= 21.0 ± 0.6 ms; LPG,
 $\bar x$
= 20.5 ± 0.4 ms; P = 0.724). A non-significant effect was also found between the vehicle and the antagonist for the amplitude (CID,
 $\bar x$
= 36.0 ± 7.9 μV; P = 0.122) and the latency (CID,
 $\bar x$
= 18.8 ± 1.2 ms; P = 0.123).
LPG has no significant effect on the photopic ERGs
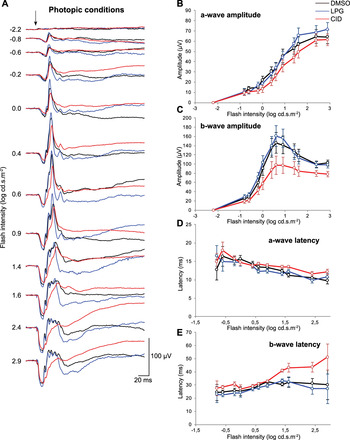
The effects of LPG on the photopic ERG were comparable across monkeys. Fig. 3A illustrates the average ERG waveform across monkeys in light-adapted conditions following intravitreal injection of DMSO, LPG or CID for 12 stimulus intensities. There were no significant effects of LPG for a-wave amplitude (P = 0.817, Fig. 3B), b-wave amplitude (P = 0.756, Fig. 3C), a-wave latency (P = 0.942, Fig. 3D), or b-wave latency (P = 0.727, Fig. 3E).
No significant changes in the photopic ERG responses after intravitreal injection of LPG or CID. (A) Mean photopic ERG responses after intravitreal injection of DMSO (black), LPG (blue), or CID (red) across 12 flash intensities are shown. (B–E) Averaged ERG amplitude and latency values plotted as a function of flash intensities following injection of DMSO (black), LPG (blue), or CID (red). Error bars represent ±s.e.m.

CID has no significant effect on the photopic ERGs
The effects of CID and DMSO on the photopic ERG were comparable across monkeys, see averages plotted in Fig. 3A. There was no statistically significant difference between CID and DMSO: a-wave amplitude (P = 0.321, Fig. 3B), b-wave amplitude (P = 0.067, Fig. 3C). CID also had no significant effect on the a-wave latency (P = 0.381, Fig. 3D) or the b-wave latency (P = 0.093, Fig. 3E).
Discussion
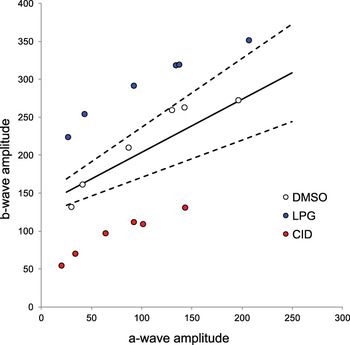
This study investigated the functional consequences of monocular intravitreal injections of potent and selective GPR55 agonist (LPG) or antagonist (CID) in monkeys. Using electroretinographic recordings, we showed that under scotopic conditions, the administration of LPG significantly increased the amplitude of b-wave responses while CID caused them to decrease. The scotopic latencies were not affected by either compound, and neither were the amplitudes or latencies recorded under photopic conditions. This is the first evidence that GPR55 is only involved in scotopic vision since its activation by LPG, and its blockade by CID, modulated the dim-light retinal responses driven by the rod pathway. The strength of this result is visible in Fig. 4, which depicts the relationship between the relative amplitudes of the b- and a-wave (Perlman, Reference Perlman1983). This figure illustrates scotopic retinal function, and its modulation by either blocking GPR55 (impaired retinal function, e.g., nyctalopia) or by activating it (increased retinal function, e.g., hyper-scotopia). The functional effects reported here are in line with the anatomical localization of GPR55 in rod photoreceptors and confirms its purported role in scotopic vision.
The relationship between the amplitudes of the b- and a-waves obtained in scotopic conditions. The continuous line describes the mean relationship while the two dashed lines define the normal range (mean ± 2 s.d.). White circles represent the amplitudes obtained after the DMSO injection, blue circles after LPG, and red circles after CID. Note that LPG data points are above the normal range (increased retinal function), while those for CID fall below (impaired retinal function).

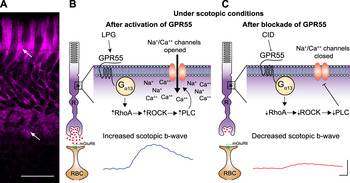
GPR55 belongs to the Class A rhodopsin-like family of G protein-coupled receptors. Expression of GPR55 in the retina is limited to rod inner segments (Bouskila et al., Reference Bouskila, Javadi, Casanova, Ptito and Bouchard2013b ), which is implicated in the generation of the scotopic ERG b-wave (Robson & Frishman, Reference Robson and Frishman1995; Tian & Slaughter, Reference Tian and Slaughter1995), although this is somewhat debated (Miller & Dowling, Reference Miller and Dowling1970; Wen & Oakley, Reference Wen and Oakley1990). Given the expression pattern of GPR55 (Fig. 5A), we hypothesized that antagonizing this receptor in the retina would lead to a decrease in the scotopic ERG b-wave. This is indeed what we found, which can be explained by GPR55’s influence on the glutamate pathway (Sylantyev et al., Reference Sylantyev, Jensen, Ross and Rusakov2013; Bouskila et al., Reference Bouskila, Javadi, Casanova, Ptito and Bouchard2013b ). We speculate that the presynaptic GPR55 in rods is coupled to G α13, and may have a role in the regulation of the postsynaptic mGluR6-signaling pathway in rod ON-bipolar cells. In normal conditions of dark adaptation, a large quantity of glutamate is released from rod photoreceptor terminals and binds to the metabotropic glutamate receptor mGluR6 located at the tip of ON-bipolar cell dendrites (Sampath & Rieke, Reference Sampath and Rieke2004). The activation of GPR55 in rods by LPG coupled to G α13, stimulates RhoA, Rho-associated protein kinase (ROCK), Phospholipase C (PLC) and opens Na+/Ca++ channels resulting in membrane depolarization (Bouskila et al., Reference Bouskila, Javadi, Casanova, Ptito and Bouchard2013b ) and hence an increased scotopic b-wave (Fig. 5B). Following the blockade of GPR55 with CID, the hyperpolarization of rods diminishes the release of glutamate (Fig. 5C). The putative activation of G α13, RhoA, ROCK and PLC is consequently lowered resulting in the closing of Na+/Ca++ channels, and hence a decreased scotopic ERG b-wave. Essentially, blocking GPR55 in the dark-adapted rod is like exposing it to photopic conditions (Bouskila et al., Reference Bouskila, Javadi, Casanova, Ptito and Bouchard2013b ). It was previously reported that failure to activate mGluR6 on rod ON-bipolar cells abolishes light responses (Sampath & Rieke, Reference Sampath and Rieke2004). Indeed, the speculation that GPR55 regulates guanosine triphosphate (GTP) hydrolysis of G α13 is also supported by the notion that phototransduction involves G α13, leading to the release of glutamate (Fig. 5). A detailed characterization of other molecules that act as agonists on GPR55 will be informative for treatments of ocular diseases, since activating this protein might be able to increase photosensitivity.
Overview of the putative cannabinoid receptor GPR55 signaling cascade. (A) Immunostaining of the vervet monkey retina with a rabbit anti-GPR55 antibody (1:200, magenta) showing that GPR55 is preferentially expressed in the inner segments of rod photoreceptors (upper arrow) and spherules (lower arrow). This observation is identical to the one previously reported (Bouskila et al., Reference Bouskila, Javadi, Casanova, Ptito and Bouchard2013b ). (B) Under scotopic conditions, the activation of GPR55 by LPG on rods coupled to G α13, RhoA, ROCK, and PLC opens Na+/Ca++ channels resulting in the membrane depolarization (Bouskila et al., Reference Bouskila, Javadi, Casanova, Ptito and Bouchard2013b ) and hence an increased scotopic b-wave. (C) Following the blockade of GPR55 with CID, the activation of G α13, RhoA, ROCK, and PLC is consequently lowered resulting in the closing of Na+/Ca++ channels, and hence a decreased scotopic ERG b-wave in the CID-treated eyes. The scotopic waveforms are taken from Fig. 2A at the rod standard flash, [−2.2 log (cd s)/m2]. LPG, lysophosphatidylglucoside; R, rods; RBC, rod bipolar cells. Scale bar in (A): 30 μm and in (B) and (C): amplitude (vertical axis), 100 μV; latency (horizontal axis), 20 ms.

Drug delivery directly into the eye in humans is a common treatment for retinal disorders. For example, intravitreal injections are often performed in the treatment of age-related macular degeneration and diabetic retinopathy (see Duvvuri et al., Reference Duvvuri, Majumdar and Mitra2003 for review). The effectiveness of treatments for retinal diseases has significantly improved since the introduction of medications administered directly into the vitreous because of their immediate effects. This procedure is now used on a daily basis in clinics to treat these aforementioned diseases. Night blindness (e.g., nyctalopia), a condition where it is nearly impossible to see in low light, is a symptom of many eye diseases like retinitis pigmentosa, Oguchi disease, and congenital stationary night blindness, which specifically targets the rods (Marc et al., Reference Marc, Jones, Watt and Strettoi2003). Given the present findings, implication of GPR55 in scotopic vision might therefore be exploited as a pharmacological target in the treatment of retinal diseases that include symptoms of night blindness.
Acknowledgments
The Natural Science and Engineering Research Council of Canada (6362-2012, M.P.; RGPAS 478115-2015 and RGPIN 2015-06582, J.F.B.; 194670-2014, C.C.) and the Canadian Institutes of Health Research (MOP-130337, C.C. and J.F.B.) supported this work. J.B. received support from a Frederick Banting and Charles Best Canada Graduate Scholarship Doctoral Award from CIHR. V.H. is supported by the Banting Postdoctoral Fellowship from CIHR. J.F.B. is supported by a “Chercheur-Boursier Senior” from the Fonds de recherche du Québec - Santé (FRQ-S). M.P. is Harland Sanders Chair professor in Visual Science. The authors would like to thank Dr. Amy Beierschmitt and Maurice Matthew, M.Sc. for their expert technical assistance in handling the monkeys. We are very grateful to the late Dr. Frank Ervin, Dr. Roberta Palmour, and the staff of the Behavioral Sciences Foundation Laboratories located in St Kitts, West Indies, for their continued support to our monkey work.