Implications
The automated and validated RFID system can be used in research experiments and on farm to track the drinking behaviour of individual pigs. Changes in the drinking behaviour of pigs can then be detected as an indicator of health, welfare and productivity problems. The measured behavioural patterns can thus form the basis of an (early) warning system for individual pigs with potential to improve productivity, health and welfare on farm. This experimental validation of the system showed which variables generated by the system are the best estimates for the actual drinking behaviour and thus could be of interest for problem detection.
Introduction
Monitoring of pig behaviour and appearance may reveal upcoming or present health, welfare and productivity problems (Weary et al., Reference Weary, Huzzey and von Keyserlingk2009). The most commonly used on-farm monitoring method is live visual examination of the animals. Such visual monitoring is time consuming and provides only a snapshot of the animals’ general state (Pluym et al., Reference Pluym, Maes, Vangeyte, Mertens, Baert, Van Weyenberg, Millet and Van Nuffel2013). Recent evolutions in sensor technology have created ways to automate this monitoring, thus providing more objective and repeatable data (Meiszberg et al., Reference Meiszberg, Johnson, Sadler, Carroll, Dailey and Krebs2009). Sensor-based monitoring can be done continuously, in real time and without disturbing the pigs (Wathes et al., Reference Wathes, Kristensen, Aerts and Berckmans2008). This automated monitoring can support the farmer to make interventions faster and more accurate, leading to reduced economic losses, more responsible use of antibiotics and increased health and welfare of the pigs.
Changes in drinking behaviour, as a part of the behavioural response of a pig to illness or reduced welfare, has been suggested as an indicator of a variety of problems (Madsen and Kristensen, Reference Madsen and Kristensen2005; Kruse et al., Reference Kruse, Traulsen, Salau and Krieter2011; Andersen et al., Reference Andersen, Dybkjær and Herskin2014). The drinking behaviour of a group of pigs as well as their water usage can be measured using flow meters or water meters (Li et al., Reference Li, Chenard, Lemay and Gonyou2005; Madsen and Kristensen, Reference Madsen and Kristensen2005). Cameras and image analysis can also be used to automatically monitor visits at the nipple drinkers (Kashiha et al., Reference Kashiha, Bahr, Haredasht, Ott, Moons, Niewold, Ödberg and Berckmans2013). Drinking is closely related to feeding behaviour (Bigelow and Houpt, Reference Bigelow and Houpt1988) and thus to production. Ahmed et al. (Reference Ahmed, Mun, Yoe and Yang2015) showed that both feeding and drinking are directly influenced by the occurrence of stress or disease. However, drinking behaviour is also influenced by BW, age, temperature, humidity, diet, group size, time of the day, the drinking device itself, etc. (Mroz et al., Reference Mroz, Jongbloed, Lenis and Vreman1995; Turner et al., Reference Turner, Sinclair and Edwards2000). Drinking behaviour varies among individuals even under similar environmental conditions, genetics, weight and age. This justifies automatic monitoring of each individual pig instead of the group of pigs. Individual monitoring could also provide a more accurate and earlier detection of individual problems before the situation deteriorates or affects more pigs.
Individual monitoring requires identification of the animals approaching the nipple to drink. Recently, Junge et al. (Reference Junge, Jezierny, Gallmann and Jungbluth2013) and Andersen et al. (Reference Andersen, Dybkjær and Herskin2014) used radio frequency identification (RFID) systems to identify the individual drinking pig. An RFID tag with a unique identification code can be attached to the animal. The RFID tag can be detected at the drinking device using an antenna and reader unit (Ruiz-Garcia and Lunadei, Reference Ruiz-Garcia and Lunadei2011). Most RFID systems used for animal identification are low frequency (LF) RFID (Junge et al., Reference Junge, Jezierny, Gallmann and Jungbluth2013; Andersen et al., Reference Andersen, Dybkjær and Herskin2014). However, RFID systems at higher frequencies (such as high frequency (HF) and ultra high frequency (UHF)) can read several tags simultaneously (Maselyne et al., Reference Maselyne, Van Nuffel, De Ketelaere, Vangeyte, Hessel, Sonck and Saeys2014a), which provides more possibilities for identification of multiple animals in group housing systems. In a previous study, the potential of HF RFID was illustrated for measuring the feeding behaviour of multiple pigs at the feed trough (Maselyne et al., Reference Maselyne, Saeys, De Ketelaere, Mertens, Vangeyte, Hessel, Millet and Van Nuffel2014b).
Up till now, RFID systems have been used in conjunction with a flow meter to measure water intake of individual animals (Junge et al., Reference Junge, Jezierny, Gallmann and Jungbluth2013; Andersen et al., Reference Andersen, Dybkjær and Herskin2014). However, flow meters cost extra, require maintenance and may have troubles with varying water quality. Estimating water intake based on drinking behaviour as registered with an RFID system would eliminate those problems. With repeated identifications at a certain frequency, the duration and timing of presence of the pig at the water nipple could be measured. Validation of automatically gathered behavioural data is typically done by comparing with observations (Maselyne et al., Reference Maselyne, Saeys, De Ketelaere, Mertens, Vangeyte, Hessel, Millet and Van Nuffel2014b). Meiszberg et al. (Reference Meiszberg, Johnson, Sadler, Carroll, Dailey and Krebs2009) doubted the suitability of observations to measure drinking behaviour; however, they suggested flow meters as a more accurate technique.
Before data from RFID registrations can be useful to the farmer, the raw registrations have to be converted into relevant information. The RFID registrations can be transformed into variables of drinking behaviour such as number of drinking visits and duration of drinking by joining RFID registrations together into drinking visits (Maselyne et al., Reference Maselyne, Saeys and Van Nuffel2015). Such variables are more useful to the farmer than raw RFID data and can be used for a health monitoring system based on time series of individual pigs’ drinking behaviour (Madsen et al., Reference Madsen, Andersen and Kristensen2005; Kruse et al., Reference Kruse, Traulsen, Salau and Krieter2011).
This paper represents a first step towards monitoring the drinking behaviour of individual pigs housed in group. The objectives of this manuscript were to (1) develop a novel HF RFID system for this purpose, (2) transform the RFID data into variables of drinking behaviour and (3) validate the RFID-based drinking behaviour in comparison with live observations and flow meter readings.
Material and methods
Animals and housing
All experiments were performed at the experimental farm at the Institute for Agricultural and Fisheries Research (ILVO, Melle, Belgium). The automatically ventilated pen measured 4.3×9 m, with 1.7×9 m slatted concrete flooring and the remaining section was solid flooring. The pigs were fed ad libitum using two feeders with a commercial dry pelleted feed (net energy content of 9.3 MJ, protein content of 15.5% with 0.92% lysine in total). Water was supplied ad libitum through four bite nipple drinkers (Suevia Haiges GmbH, Kirchheim am Neckar, Germany) set at ~0.8 l/min. These nipples were placed above the slatted floor, along the 9-m-long wall of the pen, 2 m apart.
During the measurements, 26 barrows and 29 gilts (Piétrain×hybrid sow) were in the pen. They were introduced to the pen at 25.0±3.4 kg (mean±s.d.) and 66±2 days (mean±s.d.) old. Average daily growth in the pen was 0.65 kg/day during the entire fattening period. The pigs were slaughtered around 110 kg. National legislation for the use of animals was respected. According to Belgian and EU legislation (Council Directive 86/609/EEC), no procedures were used requiring approval from the local ethics committee.
Measurements
RFID system
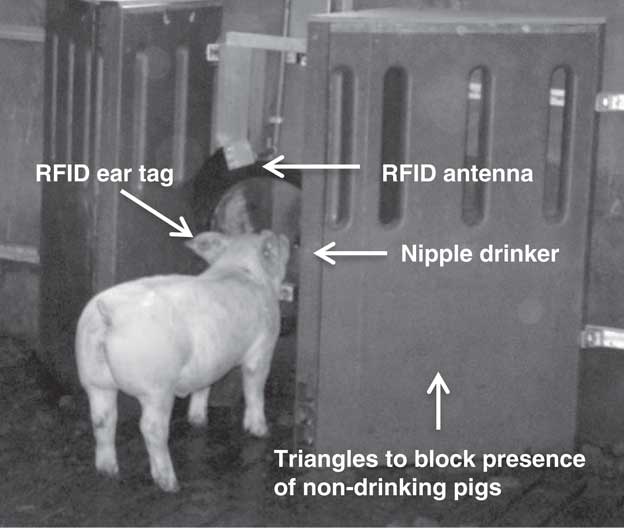
A round HF RFID antenna (DTE Automation GmbH, Enger, Germany) was installed around each nipple drinker, parallel to the wall (Figure 1). Common pen division panels were constructed in a triangle shape and placed at each side of the nipple to block pigs that were not drinking from being close to the antenna (Figure 1). The four antennas were connected to one reader (ID ISC.LR2500-A; Feig Electronic GmbH, Weilburg, Germany) using a multiplexer (ID ISC.ANT.MUX-A; Feig Electronic GmbH). Each antenna was addressed turn-by-turn every 2±1 s (mean±s.d.). The reader was connected to a computer for continuous data logging. Each pig was fitted with two HF RFID tags (IN Tag 300 I-Code SLI; HID Global Corporation, Austin, TX, USA) at the time of introduction in the pen, one in each ear. For more information on the RFID tags, the RFID system and its measurement range, see Maselyne et al. (Reference Maselyne, Van Nuffel, De Ketelaere, Vangeyte, Hessel, Sonck and Saeys2014a and Reference Maselyne, Saeys, De Ketelaere, Mertens, Vangeyte, Hessel, Millet and Van Nuffel2014b).
RFID system installed around the nipple drinker enables identifying drinking pigs. RFID=radio frequency identification.

Flow meters
Turbine flow meters (FT210-Turboflow; Gems Sensors & Controls Inc., Plainvilles, CT, USA) were installed before each nipple drinker. The frequency of the square wave output signal from the flow meters was logged at 1 Hz and was a measure for the flow through the nipple. This was used to calculate the water usage per second. A flow <0.1 l/min was not considered significant (below measurement range of flow meter). Flow meter visits were defined as uninterrupted bouts of water usage and were only considered significant when the duration was >1 s. Logging of the flow meters was done at test-day 1 and on the same computer as the RFID signals. Owing to technical problems, one of the four flow meters did not give an accurate indication of flow, but the start- and stop-second of drinking at this nipple could still be measured.
Observations
To validate the RFID system, live observations of the drinking behaviour were performed for all 55 pigs (marked with a number) using The Observer 5.0 software (Noldus Information Technology; Wageningen, The Netherlands) and a portable computer. Start- and stop-time of drinking was noted, along with the number of the pig and the nipple from which it was drinking. All other behaviours close to the nipple drinkers (in the range of the RFID antenna as determined in Maselyne et al., Reference Maselyne, Van Nuffel, De Ketelaere, Vangeyte, Hessel, Sonck and Saeys2014a) were also noted. Observations were spread over 2 days (1 and 3 October 2013 – test-day 1 and 2), resulting in 6 h of observation for each nipple, or 24 h in total. The pigs were 142±2 days (mean±s.d.) old and weighed 68.2±8.9 kg (mean±s.d.) at the time of observations. Synchronisation between the barn computer (for RFID and flow meter logging) and the portable computer (for observation data logging) was limited to the accuracy of the individual computer clocks. The clocks were synchronised at the start of the observations, but were no longer synchronised by the end of the observations.
Extracting the drinking behaviour from the RFID registrations
As RFID registrations were not continuous, ‘visit criteria’ were necessary in order to extract drinking visits from the registrations. First, a bout criterion was defined as the maximum time gap between registrations of the same pig at the same nipple so that these registrations can be considered part of the same drinking visit. In total, 20 bout criteria were tested, from 1 to 20 s long, using both tags of the pig. Second, constructed visits were only withheld when both tags of the pig were registered at least once during the drinking visit. Last, the duration of drinking visits was limited between a minimum and a maximum duration. No significant water intake was assumed in visits <3 s. Pigs were sometimes observed to stay near the RFID antenna and nipple for a long time while sleeping, lying down near the antenna, exploring (biting, sniffing) the antenna or other infrastructure around the nipples. In order to avoid that these false registrations would be interpreted as excessive drinking, visits >180 s were removed as well.
Drinking visits were also created using data of only one tag per pig (the right ear tag). In this case 40 different bout criteria were tested (from 1 to 40 s long) together with the minimum and maximum duration criterion (remove visits <3 or >180 s).
In both cases, from the tested bout criteria, the optimal bout criterion was defined as that for which the RFID-based drinking visits had the highest correspondence with the observed duration and number of drinking visits at both observation days.
Validation of RFID measurement performance based on visual observations
Analysis was performed using MATLAB R2010b (The MathWorks, Inc., Natick, MA, USA) and for one or two tags per pig. First, a paired t test was used to compare number, duration, average duration and average gap between drinking visits per pig between the visual observations and the RFID-based visit variables. Statistical significance was considered at probability P<0.05. Normality was checked using histograms and normal probability plots.
Second, the RFID system and visit criteria were validated by comparing RFID-based drinking visits with observed drinking visits. Exact synchronisation between the barn computer (for RFID and flow meter logging) and the portable computer used for observation loggings was not achieved, thus comparison was done on the basis of overlap per visit instead of exact agreement (per second). Measurement performance was expressed as (using observations as a reference and RFID-based visits as the test):
 $${\rm sensitivity}= {{{\rm TP}} \over {{\rm TP{\plus}FN}}}$$
 $${\rm specificity= }{{{\rm TN}} \over {{\rm FP{\plus}TN}}}$$
 $${\rm precision= }{{{\rm TP}} \over {{\rm TP{\plus}FP}}}$$
 $${\rm accuracy= }{{{\rm TP{\plus}TN}} \over {{\rm TP{\plus}FN{\plus}FP{\plus}TN}}}$$
TP (true positives) is the number of observed visits with an overlapping RFID visit; FN (false negatives) the number of observed visits without an overlapping RFID visit; TN (true negatives) the number of intervals between observed visits that do not contain an RFID visit without overlap with any observed visit; and FP (false positives) the number of intervals between observed visits that contain an RFID visit without overlap with any observed visit.
Last, a linear regression analysis of RFID-based variables with observed variables was performed in order to validate the RFID technology for measuring the pigs’ drinking behaviour. The coefficient of determination R 2 was calculated to quantify the correlation between the RFID-based variable (dependent) and the observed variable (explanatory). Normality was checked using a histogram and a normal probability plot. Statistical significance was checked with an F test of the overall fit and significance was considered at probability P<0.05.
Validation of RFID measurement performance based on flow meter measurements
Comparison of visits was repeated for RFID visits and observed visits v. flow meter visits. A paired t test was used to compare drinking variables (number, duration, average duration and average gap between drinking visits per pig) of the observations, RFID-based visits using one or two tags per pig, and flow meter measurements. Sensitivity, specificity, precision and accuracy of the overlap of visits were calculated. Linear regression analysis between RFID-based variables or observed variables v. flow meter variables was also performed. This entire analysis was also done for one or two tags per pig. In contrast to the previous sections, only data from test-day 1 were used. Where measures of flow were used (and not just the timing of the flow meter visits), the analysis was also limited to only three out of four nipples due to the abovementioned technical problems.
Results
Observed drinking behaviour and RFID registrations
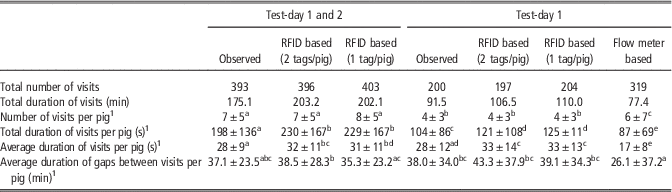
In total, 393 drinking visits were observed (2.9 h of drinking). One pig was not observed to be drinking and had no RFID registrations during the observation time. Another pig lost its left ear tag before the observations. These pigs’ data were removed from the analysis, leaving 53 pigs. Table 1 illustrates drinking duration and number of drinking visits per pig during the observation time, as well as the average duration of drinking visits and of gaps between drinking visits.
Drinking visits of pigs during the observation time (3 h/nipple per day, four nipples) based on observed, RFID-based (one or two tags per pig) and flow meter-based variables

RFID=radio frequency identification.
a,b,c,d,eValues within a row with different superscript differ significantly at P<0.05.
1 Values are mean±s.d.
In total, 16 558 RFID registrations of the focal pigs were recorded during the observation time, 312±274 registrations/pig (mean±s.d.). On average, 56.2%±11.5 percentage points (p.p.) (mean±s.d.) of the registrations of each pig were for the right ear tag. The percentage of RFID registrations that occurred during or within 10 s around an observed visit was 81.9%, and 99.7% of the observed visits had at least one RFID registration of the pig within 10 s around the observation. Using only the right ear tags, 77.7% of the registrations were during or within 10 s around a visit and 98.7% of the visits had a right tag registration of the correct pig during or in the 10 s before or after the visit.
Extracting the drinking behaviour from the RFID registrations
Visit criteria using two tags per pig
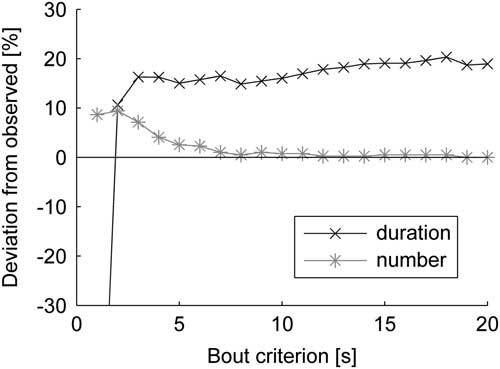
With increasing bout criterion, the number of RFID drinking visits decreased (drinking visits further away were joined together as one drinking visit) and the drinking duration increased slightly (more gaps between registrations were considered within the drinking visit). The number and duration of RFID-based visits have been plotted against the observed drinking visits (Figure 2). For bout criteria of 8, 9 and 10 s, the mean deviation for duration and number was <8.5%. Therefore, a bout criterion of 10 s was chosen.
Percentage deviation of the duration and number of RFID-based visits (using two tags per pig) v. observed visits for every bout criterion tested. RFID=radio frequency identification.

Of the RFID visits extracted with the bout criterion of 10 s, 66 visits with a total duration of 30.1 min had registrations of only one tag of the pig and were therefore removed. Only 12 of these visits (duration of 3.3 min in total) were observed as a drinking visit and should thus not have been removed. Four of the remaining visits were removed as they were shorter than 3 s in duration (in total 5 s). The assumption of a minimum duration criterion equal to 3 s was confirmed by the fact that all drinking visits scored during visual observations lasted longer than 3 s. Four visits (in total 31.6 min) that lasted longer than 180 s were removed as well. The assumption that a pig generally does not drink longer than 180 s was again confirmed by the observations, as the largest observed drinking visit was 118 s. By applying this criterion to filter out unrealistically long RFID visits, nine actual drinking visits representing a total drinking time of 4.4 min were deleted as well, because it was not possible to distinguish between the time the pig was drinking and the time it was close to the nipple without drinking in those cases.
After applying all visit criteria, 396 RFID-based visits and 3.4 h of RFID-based drinking remained. This was compared with the observed number and duration of drinking visits; the RFID system overestimated the number of visits by 0.7% and the duration of drinking by 16.0%. For individual pigs, the RFID system recorded 0±2 visits (mean±s.d.) more than the observer. The ratio of RFID visits over observed visits was 104.8%±40.6 p.p. (mean±s.d.). RFID-based drinking duration per pig was 32±61 s (mean±s.d.) longer than observed, giving a ratio of RFID-based drinking duration over observed duration of 117.0%±35.0 p.p. (mean±s.d).
Visit criteria using one tag per pig
The mean deviation for duration and number of RFID-based visits v. observed visits was <9% for bout criteria 19 and 20 s and for all bout criteria larger than 27 s. The bout criterion was set to 20 s. A total of 19 RFID-based visits <3 s were removed (total duration 19 s). Six RFID-based visits >180 s were removed (total duration 28.0 min). As with two tags per pig, with the latter removals also nine actual drinking visits were deleted (total 4.4 min).
Number of drinking visits and duration of drinking were overestimated by the RFID system using one tag per pig with 2.5% (403 RFID-based visits) and 15.5% (3.4 h of RFID-based drinking), respectively. For individual pigs and using only the right ear tag, the RFID system recorded 0±2 visits (mean±s.d.) more than the observer. The ratio of RFID visits over observed visits was 109.6%±50.2 p.p. (mean±s.d.). RFID-based drinking duration per pig was 31±65 s (mean±s.d.) longer than observed, giving a ratio of RFID-based drinking duration over observed duration of 118.4%±37.3 p.p. (mean±s.d).
Validation of RFID measurement performance based on visual observations
Comparison of visits using two tags per pig
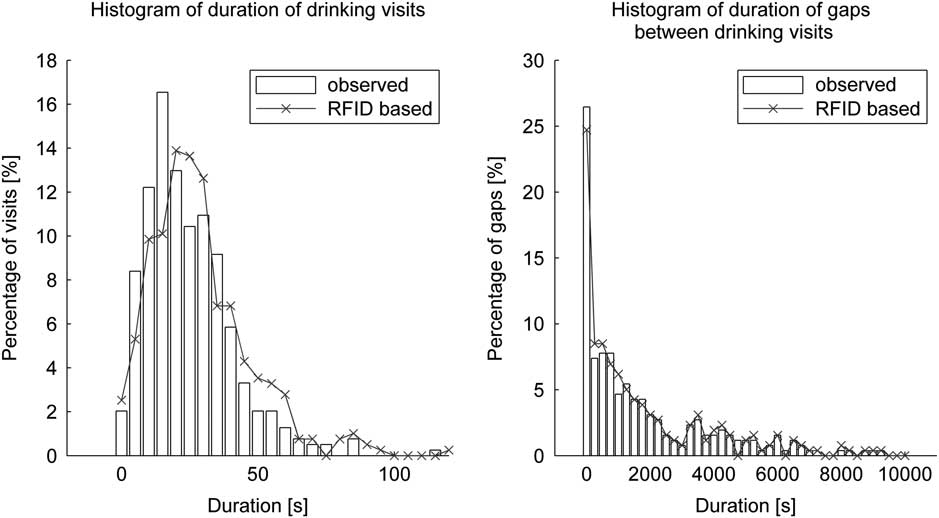
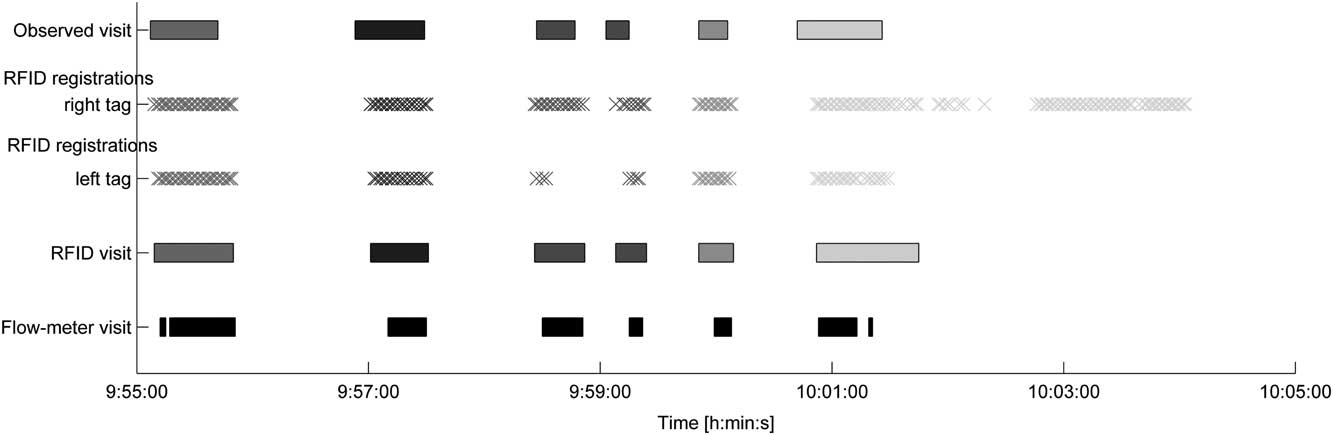
Variables of the drinking behaviour (number, duration, average duration and average gap between drinking visits per pig) as measured by the observer and by the RFID system using two tags per pig are shown (Table 1). Number of visits per pig and the average gap between drinking visits did not differ significantly between observations and RFID-based visits (P>0.05). The histograms of duration of observed and RFID-based visits were similar; the same holds for the duration of gaps (Figure 3). Figure 4 shows an example of the observations, registrations, constructed RFID visits and flow meter visits at one nipple during 10 min.
(a) Histogram of duration of drinking visits, (b) histogram of duration of gaps between drinking visits, observed and based on RFID visits using two tags per pig. RFID=radio frequency identification.

Observed drinking, RFID registrations, constructed RFID-based drinking visits (using two tags per pig) and flow meter visits at one nipple during 10 min. RFID=radio frequency identification.

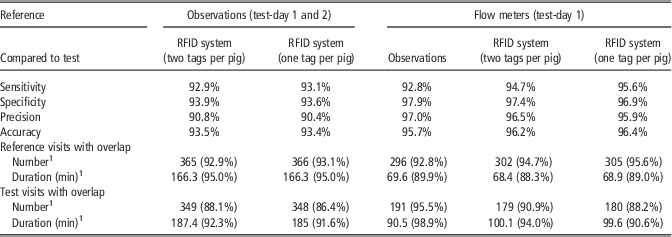
Comparison of the RFID-based visits with the visual observations was done based on overlap. Sensitivity, specificity, precision and accuracy are summarised in Table 2. A total of 28 observed visits (total duration 8.8 min) did not have an overlapping RFID visit. These observations without overlap were due to incorrect removal of RFID visits while applying the visits criteria (21 visits, 7.7 min), too few registrations or a wrong observation (no significant flow recorded). A total of 47 RFID visits (total duration 15.7 min) did not have an overlapping observation. False positives were due to registrations without drinking or missed observations (could only be determined at test-day 1 when there was flow recorded; this was the case for six visits). Five RFID visits nearly had overlap with an observation.
Comparison of visits based on overlap between observations, RFID system using one or two tags per pig and flow meter measurements

RFID=radio frequency identification.
1 Values are absolute value (percentage of total).
Comparison of visits using one tag per pig
Number of visits per pig, duration of visits and the average duration of drinking visits did not differ significantly when calculated using one or two tags per pig (Table 1). The results of the comparison between visual observations and RFID system using one tag per pig are summarised in Table 2. A total of 27 observed visits (total duration 8.8 min) did not have an overlapping RFID visit and 55 RFID visits (total duration 17.1 min) did not have an overlapping observation. The reasons are the same as described above for two tags per pig.
Linear regression analysis using two tags per pig
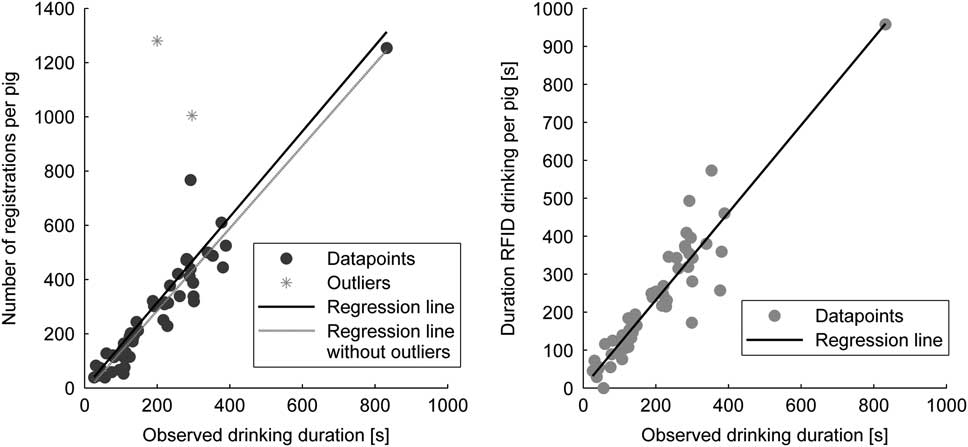
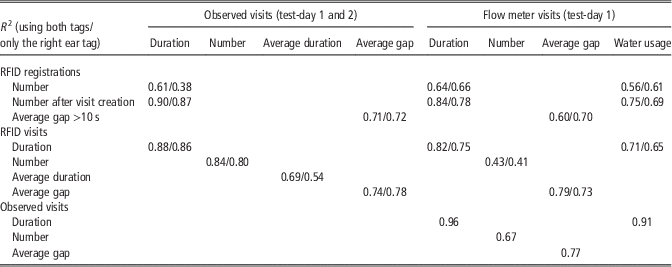
All regressions between observed and RFID-based variables were significant (Table 3); examples are shown in Figure 5. One pig had a high observed drinking duration (832 s) and number of registrations (1254) compared with the other pigs (Figure 5). Looking at the number of registrations during the entire observation days (data not shown), this pig did not have the highest number of registrations nor was it an outlier. This pig coincidentally drank more than the others during the observation time.
Linear regression of the observed drinking duration v. (a) the number of RFID registrations per pig using all pigs (y=−0.5+1.6x, R 2=0.61), or without two outliers (y=−18.2+1.5x, R 2=0.90); (b) the duration of RFID-based drinking per pig (using two tags per pig) (y=1.8+1.2x, R 2=0.88). RFID=radio frequency identification.

Coefficients of determination (R 2) of linear regressions between RFID-based variables, observed variables and flow meter variables using both tags/using only the right ear tag

RFID=radio frequency identification.
As can be seen from the coefficients of determination in Table 3 and Figure 5, RFID-based duration was a better predictor for observed duration of drinking (R 2=0.88) than the raw number of registrations (R 2=0.61). This was mainly due to the removal of too-long bouts of registrations that did not represent drinking. For the regression of number of registrations per pig v. observed drinking duration, two outliers were present (residual was outside the 95% confidence interval). One outlier was a pig for which two visits of 4.6 and 17.8 min were removed according to the maximum duration criterion. The other pig had the second largest removal of false registrations (one visit of 10.9 min during which only one tag was registered). When these outliers were removed, the coefficient of determination improved considerably (R 2=0.90; Figure 5).
Therefore, a new variable, that is the number of registrations per pig after applying the visit criteria, was calculated to obtain a better estimate of the duration of drinking compared to the RFID-based duration. The bout criterion had no effect on the number of registrations per pig and the minimum duration criterion removed only a few registrations. The maximum duration criterion and the removal of visits with registrations of only one tag of the pig did remove a number of false positive registrations. Regression of the number of registrations after application of the visit criteria with the observed drinking duration gave a coefficient of determination of 0.90. One reason for the improvement is that some gaps between registrations that were taken as part of an RFID visit were actual drinking pauses. Of the observed gaps between drinking visits of the same pig, 17 gaps were ⩽10 s in length, with a total duration of 95 s. In addition, some false positive RFID visits contained mainly (but not entirely) registrations of only one of the RFID tags of the pig. These false positive registrations would thus have a larger effect on the RFID visit duration than on the number of registrations after visit creation.
The coefficient of determination R 2 between RFID based and observed number of visits was 0.84, and the R 2 between average duration of RFID visits and observed visits was 0.69. For the average gap between observed visits, the average gap between RFID visits (R 2=0.74) was a slightly better predictor than the average gap between RFID registrations including only the gaps larger than 10 s (R 2=0.71). Removing the gaps between registrations ⩽10 s was necessary to avoid that the numerous very small gaps between registrations of the same pig would dominate the average gap length.
Linear regression analysis using one tag per pig
The coefficients of determination were generally smaller when using only the right ear tag than when using two tags per pig (except for the gap between visits), but the conclusions remain equal (Table 3).
Validation of RFID measurement performance based on flow meter measurements
For comparison of the RFID data with the flow meter data, only data of test-day 1 was used, giving 319 flow meter visits with a total duration of 77.4 min. To obtain the identity of the drinking pig and individual flow meter variables, flow meter visits had to be linked with RFID registrations of the drinking pigs. In three visits more than one pig was registered, but, based on the observations, the registered flow could be attributed to the pig with the largest number of registrations. In addition, three flow meter visits had no corresponding RFID registrations. For two of those three the correct pig could be identified based on the registrations in the range from 5 s before till 5 s after the flow meter visit. The remaining one could not be attributed to a specific pig as it occurred without corresponding registrations or observations. Therefore, it was not used in the analysis. By using only the right ear tags, four flow meter visits could not be matched with a pig.
The drinking variables measured by the observer, the RFID system using one or two tags per pig and the flow meters on test-day 1 have been summarised (Table 1). The same conclusions as for both observation days also apply here. However, the flow meter-based variables were different from the rest. The only exception was for the average gap between flow meter visits that did not differ significantly from the observed or RFID-based gap between visits using only one tag, on both observation days. The RFID system (using either one or two tags per pig) has a slightly higher sensitivity and accuracy, but lower specificity and precision for overlap with flow meter visits compared with the observed visits (Table 2).
Linear regression analyses between RFID-based variables or observed drinking variables and flow meter variables were also performed (Table 3). In the case of water usage, only data from test-day 1 for three nipples were used. All regressions were significant, except for the average duration of visits; this information was therefore excluded from Table 3. The observation variables corresponded better with the flow meter variables than the RFID variables. Looking at the RFID system, it seems that number of flow meter visits was hard to estimate (R 2=0.43), but for duration of flow meter visits the number of registrations after visit creation would be a good estimator (R 2=0.84). In addition, the average gap between flow meter visits could be estimated from the average gap between RFID visits (R 2=0.79). There was also a good correlation between number of registrations after visit creation and water usage per pig (R 2=0.75). Again, the coefficients of determination tended to be lower when using only the right ear tags to construct RFID visits, but the conclusions remain the same.
Discussion
The average duration of drinking visits observed in this study (28 s using observations, 17 s using flow meters; Table 1) was comparable with those reported from other studies. Andersen et al. (Reference Andersen, Dybkjær and Herskin2014) found an average visit length of 14 s measured with RFID for groups of 3 or 10 pigs. Turner et al. (Reference Turner, Sinclair and Edwards2000) observed a median bout length of 21 s and found a dependence on group size. Li et al. (Reference Li, Chenard, Lemay and Gonyou2005) found average durations of visits between 16 and 26 s under various ages, settings of nipples and flow rates. Differences between studies can be attributed to different group sizes (Turner et al., Reference Turner, Sinclair and Edwards2000), type of nipple (Li et al., Reference Li, Chenard, Lemay and Gonyou2005), flow rate (Andersen et al., Reference Andersen, Dybkjær and Herskin2014) and measurement method (Meiszberg et al., Reference Meiszberg, Johnson, Sadler, Carroll, Dailey and Krebs2009). Both the within- and between-pig variability in the drinking behaviour was large, as was the case with feeding behaviour under the same conditions (Maselyne et al., Reference Maselyne, Saeys, De Ketelaere, Mertens, Vangeyte, Hessel, Millet and Van Nuffel2014b).
The number of visits measured by the flow meters was clearly higher than measured by the observer or the RFID system, while the duration of drinking was considerably smaller (Table 1). Similar results were reported by Meiszberg et al. (Reference Meiszberg, Johnson, Sadler, Carroll, Dailey and Krebs2009) who compared observations with flow meter measurements. The main explanation for this is that both the observer and the RFID system measure presence at the nipple drinker rather than actual water usage. The latter is very likely to be shorter than the observed visit and can be split into more bouts. While the pig is present at the nipple or has the nipple in its mouth, it might take some water, pause to swallow (which will be seen in the flow meter data, but not by the observer or RFID system) and take another gulp after that. This explains the difference between the flow meter measurements and the observed and RFID-based measurements (Figure 4). However, the correlation between observed variables and flow meter-based variables was high (Table 3).
Several criteria have been tested for construction of drinking visits from the RFID data. The value of the bout criterion (maximum time gap between registrations of the same pig at the same nipple to be considered part of the same drinking visit) did not have a large effect on the results once it was over 6 s. The choice was thus rather arbitrary. When using two tags per pig, removing the visits with registrations of only one tag of the pig was very successful in reducing the number of false RFID visits (without a corresponding observation). When only one tag was registered, it was likely that the pig was with only one ear in range of the antenna, and thus not drinking, but instead playing near the nipple, lying down in front of the nipple or passing by the nipple. However, it is possible that actual drinking visits contain registrations of only one tag of the pig when the orientation of the ear is such that the tag is not in range of the antenna (Maselyne et al., Reference Maselyne, Van Nuffel, De Ketelaere, Vangeyte, Hessel, Sonck and Saeys2014a) or when an ear tag is lost. The minimum duration criterion mainly reduced the number of false RFID visits. This effect was largest when using one tag per pig. For two tags per pig, most of the small visits were already removed by deleting the visits with registrations of only one tag. The removal of visits longer than the maximum duration criterion had a large effect on the RFID-based duration. Drinking visits were mainly short. Very long bouts of registrations (>3 min) were unlikely to be drinking. However, when real drinking visits were masked by very long bouts of registrations, it was not possible to differentiate between real and false registrations. In general, the criteria were found to have a positive effect on the performance of the RFID-based visits.
The number of visits was not significantly different when measured by either the observer or by the RFID system. However, the RFID system overestimated the observed duration of drinking. Most of the false registrations (playing, standing, lying near the nipples) were removed during visit creation, in particular by the maximum duration criterion and, when using data of both tags of the pig, by removing visits where only one tag was registered. The remaining overestimation in duration could be due to remaining false registrations that were not removed by the above criteria or the RFID system detecting the pig while it is approaching or backing away from the nipple. The latter was also found by Andersen et al. (Reference Andersen, Dybkjær and Herskin2014).
The performance of the RFID system was evaluated by looking at sensitivity, specificity, precision and accuracy based on visit overlap. Since overlap was used (due to imperfect synchronisation) and not per-second agreement, the calculated measures were not very accurate nor sensitive to changes in the performance of the system. However, they give a good indication.
Registrations would be different whether one or two tags per pig would be available, since registrations are influenced by movement of the tag and tag orientation towards the antenna (Maselyne et al., Reference Maselyne, Van Nuffel, De Ketelaere, Vangeyte, Hessel, Sonck and Saeys2014a). No great difference in the performance of the RFID system was observed when using one or two tags per pig in terms of the absolute values of the drinking variables (Table 1) or in the measurement performance (Table 2). Nevertheless, some differences were observed in the correlations with observed and flow meter-based variables (Table 3). Often correlations were better when using two tags per pig, but the extra tag also implies an extra cost per pig. Whether this extra cost is justified will depend on the performance differences in further applications of the RFID system when using one or two tags per pig. However, as the difference was small, it is likely that one tag per pig will suffice.
The correlations in Table 3 reveal that the number of registrations after visit creation seems the variable best suited for estimation of the observed drinking behaviour, especially for the duration of drinking. However, duration of RFID visits, number of RFID visits and average gap between RFID visits are also variables that are highly correlated with their corresponding observation variable. Average duration of observed drinking visits per pig is harder to estimate. For estimation of flow meter-based drinking variables (Table 3), the same conclusions hold, except that the number of flow meter visits was also hard to estimate. The coefficients of determination with water usage might increase further if the nipples would all be set to exactly the same flow rate. Flow rate was adjustable, but not very accurately and was set at ~0.8 l/min. One nipple had a flow rate of 0.9 l/min. This is the maximum flow rate, but individual pigs could still choose to have a lower flow rate by biting down less hard on the nipple.
This linear regression analysis also gave an indication of which variables are the best estimates for the observation variables and could thus be well suited for monitoring purposes. RFID-based variables that are not very well correlated with real drinking variables might not reflect the real drinking behaviour well and have thus an a priori disadvantage for problem monitoring. The real suitability of a variable also depends on other factors, such as its normal variation and its sensitivity towards health, welfare and productivity problems. However, as a first indication, number of registrations after visit creation seems a promising variable to follow up in time due to its high correlation with observed and flow meter-based drinking duration and water usage.
In this study, a HF RFID system was tested as a measurement system for the drinking behaviour of pigs. Other types of RFID (LF, UHF, etc.) might also be a possibility, but still need to be properly validated as well. The RFID system can also be used together with flow meters to measure pigs’ drinking behaviour. In that case no estimation of the water usage would be necessary, as it can be measured directly with the flow meters. The duration of visits can then be measured either by the RFID system (Andersen et al., Reference Andersen, Dybkjær and Herskin2014) or by the flow meters (which will give a more precise result). Being able to measure the real water usage would be a great advantage, but would require two sensors instead of one, increasing the cost and complexity. Drinking behaviour could then be more clearly discriminated from playing behaviour, lying or standing near the nipple. The real water consumption of the pigs would still remain unclear, however, since pigs spill a lot of water (Andersen et al., Reference Andersen, Dybkjær and Herskin2014). Moreover, flow meters tend to require regular maintenance and are sensitive to problems with bad or variable water quality. The flow meters used in this study often had technical problems and were thus not suitable for use in a pig barn. Combining the RFID system with a more robust flow meter could be very valuable for research purposes. However, for on-farm problem detection, the possible increase in performance that flow meters could provide has to be weighed against the increasing cost and complexity.
In this manuscript, repeatability and reproducibility of the optimal criteria and of the performance of the RFID system were not investigated. In future work, the effect of age of the pigs, breed, production system, group size, drinking device, etc. on the optimal criteria and on the performance of the RFID system can be determined. With the recorded time series of individual pigs’ drinking behaviour it can then be investigated if health, welfare or productivity problems relate to detectable changes in the drinking behaviour.
Conclusion
A HF RFID system was designed to measure drinking behaviour of group-housed growing-finishing pigs. Visit criteria were necessary to create RFID-based drinking visits from the raw RFID registrations, based on either one or two tags per pig. These visit criteria were a bout criterion and a minimum and maximum duration criterion. In the case of two tags per pig, visits also need registrations of both tags to be withheld. Performance was sufficient and RFID-based drinking variables were highly correlated with observed and flow meter-based drinking variables. The number of RFID registrations after visit creation had an even higher correlation with observed or flow meter-based drinking duration than did the duration of RFID visits. These observations indicate that RFID-based monitoring of pig drinking behaviour is a valuable tool for research purposes and for development of a system for on-farm detection of production, health or welfare problems.
Acknowledgements
Jarissa Maselyne is funded by a PhD grant from the Agency for Innovation by Science of Technology (IWT Flanders – project SB 111447). Special thanks go to the technical staff of ILVO for the work and technical support provided, to Stephanie Van Weyenberg for statistical support and to Miriam Levenson for language corrections.