


Introduction
Accurate dietary assessment in early childhood is increasingly recognised as an essential component of contemporary nutrition research and policy, given the critical role of early-life dietary intake in shaping long-term health outcomes(Reference Nyaradi, Li, Hickling, Foster and Oddy1,Reference Emmett and Jones2) . Obtaining accurate estimates of children’s dietary intake has real world implications because these estimates are used to characterise diet–disease relationships in early life, develop age-specific dietary guidance, design and evaluate nutrition interventions, and describe diet-related inequities in the paediatric population(Reference Burrows, Martin and Collins3–Reference Gazan, Vieux, Mora, Havard and Dubuisson6). However, accurately capturing what children consume under free-living conditions is challenging. Methods such as biomarkers are objective, but also expensive; and while weighed food records (WFR) may incur less misreporting because portions are weighed instead of estimated, they are also associated with higher participant burden and may not capture habitual intake(Reference Williamson, Allen, Martin, Alfonso, Gerald and Hunt7). For self-report tools, common sources of misreporting, and hence measurement error, include social desirability bias, poor recall, or over- or underestimation of portion sizes(Reference Gibson, Charrondiere and Bell8). There are additional barriers to accurate reporting when parents are proxy reporters for their children(Reference Pérez-Rodrigo, Artiach Escauriaza, Artiach Escauriaza and Polanco Allúe9,Reference Burrows, Goldman and Rollo10) . For example, parents may make assumptions about the foods and beverages that children eat, or the amount they eat versus the amount offered, when parents are not present to observe the child’s intake (e.g., during school hours).
Several systematic reviews have evaluated the validity of self-report dietary assessment tools in adults and adolescents, showing variable levels of accuracy depending on the tool, population, and dietary component measured(Reference Tabacchi, Amodio, Di Pasquale, Bianco, Jemni and Mammina11–Reference Rankin, Hanekom, Wright and MacIntyre16). However, the validity of self-report tools designed for adults and adolescents cannot be extrapolated to younger children because of the novel sources of error that may be introduced when measuring young children’s intake via parent-proxy report(Reference Livingstone and Robson17). Most reviews of validation studies aggregate findings across multiple age bands (early childhood, adolescence, adulthood) or assessment types (self-report and parent-proxy report), making it difficult to understand the validity of dietary assessment tools specifically for young children when parents are proxy reporters(Reference Saravia, Miguel-Berges, Iglesia, Nascimento-Ferreira, Perdomo and Bove18,Reference Riordan, Ryan, Perry, Schulze, Andersen and Geelen19) .
Among children and adolescents, previous systematic reviews have primarily focused on validation studies of total daily energy intake against doubly labelled water (DLW), consistently demonstrating under-reporting, particularly among children with overweight or obesity(Reference Burrows, Martin and Collins3,Reference Burrows, Goldman and Rollo10,Reference Walker, Ardouin and Burrows20) . Yet the validity of dietary assessment tools for estimating young children’s intake of macronutrients and micronutrients is unclear(Reference Burrows, Martin and Collins3,Reference Pérez-Rodrigo, Artiach Escauriaza, Artiach Escauriaza and Polanco Allúe9,Reference Burrows, Goldman and Rollo10,Reference Lowe, Fekete and Decsi21–Reference Lovell, Bulloch, Wall and Grant23) . Unlike energy intake, which can be validated against an objective reference method such as DLW, other nutrients may lack a ‘gold standard’ reference method for validation(Reference Burrows, Martin and Collins3). Reviews of studies that validate nutritional components of the diet other than energy were mostly conducted more than two decades ago(Reference McPherson, Hoelscher, Alexander, Scanlon and Serdula24) or for specific countries(Reference Ayoubi, Yaghoubi, Pahlavani, Philippou, MalekAhmadi and Esmaily4,Reference Rezazadeh, Omidvar and Tucker25) . This gap is important because under-reporting may vary by nutrient type. There is value in understanding whether dietary assessments in young children provide accurate measures of nutrient intake because adequate intake of macronutrients and micronutrients is essential for optimal growth, development, and disease prevention(Reference Lozoff and Georgieff26). Moreover, intake of specific macronutrients and micronutrients may be more predictive of certain health outcomes than total energy intake alone(Reference van Gijssel, Braun, Kiefte-de Jong, Jaddoe, Franco and Voortman27,Reference Larrosa, Luque, Grote, Closa-Monasterolo, Ferré and Koletzko28) .
To our knowledge, no systematic review has evaluated the validity of parent-proxy report dietary assessment tools for estimating nutrient intake other than energy intake in children. To address this gap, we conducted a systematic review focused on validation studies among children aged one to ten years that used parent-proxy report tools to estimate intake of macronutrients (proteins, fats, and carbohydrates) and micronutrients (calcium, magnesium, potassium, phosphorus, zinc, iron, sodium, copper, iodine, fluoride; and vitamins A, B-complex, C, D, E, and K). We synthesise the existing evidence, describe current gaps in knowledge, and propose opportunities to advance the science of dietary assessment.
Methods
Information sources and search strategy
A comprehensive literature search was designed and performed by a medical librarian (co-author CP) in May 2022 and updated in January 2026 for the concepts of validation study, diet and nutrition, non-caloric nutrients, and surveys and questionnaires. Relevant publications were identified by searching the following databases with a combination of standardised index terms and keywords: Ovid MEDLINE ALL (1946 to 11 October 2024), Embase (via Elsevier, 1947 to present), Web of Science Core Collection (via Thomson Reuters, including Science Citation Index Expanded 1974 to present, and Social Sciences Citation Index 1974 to present), and Cochrane Library (via Wiley, including Cochrane Database of Systematic Reviews and Cochrane Central Register of Controlled Trials). The search was constructed for Ovid MEDLINE and translated to additional databases. Searches were limited to paediatrics and human studies via database-specific search strings when possible. Conference abstracts were removed from Embase. All results were exported to and deduplicated in EndNote 20. Covidence systematic review software (Veritas Health Innovation, www.covidence.org) was used for screening and full text review. Citation mining was completed for all articles included for data extraction from the initial search. A list of all database search strategies and search terms are included in the supplementary material (Appendix A).
Eligibility criteria
Eligibility criteria and methods of analysis were determined a priori and registered at Open Science Framework (osf.io/d56kz)(Reference van den Akker, Peters, Bakker, Carlsson, Coles and Corker29). Included studies were required to be a validation study of a dietary assessment method using parent-proxy report and to include a human study population aged one to ten years. For parent-proxy report, we excluded studies that were designed specifically to validate parent–child dual report. Any validation study in which the analytic sample partially overlapped with the target age range (e.g., children aged seven to 13 years) was included on a case-by-case basis (e.g., studies were included if the results could be disaggregated to fit cleanly into our target age range, or if the vast majority of participants fell into our target age range). Included dietary assessment methods were dietary recalls, food frequency questionnaires (FFQ), and estimated food diaries. The search strategy was not designed to capture validation studies of weighed food diaries, in part because these tools were conceptualised as a ‘gold standard’ reference method despite their limitations. Included studies validated the intake of a predetermined list of macronutrients and micronutrients. Studies that focused on children that may have a heightened awareness of dietary intake (e.g., coeliac disease, type 1 diabetes) were excluded, as were studies that focused on validating energy intake only. Only original research was included; therefore, systematic reviews, meta-analyses, editorials, dissertations/theses, and case reports were excluded. Conference abstracts were also excluded.
Study selection
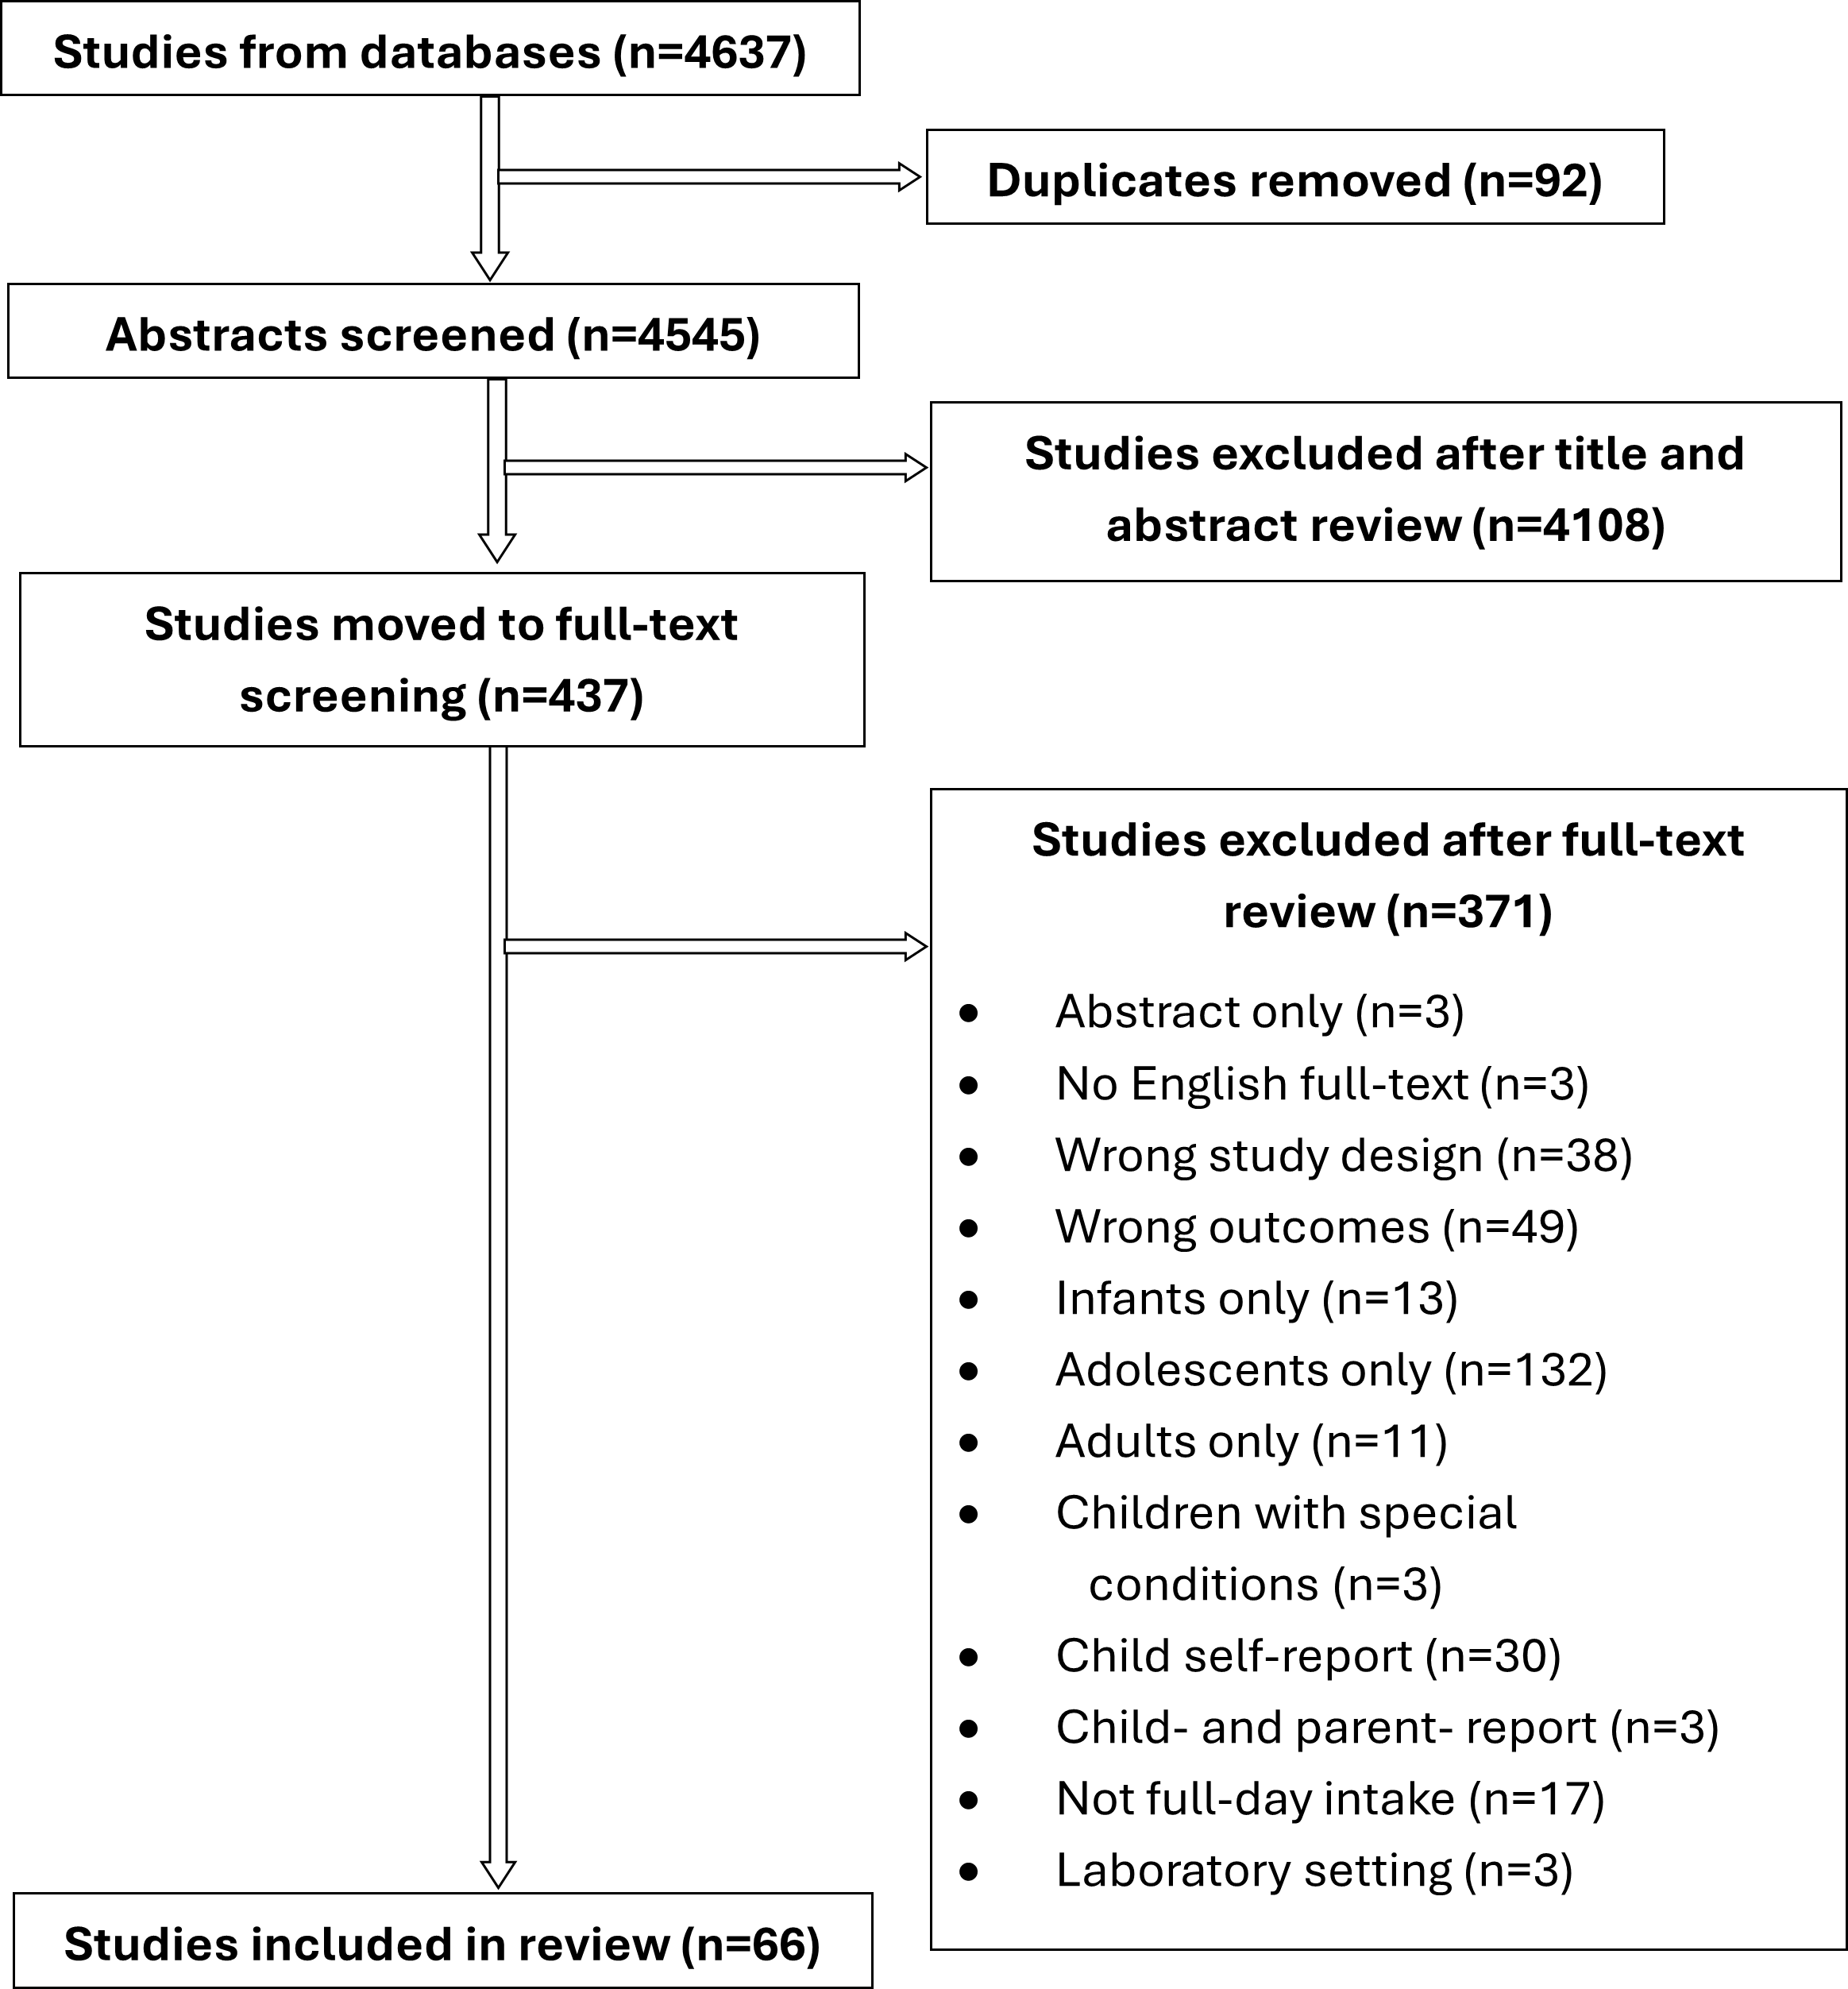
Citations and abstracts were uploaded to Covidence for study selection. Two authors independently screened each title and abstract (n = 4,545 abstracts) and voted ‘include’ or ‘exclude’ based on an eight-item abstract screening rubric (see supplementary material). When reviewers were unsure, the abstract was brought to the full group for discussion. In cases of disagreement, a third reviewer was consulted to make a final decision. Articles that passed the abstract screening and were considered for inclusion (n = 437 articles) underwent full text review, which was also conducted independently by two authors using a 16-item full text screening rubric (see supplementary material). In cases of disagreement, consensus on inclusion was reached through discussion at team meetings. The study selection process is summarised in Figure 1, following PRISMA guidelines.
Flow diagram depicting the identification, screening, and inclusion of studies in the systematic review of validation studies in which parents were proxy reporters for their children’s dietary intake.

Fig. 1. Long description
The flowchart begins with 4637 studies from databases. After removing 92 duplicates, 4545 abstracts are screened. 4108 studies are excluded after title and abstract review, leaving 437 studies for full-text screening. 371 studies are excluded for various reasons, such as being abstract only, lacking English full-text, wrong study design, wrong outcomes, focusing on specific age groups, special conditions, self-report, or laboratory settings. Finally, 66 studies are included in the review.
Data extraction
Data extraction was completed by seven authors in Covidence using a standardised rubric with detailed instructions (available after the embargo period in Open Science Framework) to ensure consistency across the authors. Each study was reviewed independently by one author, with a second reviewer available for consultation as needed. All data were entered into a predefined extraction template within Covidence, which was developed by one author and agreed upon by all members of the review team. The template included key variables identified a priori as essential for capturing study characteristics, dietary assessment methods, validation approaches, and outcomes. The rubric also provided explicit instructions for handling missing data, formatting, and definitions to ensure standardisation. Reviewers were instructed to write ‘Not available’ for any missing information.
Data synthesis and analysis
A structured qualitative synthesis was conducted using extracted data from 66 included studies. Given the heterogeneity in dietary assessment instruments and reference methods, a meta-analysis was not feasible. Instead, a descriptive and thematic synthesis was performed across five key domains: study characteristics, instrument characteristics, population demographics, validation results, and methodological quality. Summary tables were created for each domain, and analyses were guided by both qualitative and quantitative approaches. Descriptive statistics (e.g., counts, percentages, means, medians, and ranges) were calculated for years of publication, geographic locations, sample sizes, dietary instrument types, and validation methods. For instance, the percentage of studies using specific statistical tests (e.g., Pearson correlation, t-tests, Bland–Altman analysis) and the proportion reporting body mass index (BMI) or income were calculated. Frequencies of studies adjusting for common confounders were also summarised. In addition, narrative summaries were developed to highlight recurring patterns and gaps. These included the prevalence of specific dietary instruments (e.g., FFQs, dietary recalls), the types of populations studied (e.g., children with vs without obesity), and common methodological strengths or limitations. Studies were grouped by themes such as instrument administration mode, respondent type, and the reference method used. Observations such as the limited reporting of BMI or income, frequent omission of confounder adjustment, and variability in statistical validation approaches were documented.
Quality assessment
The Joanna Briggs Institute (JBI) Checklist for Analytical Cross-sectional Studies was used to assess article quality. Quality assessment was performed based on the seven JBI criteria. One author administered the checklist to each article. Based on adherence to the criteria, studies were categorised for inclusion (met all seven criteria), exclusion (met fewer than four criteria), or flagged for further review of article quality (met four to six criteria). No studies were excluded solely based on appraisal results.
Results
Description of included studies
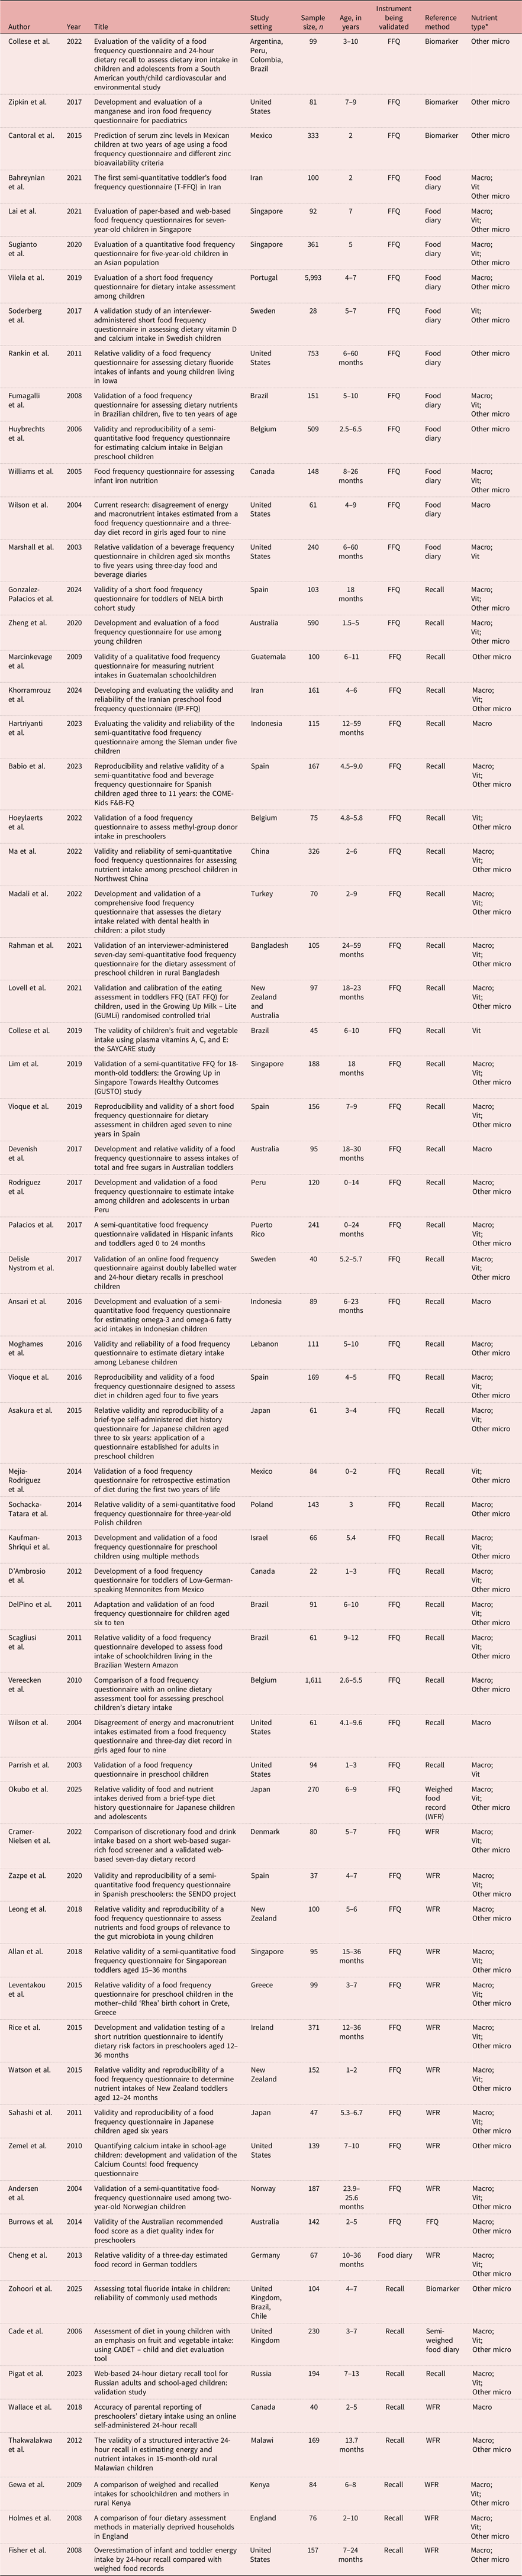
A total of 66 studies met the eligibility criteria and were included in the final review (Table 1)(Reference Andersen, Lande, Trygg and Hay30–Reference Allan, Abdul Kader, Ang, Muhardi and Nambiar95). Studies were published between 2003 and 2025 (median publication year of 2016) and data collection ranged from 1992 to 2024. Median sample size for the validation studies was 103 participants (range: 22–5,993). Most studies (n = 56) had validation as their primary objective, while ten studies included validation as a secondary aim. Studies were conducted across six continents in 33 countries, with the United States (n = 9), Brazil (n = 6), and Spain (n = 5) contributing the highest number.
List of 66 articles included in the systematic review by author, year, title, study setting, sample size, child age range, instrument being validated, and reference method

Table 1. Long description
The table presents a systematic review of 66 articles, organized by author, year, title, study setting, sample size, child age range, instrument being validated, and reference method. It includes studies published between 2003 and 2025, with data collection ranging from 1992 to 2024. The median sample size for the validation studies is 103 participants, with a range from 225,993. Most studies (56) had validation as their primary objective, while ten studies included validation as a secondary aim. The studies were conducted across six continents in 33 countries, with the United States, Brazil, and Spain contributing the highest number of studies. The table provides a comprehensive overview of the validation studies included in the review.
*Other micro = calcium, magnesium, potassium, phosphorus, zinc, iron, sodium, copper, iodine, or fluoride; Vit = Vitamins A, B, C, D, E, or K; Macro = protein, carbohydrate, fibre, total fat, saturated fat.
Mean child age across studies was 5.0 years (SD: 2.5 years). The mean percentage of female children was 51.4% (SD: 11%). Twenty-four percent of studies reported household income. Forty-two percent of studies reported child body size or BMI, of which only two studies reported BMI z-scores or used percentiles. This limited comparability across study populations, since raw BMI scores and related BMI category cut-offs are not an accepted indictor of obesity in young children.
The majority of studies in this review validated FFQs (n = 57; 86.3%), followed by dietary recalls (n = 8; 12.1%), and food diaries (n = 1; 1.5%). Instruments were either researcher-administered (50.0%) or self-administered (50.0%), with most studies conducting dietary assessments in person (73.1%). While the parent was the primary respondent for all validation studies, 21.5% of studies validated assessments in which the child could also participate as a respondent. Most instruments being validated included an assessment of portion size (80.0%). Target periods for intake varied substantially across the instruments being validated. Target periods for the FFQs were one year (15.2%), three months (10.6%), one month (22.7%), and one week (12.1%). The food diary was three days. The remaining articles were 24-hour dietary recalls (12.0%) or did not report a definitive target period (23%). Instruments being validated were written in a total of 17 different languages. English-language instruments accounted for 30% of the total. Fourteen studies did not specify the language of administration.
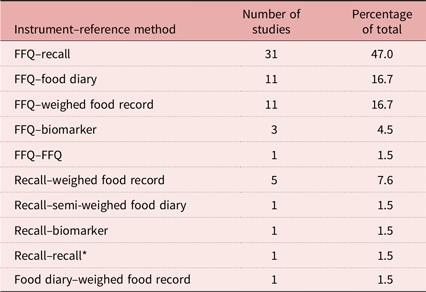
The reference methods that were used to validate dietary assessment tools are shown in Table 2. Over two-thirds of studies in this review used a parent-proxy report assessment tool as the reference method. The most commonly used reference method was a dietary recall (49.2% of studies), followed by weighed or semi-weighed food records (27.0%), food diaries (17.4%), biomarkers (4.8%), and FFQs (1.6%). The most common instrument–reference method pairing was an FFQ validated with a dietary recall (47.6% of included studies). Importantly, FFQs assess habitual intake over longer periods of time, whereas dietary recalls are usually based on one to three days of intake and, thus, may be less likely to capture foods that are consumed once per week or less. As a result, FFQs and dietary recalls may not be measuring the same dimensions of intake, especially for episodically consumed foods (e.g., nuts, seafood) that are an important source of some micronutrients.
Frequency and percentage of instrument–reference method pairings among 66 studies that validated a parent-proxy report dietary assessment tool among young children

Table 2. Long description
The table presents the frequency and percentage of various instrument-reference method pairings used in 66 studies to validate parent-proxy report dietary assessment tools among young children. It consists of 11 rows and 3 columns. The columns are labeled “Instrument-reference method”, “Number of studies”, and “Percentage of total”. The rows list different instrument-reference method pairings along with the corresponding number of studies and their percentage of the total. The most common pairing is FFQ-recall, used in 31 studies, accounting for 47 percent of the total. Other notable pairings include FFQ-food diary and FFQ-weighed food record, each used in 11 studies, making up 16.7 percent each. The table also includes less common pairings such as FFQ-biomarker, Recall-weighed food record, Recall-semi-weighed food diary, Recall-biomarker, Recall-recall, and Food diary-weighed food record, each with varying frequencies and percentages. The data highlights the prevalence of different validation methods in dietary assessment studies.
FFQ, food frequency questionnaire.
*This study compared a self-administered recall to an interviewer-administered recall.
The most commonly used statistical analyses for validation were Pearson and Spearman correlations (used in 84% of studies). Approximately half of studies used Pearson or Spearman correlations as the only statistical test. Other methods included linear regression, paired t-tests, Wilcoxon signed-rank tests, intraclass correlation, and weighted kappa. In a small number of studies, a paired t-test or a linear regression was the only analysis conducted. In these cases, we incorporated statistical significance (yes/no) into our synthesis, but not the strength of the correlation. Adjustment for potential confounding variables was inconsistent across studies. The most frequently included confounder was total daily energy intake.
Most studies scored high on the JBI checklist, with higher scores indicating better quality. Specifically, 75.8% of studies met all seven JBI criteria, and only three studies (4.5%) met fewer than six criteria. Nearly all studies met acceptable standards for reproducibility: 98.5% defined inclusion and exclusion criteria, 92.4% described the study population and setting in detail, and 97.0% provided thorough descriptions of dietary assessment methods and limitations. The most common funding sources were foundations or research councils (33%), government agencies (33%), private industry (14%), universities (14%), and international multi-governmental organisations (6%). A small number were unfunded or did not report a funding source. Four studies (6%) reported potential conflicts (e.g., industry affiliations or funding from private corporations).
Summary of findings from the validation studies
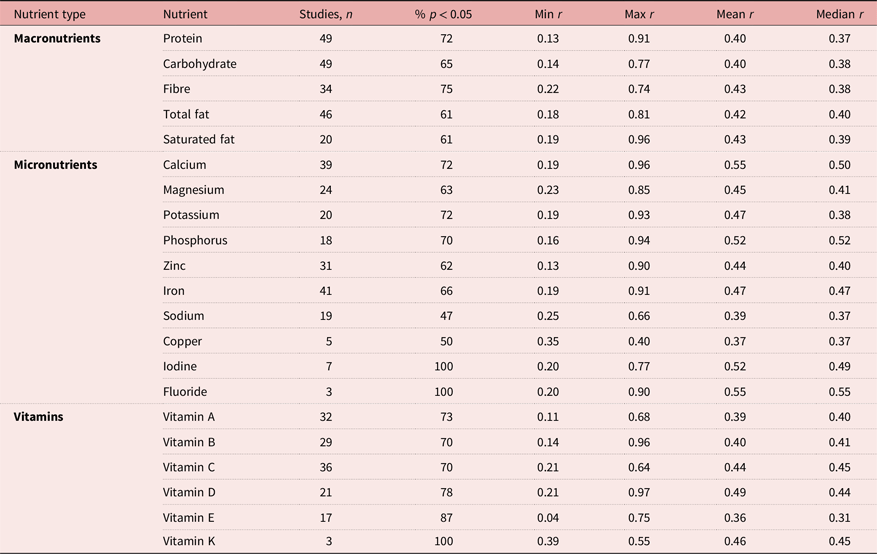
For macronutrients, studies validated intake of protein (n = 49 studies), carbohydrates (n = 49), fibre (n = 34), total fat (n = 46), and saturated fat (n = 20). Correlation coefficients are shown in Table 3. Depending on the macronutrient, 25% to 39% of validation studies failed to find a statistically significant correlation between the instrument being validated and the reference method. Among the macronutrient studies with a statistically significant correlation, mean and median correlations ranged from 0.37 to 0.44 (median correlations for protein [0.37], carbohydrate [0.38], fibre [0.38], total fat [0.40], saturated fat [0.39])(Reference Andersen, Lande, Trygg and Hay30–Reference Cade, Frear and Greenwood36,Reference Cheng, Hilbig, Drossard, Alexy and Kersting38,Reference Cramer-Nielsen, Bestle, Biltoft-Jensen, Matthiessen, Lassen and Christensen41–Reference Hartriyanti, Melindha, Wardani, Ermamilia and Lestari49,Reference Holmes, Dick and Nelson51,Reference Kaufman-Shriqui, Entin-Kreizman, Fraser, Novack, Bilenko and Vardi53–Reference Madali, Inan-Eroglu, Ozsin-Ozler, Karahan, Uzamis-Tekcicek and Buyuktuncer61,Reference Marshall, Eichenberger Gilmore, Broffitt, Levy and Stumbo63,Reference Moghames, Hammami, Hwalla, Yazbeck, Shoaib and Nasreddine65–Reference Rahman, Lee, Ireen, Khan and Ahmed69,Reference Rice, Gibbons, McNulty, Walton, Flynn and Gibney71–Reference Sochacka-Tatara and Pac75,Reference Sugianto, Chan, Wong, Shek, Tan and Chong77–Reference Zazpe, Santiago, de la, Romanos-Nanclares, Rico-Campa and Alvarez-Zallo87,Reference Zheng, Campbell, Scanlan and McNaughton89,Reference Vioque, Garcia-de-la-Hera, Gonzalez-Palacios, Torres-Collado, Notario-Barandiaran and Oncina-Canovas91,Reference Gonzalez-Palacios, Ojeda-Belokon, Oncina-Canovas, Compan-Gabucio, Pastor-Fajardo and Perez92,Reference Okubo, Crozier, Harvey, Godfrey, Inskip and Cooper94,Reference Allan, Abdul Kader, Ang, Muhardi and Nambiar95) .
Mean, median, and range (r) of statistically significant correlations between the dietary assessment tools being validated and the reference methods

Table 3. Long description
A table comparing correlation coefficients of dietary assessment tools for macronutrients and micronutrients. The table has six rows and eight columns. The columns are labeled Nutrient type, Nutrient, Studies n, percentage p less than 0.05, Min r, Max r, Mean r, and Median r. The table lists macronutrients, micronutrients, and vitamins with their respective studies, percentage of statistically significant correlations, and range of correlation coefficients. Macronutrients include protein, carbohydrate, fibre, total fat, and saturated fat. Micronutrients include calcium, magnesium, potassium, phosphorus, zinc, iron, sodium, copper, iodine, and fluoride. Vitamins include vitamin A, vitamin B, vitamin C, vitamin D, vitamin E, and vitamin K. Notable trends include high percentages of statistically significant correlations for iodine and vitamin K at one hundred percentage and lower percentages for sodium at forty-seven percentage and copper at fifty percentage. The mean and median correlation coefficients vary across nutrients, with calcium showing the highest mean correlation at zero point five five.
For micronutrients, studies validated intake of iron (n = 39), calcium (n = 37), zinc (n = 29), magnesium (n = 22), potassium (n = 18), phosphorous, and sodium (n = 17 each). Only a few studies validated iodine (n = 6), copper (n = 4), or fluoride (n = 2). Depending on the micronutrient, 0 to 53% of validation studies did not demonstrate a statistically significant correlation between the instrument being validated and the reference method. Among the micronutrient studies with a statistically significant correlation, mean and median correlations ranged from 0.36 to 0.55 (median correlations for calcium [0.50], magnesium [0.41], potassium [0.38], phosphorus [0.52], zinc [0.40], iron [0.47], sodium [0.37], copper [0.37], iodine [0.49], fluoride [0.55]) (see Table 3)(Reference Andersen, Lande, Trygg and Hay30,Reference Babio, de Las Heras-Delgado, De Miguel-Etayo, Pastor-Villaescusa, Leis and Garciduenas-Fimbres33–Reference Collese, De Moraes, Rendo-Urteaga, Gonzalez-Zapata, Charry and Delgado39,Reference Cramer-Nielsen, Bestle, Biltoft-Jensen, Matthiessen, Lassen and Christensen41–Reference Del Pino and Friedman44,Reference Fisher, Butte, Mendoza, Wilson, Hodges and Reidy46,Reference Fumagalli, Pontes Monteiro, Sartorelli, Vieira and de Lourdes Pires Bianchi47,Reference Hoeylaerts, Van Opstal, Huybrechts, Koppen, Devlieger and Godderis50–Reference Marcinkevage, Zea, Zuleta and Stein62,Reference Mejia-Rodriguez, Neufeld, Garcia-Guerra, Quezada-Sanchez and Orjuela64–Reference Palacios, Rivas-Tumanyan, Santiago-Rodriguez, Sinigaglia, Rios and Campos66,Reference Pigat, Soshina, Berezhnaya and Kryzhanovskaya68–Reference Vioque, Gimenez-Monzo, Navarrete-Munoz, Garcia-de-la-Hera, Gonzalez-Palacios and Rebagliato81,Reference Watson, Heath, Taylor, Mills, Barris and Skidmore83,Reference Williams and Innis84,Reference Zazpe, Santiago, de la, Romanos-Nanclares, Rico-Campa and Alvarez-Zallo87–Reference Vioque, Garcia-de-la-Hera, Gonzalez-Palacios, Torres-Collado, Notario-Barandiaran and Oncina-Canovas91,Reference Zohoori, Buzalaf, Maguire, Sanderson, Giacaman and Martignon93–Reference Allan, Abdul Kader, Ang, Muhardi and Nambiar95) .
For vitamins, studies validated intake of vitamin C (n = 36), A (n = 32), B (n = 29), D (n = 21), E (n = 17), and K (n = 3). Depending on the vitamin, 0 to 30% of validation studies failed to find a statistically significant correlation between the instrument being validated and the reference method. Among the vitamin studies with a statistically significant correlation, mean and median correlations ranged from 0.31 to 0.49 (median correlations for vitamins A [0.40], B [0.41], C [0.45], D [0.44], E [0.31], K [0.45]) (see Table 3)(Reference Andersen, Lande, Trygg and Hay30,Reference Asakura, Haga and Sasaki32–Reference Bahreynian, Feizi and Kelishadi34,Reference Cade, Frear and Greenwood36,Reference Cheng, Hilbig, Drossard, Alexy and Kersting38,Reference Collese, De Moraes, Rendo-Urteaga, Luzia, Rondo and Marchioni40–Reference Del Pino and Friedman44,Reference Fumagalli, Pontes Monteiro, Sartorelli, Vieira and de Lourdes Pires Bianchi47,Reference Gewa, Murphy and Neumann48,Reference Hoeylaerts, Van Opstal, Huybrechts, Koppen, Devlieger and Godderis50,Reference Holmes, Dick and Nelson51,Reference Kaufman-Shriqui, Entin-Kreizman, Fraser, Novack, Bilenko and Vardi53–Reference Lai, Loh, Toh, Sugianto, Colega and Tan55,Reference Leventakou, Georgiou, Chatzi and Sarri57–Reference Madali, Inan-Eroglu, Ozsin-Ozler, Karahan, Uzamis-Tekcicek and Buyuktuncer61,Reference Marshall, Eichenberger Gilmore, Broffitt, Levy and Stumbo63,Reference Mejia-Rodriguez, Neufeld, Garcia-Guerra, Quezada-Sanchez and Orjuela64,Reference Palacios, Rivas-Tumanyan, Santiago-Rodriguez, Sinigaglia, Rios and Campos66–Reference Rahman, Lee, Ireen, Khan and Ahmed69,Reference Rice, Gibbons, McNulty, Walton, Flynn and Gibney71,Reference Sahashi, Tsuji, Wada, Tamai, Nakamura and Nagata73,Reference Scagliusi, Garcia, Indiani and Cardoso74,Reference Soderberg, Lind, Karlsland Akeson, Sandstrom, Hernell and Ohlund76,Reference Sugianto, Chan, Wong, Shek, Tan and Chong77,Reference Vioque, Gimenez-Monzo, Navarrete-Munoz, Garcia-de-la-Hera, Gonzalez-Palacios and Rebagliato81,Reference Watson, Heath, Taylor, Mills, Barris and Skidmore83,Reference Williams and Innis84,Reference Zazpe, Santiago, de la, Romanos-Nanclares, Rico-Campa and Alvarez-Zallo87,Reference Zheng, Campbell, Scanlan and McNaughton89,Reference Vioque, Garcia-de-la-Hera, Gonzalez-Palacios, Torres-Collado, Notario-Barandiaran and Oncina-Canovas91,Reference Gonzalez-Palacios, Ojeda-Belokon, Oncina-Canovas, Compan-Gabucio, Pastor-Fajardo and Perez92,Reference Okubo, Crozier, Harvey, Godfrey, Inskip and Cooper94,Reference Allan, Abdul Kader, Ang, Muhardi and Nambiar95) .
Summary of limitations from included studies
The reviewed studies described several important methodological limitations. First, the ‘gold standard’ reference methods used for validation were predominantly parent-proxy report assessment tools, such as dietary recalls or food diaries, which are known to be prone to measurement error, or depended on non-comprehensive food databases to estimate intake. Only a small proportion of studies used more objective measures of dietary intake (e.g., weighed food records, biomarkers) as the reference; and these reference methods themselves had limitations (e.g., unreliable biomarkers for some nutrients or the use of unfasted blood samples). Additionally, some of the studies administered the dietary assessment and the reference method at different time points, such that differences in intake may have been due to changes in diet for other reasons (e.g., variation in household food availability over time). For example, the studies by Sugianto and colleagues and Lim and colleagues administered the instrument being validated and the reference method several weeks apart(Reference Lim, Toh, Tan, Chong, Yap and Godfrey58,Reference Sugianto, Chan, Wong, Shek, Tan and Chong77) . Second, there were often analytic discrepancies between the instruments being validated and the reference methods. In some cases, the instruments being validated did not have the same target assessment period, portion size query, or reference database as the reference method. As a result, instruments that aimed to estimate habitual intake may have been validated against instruments that estimated what was consumed on the preceding day, which may or may not have been representative of habitual intake. Third, 80% of studies used correlation coefficients (Pearson or Spearman) as their primary validation statistic. While this analytic approach is generally appropriate for a validation study, a minor limitation is that they were unable to adjust for potential confounding variables such as energy intake. This reliance on unadjusted bivariate methods limits the ability to account for individual- or population-level factors that may bias the relationship between reported and actual intake. Fourth, key demographic and health-related variables were reported infrequently: only 42% of studies reported child BMI, and just 24% reported household income. These are factors known to be associated with misreporting in dietary assessments among adult or adolescent self-reporters(Reference Bel-Serrat, Julian-Almarcegui, Gonzalez-Gross, Mouratidou, Bornhorst and Grammatikaki96,Reference Johnson97) . Among the studies that did report socioeconomic status (SES), many noted oversampling of children from higher-income, highly educated, urban, and ethnically homogenous families, reducing the generalisability of their findings. Authors of the included studies also noted that additional selection bias may have been introduced through convenience and non-probability sampling, low response rates, and loss to follow-up. Finally, the vast majority of studies validated FFQs, so the findings reported here may be less generalisable to other types of commonly used parent-proxy report dietary assessments, such as dietary recalls.
Discussion
Here we summarise the findings from 66 studies published between 2003 and 2025 that aimed to validate dietary assessment tools when parents were proxy reporters for their young children. Our study has three key findings. First, for most nutrients, over a quarter of the studies failed to find a significant correlation between the assessment tool and reference method. Second, among the 69% of analyses that did show a significant correlation, the median correlation for each nutrient ranged from 0.31 to 0.55. Third, our synthesis highlighted significant methodological limitations among the validation studies, primarily the use of suboptimal reference methods to validate intake. Taken together, these findings raise questions about the accuracy of parent-proxy report dietary assessment for estimating children’s intake of a wide range of macronutrients and micronutrients.
This systematic review is innovative because it synthesised the study designs and results of previous validation studies when parents were proxy reporters for their young children. The novel focus on proxy reporting is important because parent-proxy may be associated with different sources and amounts of measurement error. For example, most children in early and middle childhood consume multiple meals or snacks at school or while under the supervision of non-parental caregivers. Despite the fact that parents do not directly observe what children eat at school or in childcare, the accepted practice for assessing children’s intake during school or childcare hours is to rely on parent reports. This requires parents to make assumptions about unobserved intake that may introduce a type of misreporting that would not occur with a self-report dietary assessment(Reference Burrows, Goldman and Rollo10,Reference Walker, Ardouin and Burrows20,Reference Mehranfar, Jalilpiran, Jafari, Jayedi, Shab-Bidar and Speakman98) . This review is also distinct from previous reviews of validation studies which focused on adults or adolescents only(Reference Tabacchi, Filippi, Amodio, Jemni, Bianco and Firenze12,Reference Davies, Shi, Bauman and Allman-Farinelli13) , energy intake as the outcome(Reference Burrows, Goldman and Rollo10,Reference Walker, Ardouin and Burrows20,Reference Mehranfar, Jalilpiran, Jafari, Jayedi, Shab-Bidar and Speakman98) , children with overweight or obesity only(Reference Walker, Ardouin and Burrows20), or validation studies in a single country(Reference Ayoubi, Yaghoubi, Pahlavani, Philippou, MalekAhmadi and Esmaily4,Reference Pedraza and Menezes99) .
In this review, some nutrients, such as iodine, fluoride, and vitamin K, demonstrated stronger correlations between the instrument being validated and the reference method compared to other nutrients, although they were evaluated in relatively few studies. Yet for most nutrients, correlations were in the low to moderate range and some studies found no correlation at all. One possible explanation for this is that some of the assessment tools included in this review are not an accurate estimate of true macronutrient and micronutrient intake, or did not conduct the minimum number of assessments to accurately capture usual intake. A seminal paper by Basiotis et al. (1987) indicated that estimating usual nutrient intake at the group level requires from four to 44 days, depending on the nutrient, with additional assessment days required when estimates of usual nutrient intake are needed at the individual level(Reference Basiotis, Welsh, Cronin, Kelsay and Mertz100). This interpretation is somewhat consistent with previous literature reviews that included adolescent self-report, evaluated energy intake only, or were restricted to studies among children with overweight and obesity(Reference Saravia, Miguel-Berges, Iglesia, Nascimento-Ferreira, Perdomo and Bove18,Reference Walker, Ardouin and Burrows20) . There are plausible explanations for misreporting in parent-proxy report dietary assessment: social desirability bias, poor recall, difficulties in accurately estimating portion sizes, or ‘guesstimating’ unobserved intake, all of which could result in over- or under-reporting for any given nutrient(Reference Kirkpatrick, Guenther, Durward, Douglass, Zimmerman and Kahle101–Reference Bornhorst, Huybrechts, Ahrens, Eiben, Michels and Pala103). However, given the methodological limitations of the validation studies included in this review, it is difficult to draw general conclusions about the lack of strong correlations, or lack of any correlation in some cases. If the reference method itself is an inaccurate measure of true intake, then the lack of alignment between the two methods could also reflect inaccurate estimates by both assessment tools, or even accurate estimates among the instrument being validated. Either way, our synthesis did not find compelling evidence that parent-proxy report assessments are a valid measure of child nutrient intake.
While we did not compare the relative validity for different nutrients, there may be variability by nutrient in how well the dietary assessments correlate with the reference method. In our review, protein, fibre, calcium, and vitamins D and E all had a high proportion of studies with a significant association between the instrument being validated and the reference method. This may be due to variability in parents’ ability to accurately report intake by nutrient. For example, protein and especially animal source foods tend to be more expensive than other macronutrients(Reference Bekelman, Santamaria-Ulloa, Dufour, Dufour, Marin-Arias and Dengo104), so parents may be paying closer attention to how much of these foods their children eat. One common source of calcium and vitamin D for children is milk intake, which might be reported with superior accuracy because it tends to be served in cups with known volumes and as part of a daily routine in children (e.g., milk with dinner)(Reference Wiley105). The main sources of vitamin E in children’s diets are probably nuts, seeds, and green leafy vegetables. These items may be more ‘memorable’ for parents, since they tend to be consumed infrequently in children’s diets(Reference Nielsen, Herrick, Akinbami and Ogden106,Reference Wambogo, Ansai, Ahulwalia and Ogden107) . Clinical- and school-based interventions to educate families about the importance of fruits and vegetables are pervasive(Reference Haack and Byker108). This may explain the high proportion of statistically significant correlations in our review for fibre intake if parents are more closely tracking intake of produce, which is high in fibre. Alternatively, some foods high in fibre (e.g., leafy green vegetables) may be frequently declined by children who are selective/picky eaters; thus, parents may be tracking some foods more closely than others depending on children’s characteristics (e.g., eating behaviours). Future studies should examine whether parent-proxy report instruments may be more accurate for assessing intake of certain nutrients compared to others in young children. Specific areas for investigation include foods and beverages that are more frequently consumed or less frequently consumed, possibly making them easier to recall.
We identified many limitations in the study designs of published validation studies, all of which can be surmounted in future validation studies. First, future studies can strengthen our understanding of the validity of dietary assessments through inclusion of more objective and rigorous reference methods for estimating macronutrient and micronutrient intake. Validation studies of energy intake frequently use a true ‘gold standard’, doubly labelled water(Reference Mehranfar, Jalilpiran, Jafari, Jayedi, Shab-Bidar and Speakman98,Reference Nicklas, Saab, Islam, Wong, Butte and Schulin109) . Yet the same rigour has not been applied to reference methods for validating intake of nutrients. Studies that include a ‘gold standard’ for true intake will produce more meaningful results than comparing the performance of one parent-proxy report dietary assessment to another. Given the high participant burden associated with weighed food records(Reference Whybrow, Horgan and Macdiarmid110), novel technology-based measures that capture intake in real time with objective estimates of portion size may be a promising option(Reference Martin, Correa, Han, Allen, Rood and Champagne111). Second, the vast majority of validation studies captured in our literature search validated FFQs, but parent-proxy report dietary recalls are also a widely used assessment tool(Reference Foster and Bradley112). Additional validation studies are needed for parent-proxy report dietary recalls to determine whether they produce valid estimates of macronutrient and micronutrient intake. Third, analytic limitations were identified, often due to the use of correlation coefficients. This included lack of adjustment for relevant covariates and not adequately distinguishing between fixed and proportional bias when using Bland–Altman plots. Further, correlations can indicate lack of alignment, but do not provide insight into under- versus over-reporting. Fourth, novel study designs can enhance our understanding of the validity of dietary assessments. One example is qualitative or mixed-methods studies with parents of children who are too young to self-report. These designs could provide insight into sources of measurement error on the reporter side, such as under-reporting of less socially desirable foods, poor recall, difficulty estimating portions sizes, ‘guesstimating’ unobserved intake; or, on the researcher side, such challenges as calculating food and nutrient intake using existing food and nutrient databases(Reference Bekelman, Johnson, Steinberg, Martin, Sauder and Luckett-Cole102,Reference McCloskey, Johnson, Bekelman, Martin and Bellows113,Reference Svensson, Magnusson and Larsson114) . Fifth, future studies should provide a fuller demographic picture of the study population. This will facilitate identification of any heterogeneity in validity by sociodemographic group, especially sex, SES, and BMI, all of which have been previously linked to misreporting(Reference Foster and Bradley112,Reference McKenzie, Coyle, Burrows, Rosewarne, Peters and Carcel115) . Finally, our review suggests that the volume of evidence for validity, and the validity of the instrument itself, may vary by nutrient. This should be accounted for when interpreting the findings in any dietary assessment study where parents are proxy reporters for their children.
This systematic review had several strengths. The review synthesised findings from 66 studies published over 20 years that specifically validated parent-proxy report diet assessment tools among young children. Moreover, we reviewed a broad range (albeit non-exhaustive) of macronutrients and micronutrients, which builds on existing reviews that focused on validation of energy intake only. The geographic diversity of the validation studies showed the performance of the assessment tools in multiple settings. However, it is challenging to compare results across studies due to linguistic differences in the instruments and cultural diversity in the types of foods and beverages consumed in different countries. It is possible that our search may not have captured all the published validation studies that met our inclusion criteria. We mitigated this potential limitation using several strategies. Search terms were identified using multiple approaches. Relevant controlled vocabulary (e.g., MeSH, Emtree) and associated synonyms were first selected. Additional terms were identified from key, gold-standard citations, and the search strategy was tested to ensure the retrieval of these benchmark articles. Finally, content experts reviewed all terms for relevance and any missing vocabulary. Another limitation was that the number of studies validating dietary recalls was too small to draw any conclusions about the relative performance of dietary recalls versus FFQs. Future validation studies should employ study designs (e.g., dietary recall vs FFQ vs a true ‘gold standard’) that provide insight into which parent-report assessment tools most accurately estimate nutrient intake in youth.
The rising prevalence of diet-related non-communicable diseases such as type 2 diabetes and hypertension being diagnosed in children at younger ages underscores the urgency of improving dietary assessment tools in young children(Reference Kim and Lim116,Reference Koletzko, Brands, Poston, Godfrey, Demmelmair and Project117) . This review of 66 validation studies of parent-proxy report dietary assessment tools for young children found low-to-moderate correlations between dietary assessment tools and the reference method in most studies, and no correlation in over a quarter of studies. The included studies had significant methodological limitations and only a small proportion aimed to validate dietary recalls. Additional work is needed to determine if parent-proxy report dietary assessments provide accurate estimates of children’s macronutrient and micronutrient intake. This could include validation studies that incorporate more rigorous reference methods. The development of novel assessment tools may also be warranted.
Supplementary material
The supplementary material for this article can be found at https://doi.org/10.1017/S0954422426100456
Financial support
This research received no specific grant from any funding agency, commercial or not-for-profit sectors.
Competing interests
The author(s) declare none.
Authorship
Conceptualisation of project: CP, TB, BA, GB, CPC, JC, AS, CZ; search strategy: CP, TB; title and abstract screening: TB, RGDB, FC, BA, GB, CPC, JC, AS; full text screening: TB, RGDB, FC, CPC, CZ, AS, CH; data extraction: TB, RGDB, FC, CPC, CZ, AS, CH; interpretation of findings: TB, RGDB, FC, CPC, CZ, AS, CH, KM, CCC; draft manuscript: TB, RGDB, FC, CP. All authors critically reviewed the manuscript and approved the final version.