Introduction
To understand the origin of diamond crystals, it is necessary to study their internal structure and compare this with the thermal history reconstruction (Wiggers de Vries, Reference Wiggers de Vries, Bulanova, De Corte, Pearson, Craven and Davies2013, Speich et al., Reference Speich, Kohn, Bulanova and Smith2018). In such research, cathodoluminescence (CL) allows one to visualise fine zoning, growth layers and sectors in a crystal. The zonal and growth sector boundaries are visible in CL due to different distributions of impurities and internal defects (Lang, Reference Lang1993; Götze and Kempe, Reference Götze, Kempe and Gucsik2009). Fourier-transform infrared (FTIR) spectroscopy is among the principal methods used to identify and quantify structural defects of diamonds (Kohn et al., Reference Kohn, Speich, Smith and Bulanova2016). The concentration of substitutional nitrogen in the form of defects А and В is determined by absorption bands in the 600–1500 cm–1 range (Zaitsev, Reference Zaitsev2001). Comparison of the measured nitrogen concentration in the form of defects А and В with calculated isotherms enables one to estimate the model temperature (Kohn et al., Reference Kohn, Speich, Smith and Bulanova2016) or duration of natural annealing, i.e. to reconstruct partly the thermal history of the crystals (Taylor, Reference Taylor, Jaques and Ridd1990).
Only internal structure analysis by a combination of CL and FTIR enables one to visualise and reconstruct temperature changes during crystal growth (Wiggers de Vries et al., Reference Wiggers de Vries, Bulanova, De Corte, Pearson, Craven and Davies2013). This is the only way to reveal a particular section of the evolution of a diamond generating system. The objective of this investigation is to reveal features of a very interesting diamond by FTIR micro-spectroscopy, CL and photoluminescence (PL), and electron back-scattered diffraction (EBSD) in order to establish the nature of the inhomogeneities of this crystal.
The sample and experimental methods
We have found a very interesting crystal during an investigation (Vasilev et al., Reference Vasilev, Petrovsky, Kozlov and Antonov2018b) of a diamond collection from the Devonian Ichetju placer, located in the Middle Timan Mountains of the northern Urals, Russia (Dudar, Reference Dudar1996). This 0.28 ct crystal is interesting due to its morphology and high concentration of impurities. The crystal is greyish, rounded, saturated with inclusions and with re-entrant corners on the surface. Such corners are a sign of resorbed twins or intergrowths. A 0.6 mm plate was cut by laser from the crystal, polished and then used for CL, PL, EBSD, FTIR micro-spectroscopy and optical microscopy analysis.
Fourier-transform infrared, near infrared, and visible range absorbance spectra were recorded using a Vertex 70 spectrometer with a Hyperion 1000 microscope, in the range from 600 to 7000 cm–1 at 2 cm–1 resolution and in the range from 10,000 to 25,000 nm at 8 cm–1 resolution. Absorbance spectra in the 350–600 nm range were recorded with a Horiba FL3 spectrometer and an Olympus BL51 microscope at 0.5 nm resolution. FTIR spectra were recorded for traverses with a 100 μm step; the recording area of an individual spectrum was 70 μm × 70 μm. Optical density spectra were normalised according to the plate thickness after the subtraction of a linear baseline. The nitrogen concentration in the form of А (NA) and В (NB) defects and the total concentration, Ntot, were calculated from known calibrations (Boyd et al., Reference Boyd, Kiflawi and Woods1994, Reference Boyd, Kiflawi and Woods1995) after the spectra decomposition of A, B and D absorption bands. We also determined B’ band absorbance and its maximum position, which depends on the concentration and size of the platelets (Sumida and Lang, Reference Sumida and Lang1988; Clackson et al., Reference Clackson, Moore, Walmsley and Woods1990; Speich et al., Reference Speich, Kohn, Wirth, Bulanova and Smith2017). Absorbance of the band at 3107 cm–1 (α3107) of defect N3VH was also determined at each point. All FTIR data are available in the Table S1 (Supplementary material, see below). PL spectra of the plate were recorded at 77 K under excitation with 488 nm and 785 nm lasers, in a Renishaw In Via spectrometer in the 490–1050 nm range. A PL image of the plate was acquired via a Leica M205 microscope under 405 nm laser excitation with a 450 nm longpass edge filter and under 488 nm excitation with a 500 nm longpass edge filter at room temperature. CL images of the plate were obtained in a CamScan MX2500S scanning electron microscope with a CLI/QUA 2 detector at 12 KeV accelerating voltage. A colour CL image with low resolution and CL spectra at 77 K were obtained with a Camebax microprobe analyser with a custom-made spectrometer (Zamorianskaia et al., Reference Zamoryanskaya, Konnikov and Zamoryanskii2004) at 15 kV accelerating voltage and 20 μm beam diameter. For colour CL imaging, the plate was coated with carbon using a routine technique. After image acquisition, it was cleaned, recoated with gold and re-examined from both sides in a CamScan MX2500S. False colour EBSD maps with a 5 μm step were acquired with an EBSD Symmetry (Oxford Instruments) detector at an SEM MIRA III (Teskan). The electron beam current during the map acquisition was 5 nA at 20 kV accelerating voltage. Before EBSD mapping, the plate was polished by a 6 kV Ar+ beam in a SEMPrep2 (Technoorg Linda).
Results
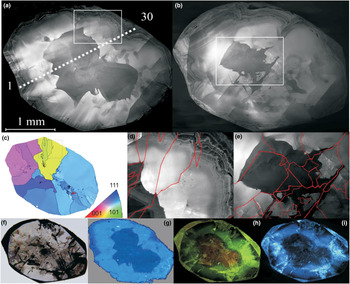
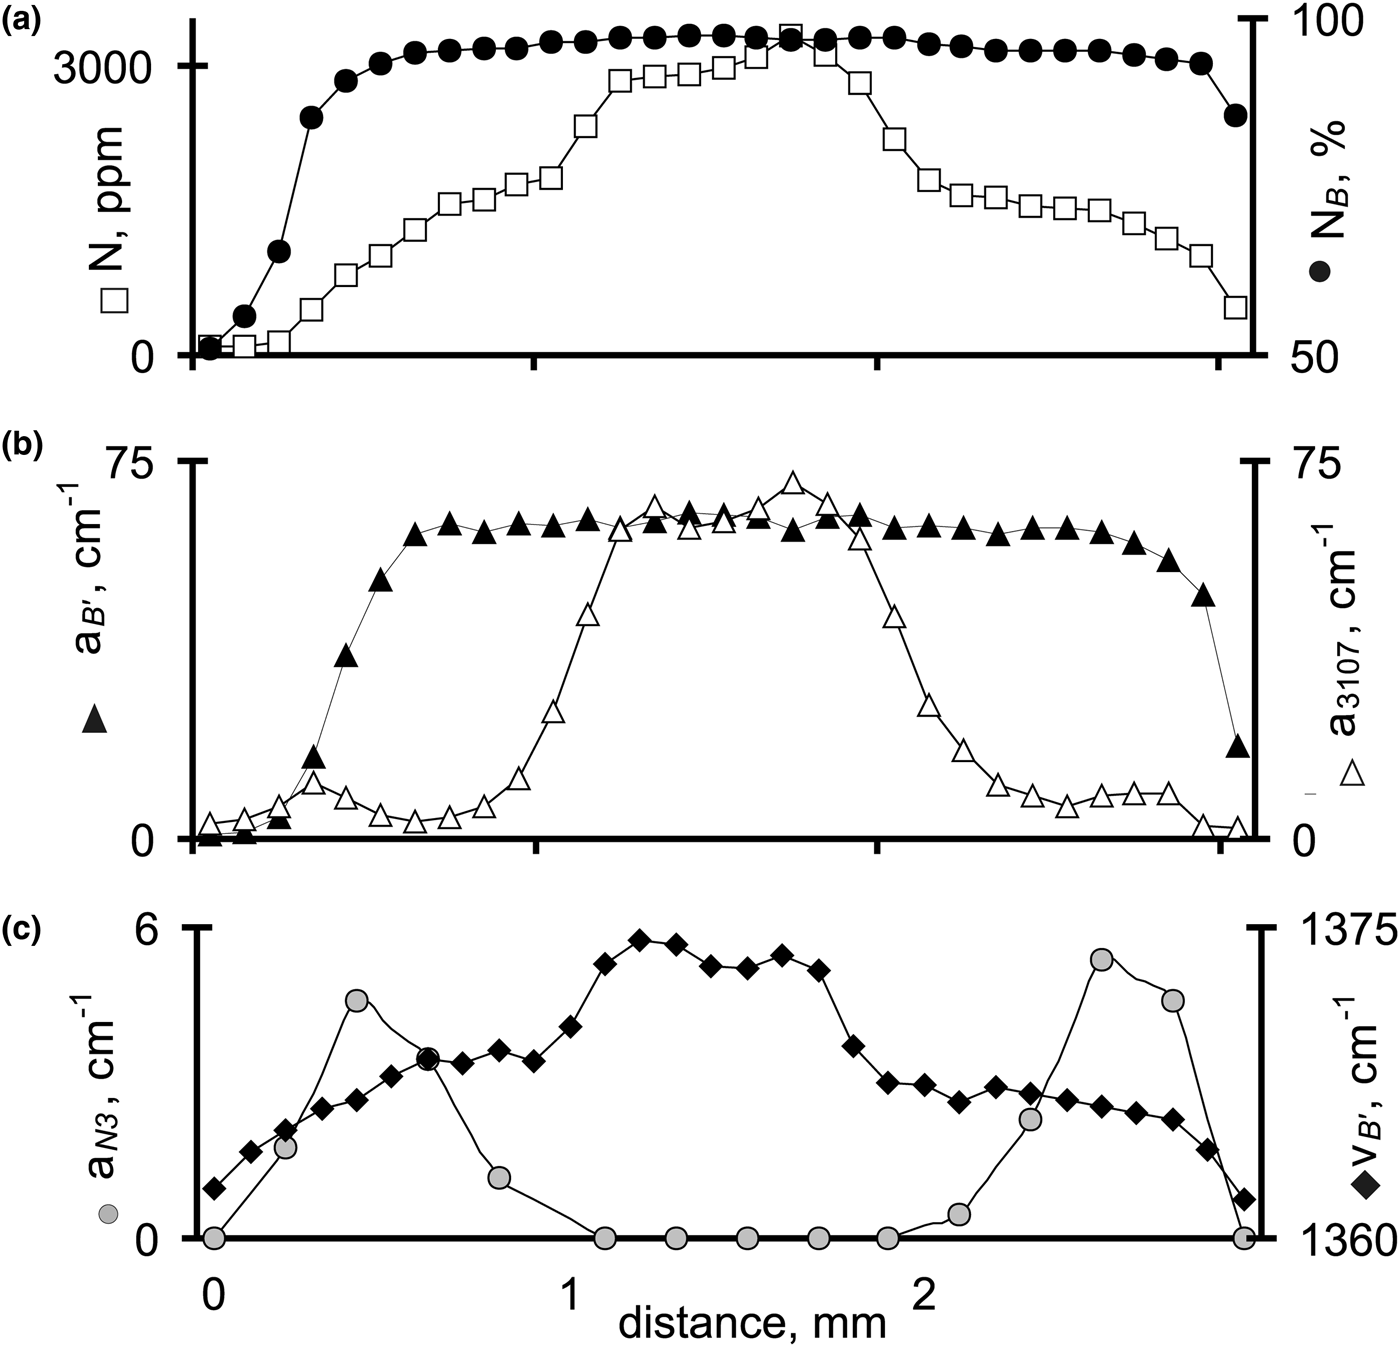
An irregular internal structure with overlapping areas of a different nature is seen in the CL images of the plate (Fig. 1a,b). The crystal consists of several large misorientated subgrains, as shown on the EBSD map (Fig. 1c). More EBSD data are provided in Supplementary material Figs S1, S2 and S3. Interfaces of the subgrains are responsible for the re-entrant corners of the crystal surface, as shown on CL images with the gain boundaries revealed by EBSD (Fig. 1d,e). A dark bluish luminescent core is located in the centre of the plate. The dark core is surrounded by a bright-blue intermediate zone; peripheral parts of the plate have less intense luminescence both in CL and PL (Fig. 1g–i). Near-surface layers have green CL of irradiation origin. Borders of the core cross the parallel growth layers of individual subgrains, as one can see in CL images (Fig. 1e,g,h). The core has a low CL contrast in comparison to the bright outer area. The shape of the core boundaries is traceable in the peripheral parts of the plate. ‘Estuary-like’ sectors, dark in CL, extend from the core to re-entrant angles in the peripheral zone and mark subgrain interfaces (Fig. 1c,d). The dark core is visible on both plate sides, but its shape and size are quite different. Dark 60–80 nm thick wavy lines are shown in CL images of both plate sides, and this is another type of heterogeneity. These lines trace cracks, and in a few cases, they look similar to channels with dark spots on the axis and a darkening area with a radius of 30–40 μm. These wavy lines look similar to elongated pigmentation spots, but they do not demonstrate any radiation-induced PL. A square nucleus of 0.3 mm size, saturated with inclusions, is clearly seen in transmitted light and in PL (Fig. S4). The nucleus is not seen in CL images because it is entirely under the surface. FTIR spectra in the nucleus area show some features we describe in the discussion. The nitrogen concentration exceeds 3100 ppm in the centre of the sample and decreases to 70 ppm near the surface (Fig. 2a). The nitrogen share in the B form is 98% in the centre; it decreases to 70% to the surface. In the centre, α3107 reaches 75 cm–1 (Fig. 2b), which is on the order of the highest value ever observed (Howell et al. Reference Howell, Griffin, Piazolo, Say, Stern, Stachel, Nasdala, Rabeau, Pearson and O'Reilly2013, Rondeau et al. Reference Rondeau, Fritsch, Guiraud, Chalain and Notari2004).
Images of the plate: (а, b) CL images of both sides of the plate, FTIR traverse marked; (c) false colour EBSD map in polar coordinates; (d, e) CL images of the plate fragments, marked on (a) and (b), red lines mark subgrain boundaries revealed by EBSD; (f) image in transmitted light; a dark square-shaped nucleus is seen in the plate centre; (g) colour CL image; (h) PL image under 488 nm excitation with 500 nm longpass edge filter; and (i) PL image under 405 nm excitation with 450 nm longpass edge filter.

Distribution along the plate: (a) nitrogen total and in B form concentration; (b) platelet absorbance αB’ and absorbance of N3VH centre α3107; (c) absorbance of N3 band at 415 nm and the maximum position of the B’ band.

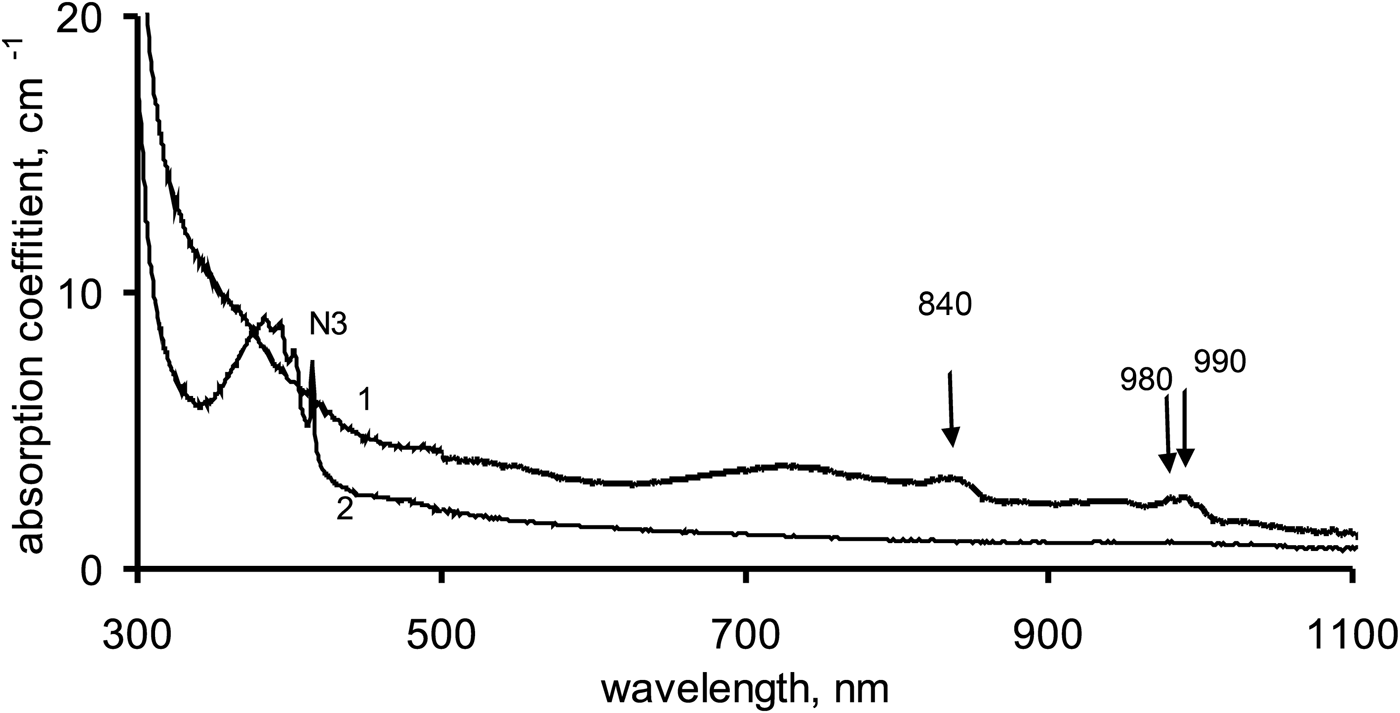
Absorbance spectra of the core contain broad bands centred at 730 and 840 nm and have two peaks at 980 and 990 nm (Fig. 3). In the core, the absorbance of the vacancy-nitrogen centre N3 is close to zero, while at the rim, it increases to 5.3 cm–1. This is an interesting feature because the N3 centre is very stable. It develops during nitrogen aggregation and is a by-product in B-centre formation.
Absorption spectra of the core (1) and intermediate zone (2) at 76 K. Spectra are shifted for clarity.

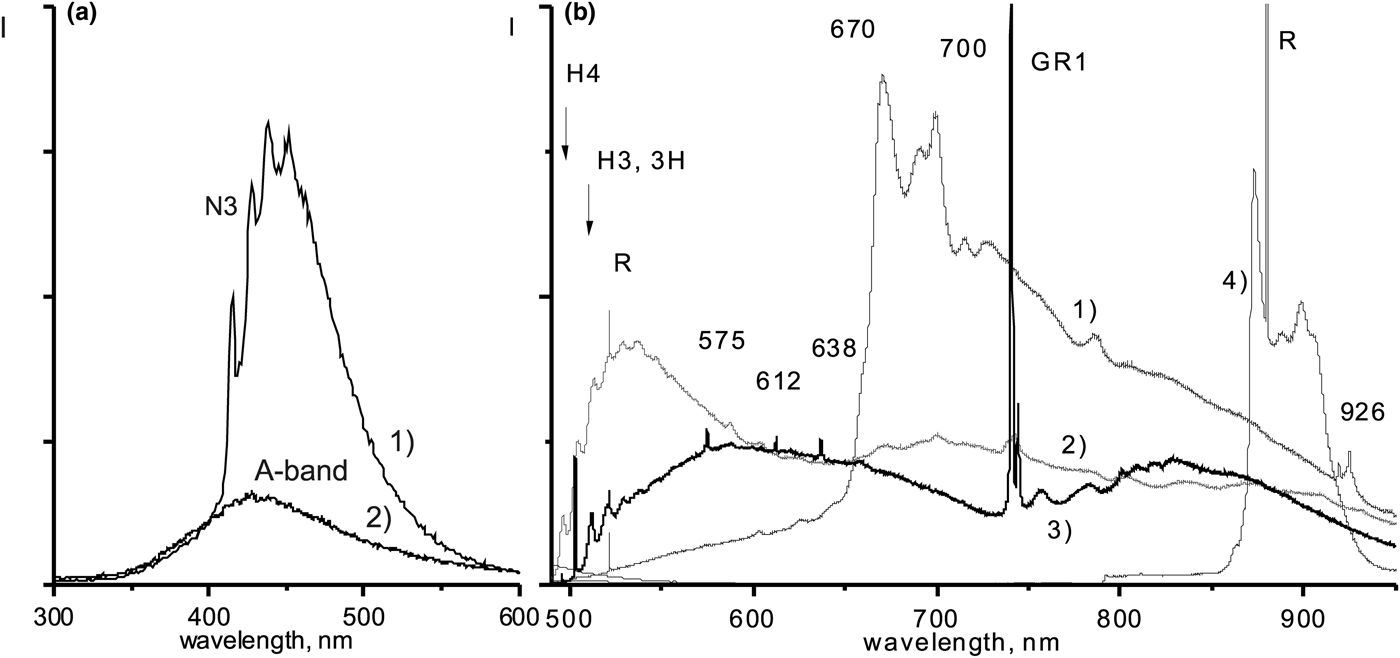
Photoluminescence under 405 nm and 488 nm laser excitation reveals the complex internal structure of the crystal (Fig. 1h,i). As one can see in the PL image, there is a thin non-luminescence layer between the core (red PL) and the intermediate zone (green PL). This layer is not revealed in the CL image. In CL spectra of the core, only the A-band with maximum at 430 nm (Dishler, Reference Dishler2012) was observed (Fig. 4a). In CL spectra of the bright blue intermediate area, the N3 band prevails, its intensity at five times greater than those of the A-band. This spectral feature distinguishes the darkness of the core from the brightness of the intermediate area of the plate. A band with a maximum at 670 nm and 700 nm was recorded in the central part under 488 nm excitation (Fig. 4b). A luminescence system with maximum at 926 nm was also recorded (Fig. 4b). This system at 670 nm exhibits itself as red colouration of the core in the PL image (Fig. 1h). Spectra of this system differ slightly when recorded at 77 and 300 K. The intense luminescence of the H4 system is recorded in the PL spectrum of the intermediate area. H3, 3H, 575, 638 nm nitrogen-vacancy systems, a line at 612 nm, and intense GR1 lines were recorded near the surface. General radiation systems GR1, H3 and H4 are typical for diamonds from placers (Nasdala et al, Reference Nasdala, Grambole, Wildner, Gigler, Hainschwang, Zaitsev, Harris, Milledge, Schulze, Hofmeister and Balmer2013; Vasilev et al, Reference Vasilev, Petrovsky, Kozlov and Antonov2018b).
Luminescence spectra at 77 K: (a) excitation by an electron beam; (b) excitation at 488 nm, (1) the core, (2) the intermediate area, and (3) the rim.

Luminescence is detected in the 860–920 nm range, and weak lines in the 960–970 nm area are detected in the near-surface area with excitation at 785 nm. The spectra in the 860–920 nm range resemble rare-earth element luminescence in calcium minerals (Gaft et al., Reference Gaft, Reisfeld and Panczer2015) and are obviously caused by luminescence of secondary carbonate micro-inclusions in cracks; they are also revealed by FTIR as peaks at 875 cm–1. In the nucleus, only the pentlandite inclusions were identified by Raman spectroscopy, with the background of strong luminescence. In the outer part, many inclusions of clinopyroxene and a grain of anatase were identified by Raman spectroscopy, which is consistent with an eclogitic paragenesis.
Discussion
The plate has a complex zonal internal structure with various contrasts expressed in CL, PL, EBSD and FTIR traverses. Overall, the crystal is saturated by inclusions and cracks. The shape and internal heterogeneities of the crystal due to subgrains are identical to those of rounded stones of variety V (after Orlov, Reference Orlov1977) from the northeastern part of the Siberian platform. The nitrogen content in such crystals ranges from 900 to 3300 ppm; they are saturated with inclusions (Ragozin et al., Reference Ragozin, Zedgenizov, Kuper and Shatsky2016). Both factors may cause splitting growth, which could lead to a block-type internal structure. The crystal in this present work differs from those stones of variety V by having the highest hydrogen content, high model temperature, and a very wide range of nitrogen content.
In transmitted light, there is no clear difference between the core and the outer part of the crystal. The main feature of the plate is the dark CL core. Boundaries of the dark core do not directly correspond to subgrain interfaces but roughly surround them. The boundaries of the dark core extend along cracks and subgrain interfaces to the outer part of the plate. Similar irregular dark CL patterns have been reported previously, but have not yet been discussed in detail (Shatsky et al., Reference Shatsky, Ragozin, Zedgenizov and Mityukhin2008; Ragozin et al., Reference Ragozin, Zedgenizov, Kuper and Shatsky2016, Reference Ragozin, Zedgenizov, Kuper and Palyanov2017; Reference Ragozin, Zedgenizov, Shatsky and Kuper2018; Thomson et al., Reference Thomson, Kohn, Bulanova, Smith, Araujo and Walter2014). In most the cases the concentration the nitrogen and hydrogen have not been studied. Another feature of the crystal is the dark wavy lines with a thickness (radii) of 35–45 μm.
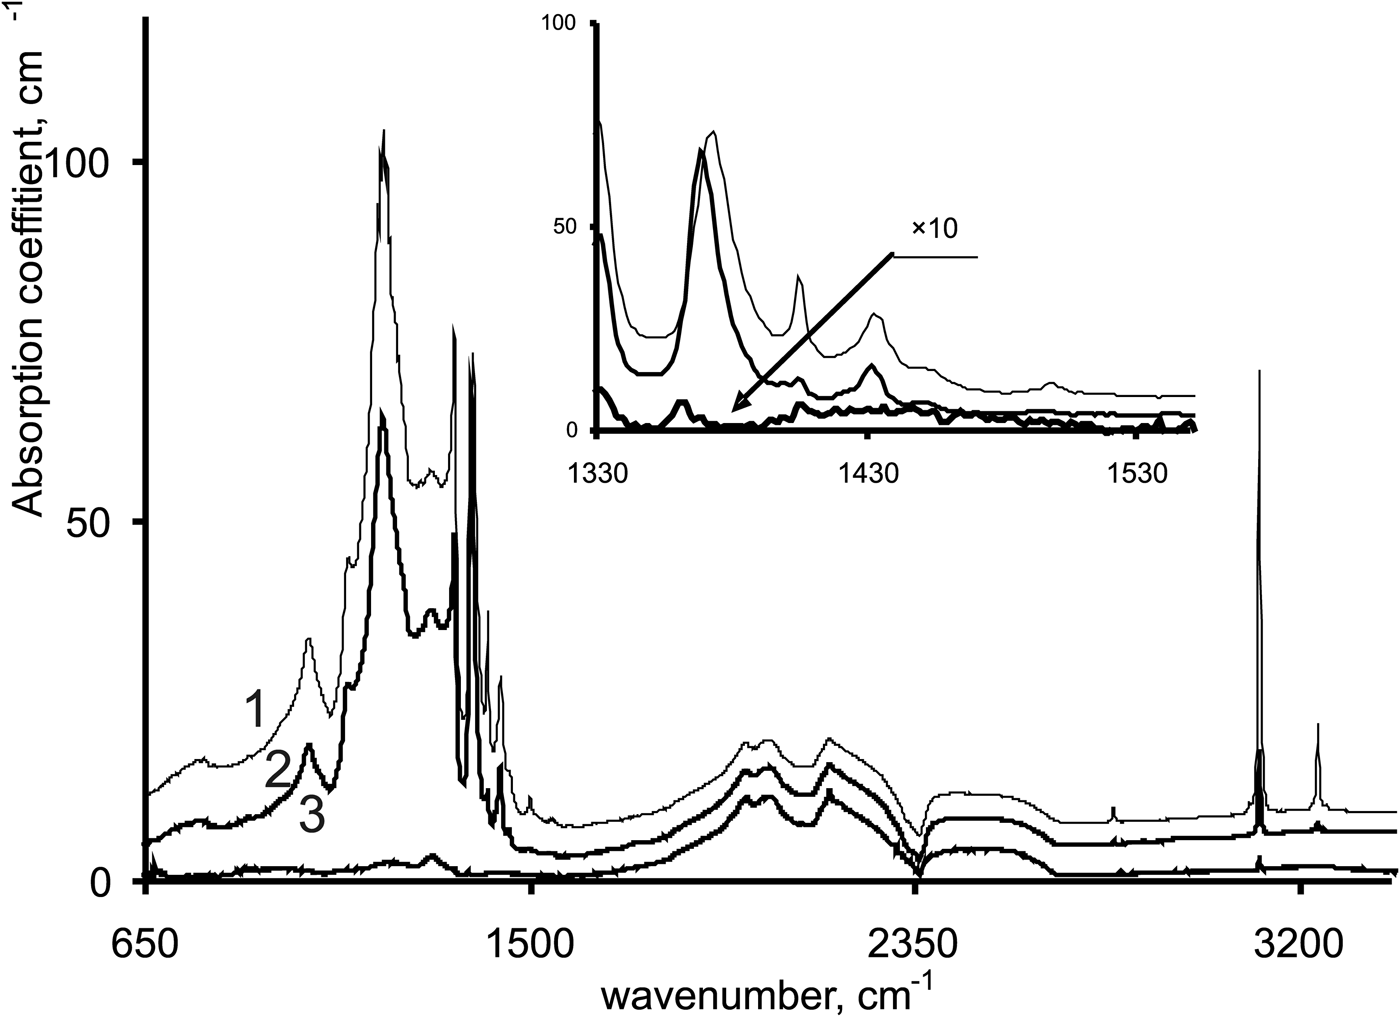
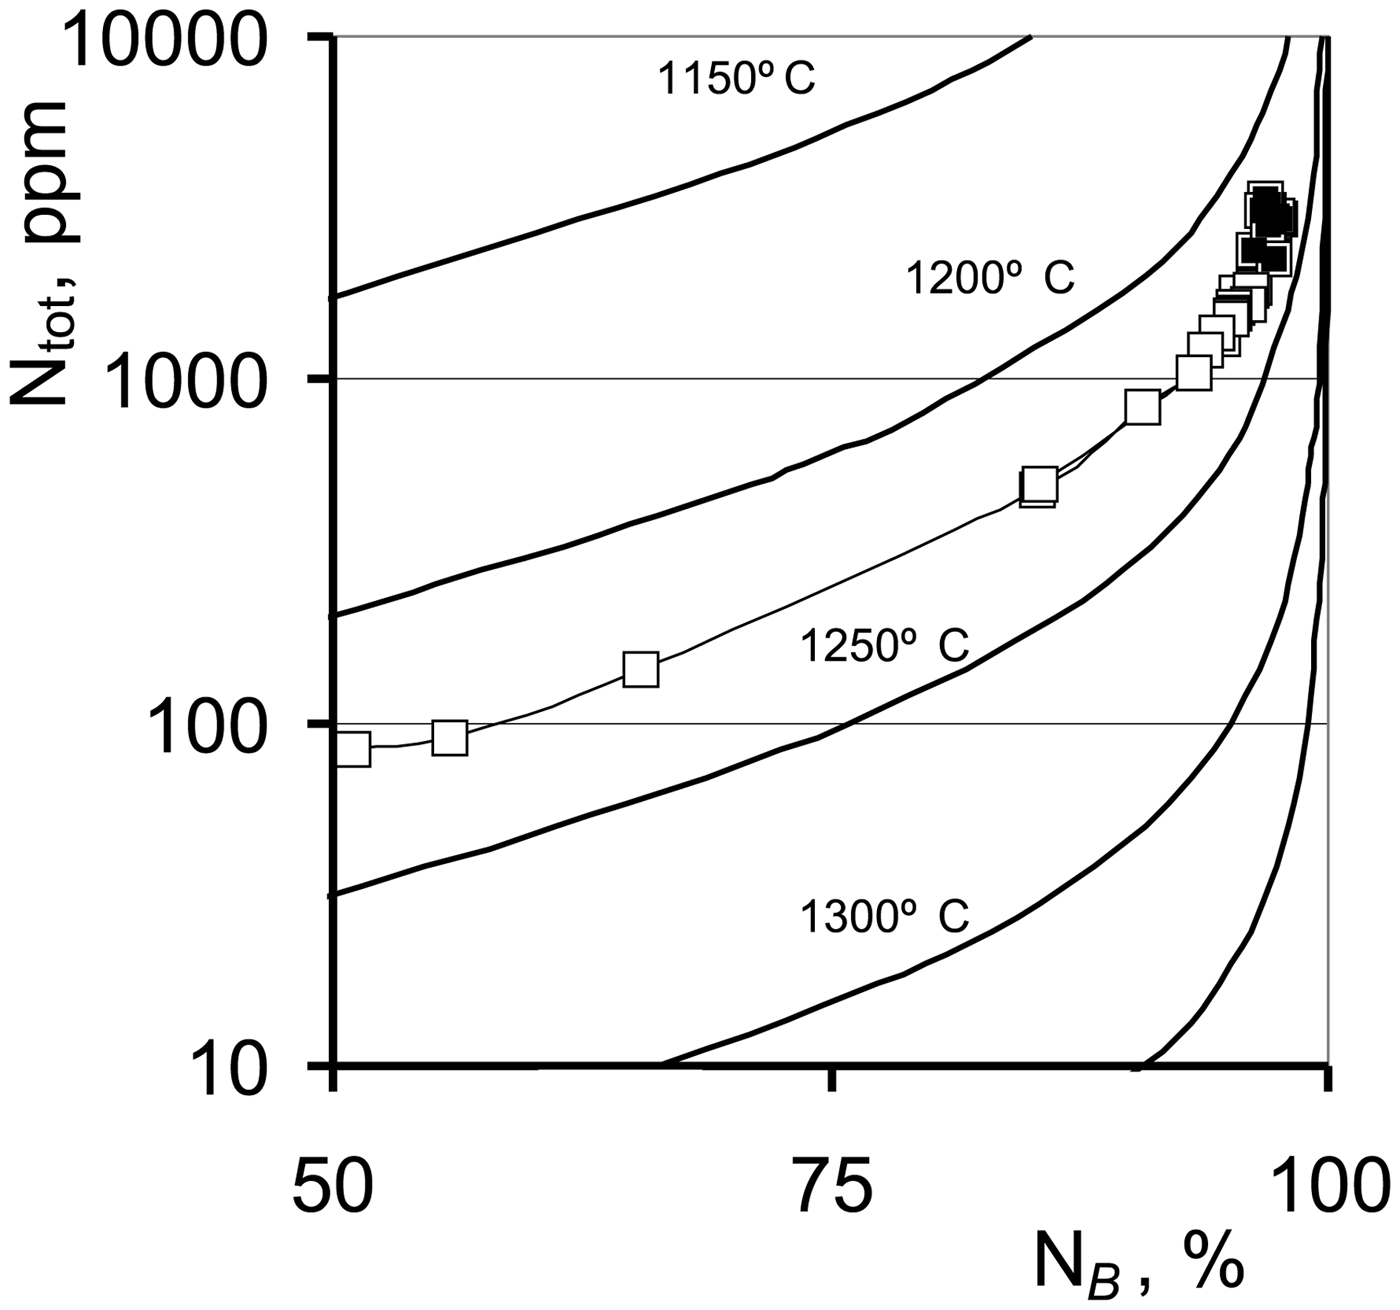
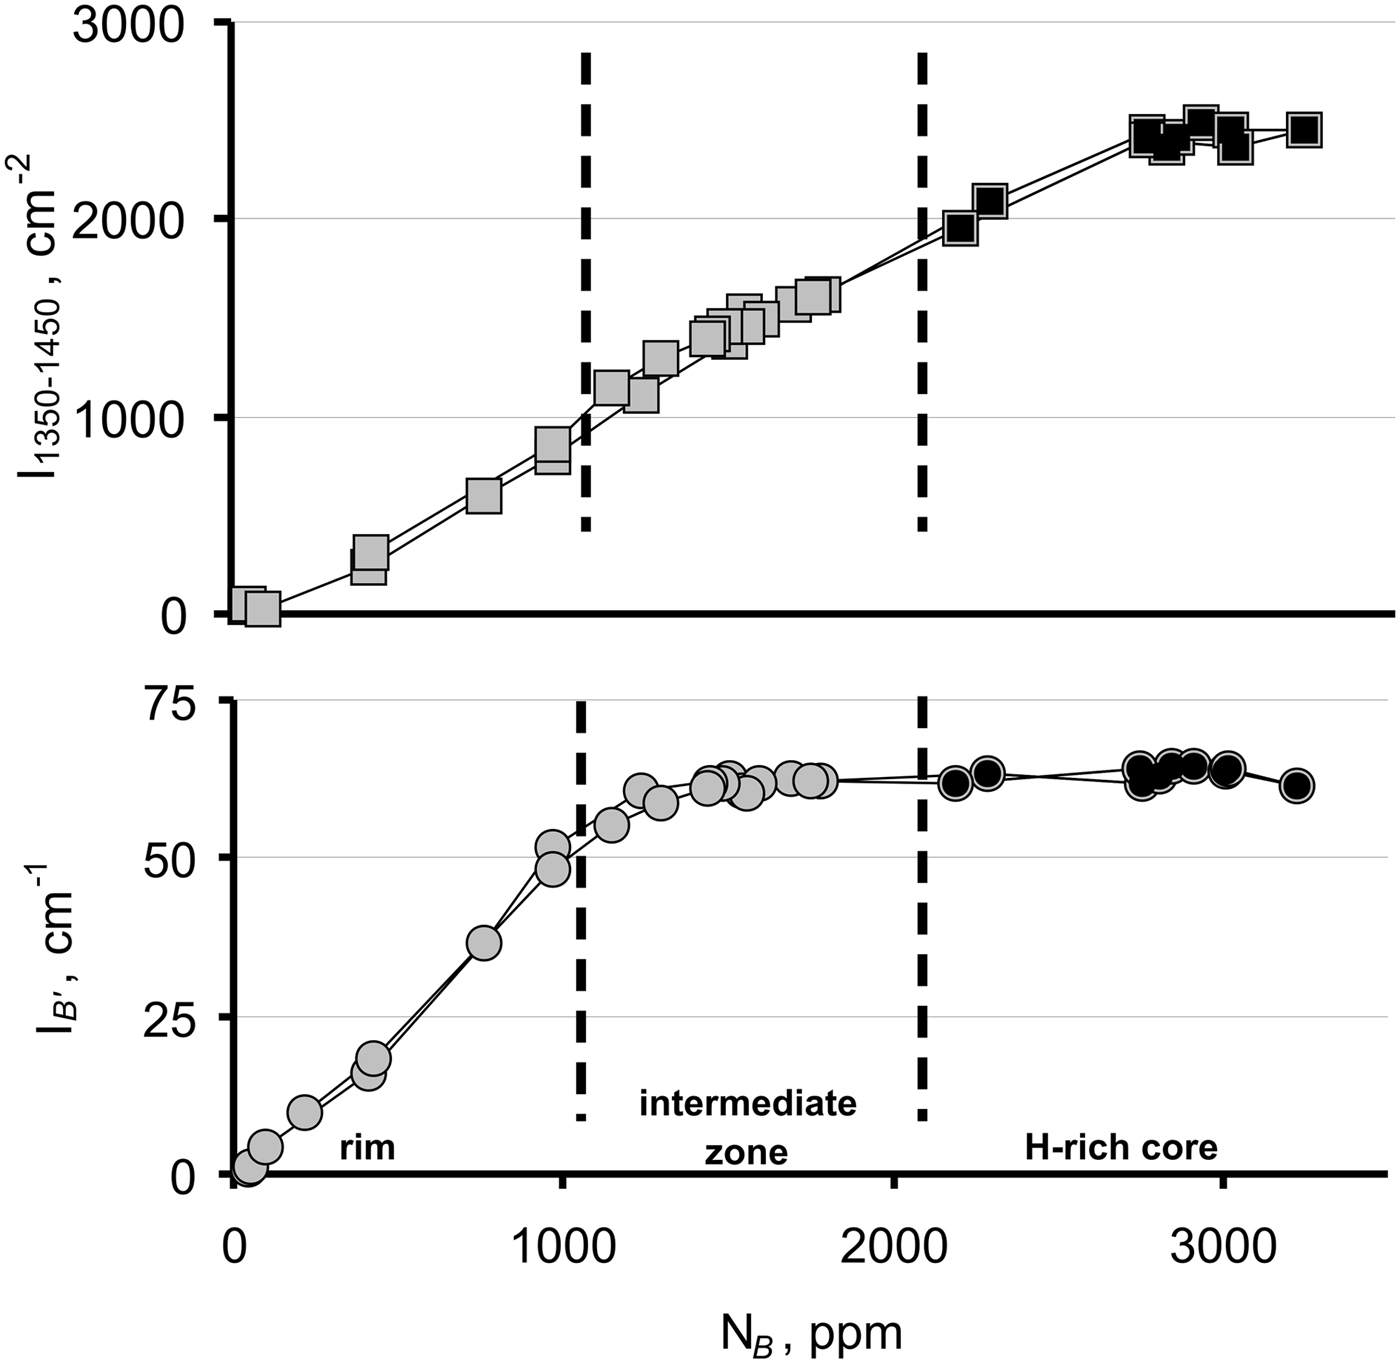
In the core centre, there is a nucleus saturated with inclusions. FTIR spectra of the nucleus show no evidence of carbonates or water-bearing inclusions. These are typical for morphologically similar cloudy inclusions in the nucleus area of some diamonds (Skuzovatov et al., Reference Skuzovatov, Zedgenizov, Howell and Griffin2016). In the FTIR spectra of the nucleus, B’ band have the largest width and distribution of the platelets, and the size is shifted towards small values (Fig. 5). From this fact, it follows that the temperature of the formation of the nucleus is higher than in the remaining volume (Vasilev and Sofroneev, Reference Vasilev and Sofroneev2007, Speich et al, Reference Speich, Kohn, Bulanova and Smith2018). The core has the highest nitrogen content and the highest amount of B defects (Fig. 2a,b). The thermal history of the diamond in terms of nitrogen aggregation seems to be quite simple; all the data points are located along the isotherm (Fig. 6). We relate small discrepancies in the aggregation stage of some points to a high gradient of nitrogen concentration (Kohn et al., Reference Kohn, Speich, Smith and Bulanova2016). Unlike the model temperature, the nitrogen concentration varies very significantly from 70 ppm near the surface to 3100 ppm in the core. In terms of nitrogen aggregation, these data imply that the influence of the post-growth annealing of the whole crystal is much greater than that of annealing during growth. Further evidence in the thermal history of a crystal is the relationship between B and B’ absorption (Fig. 7). Only FTIR spectra of the rim are regular in terms of Woods (Reference Woods1986); in this part, B’ absorbance is proportional to the concentration of the B form of nitrogen. In the intermediate zone, B’ absorbance is constant while integral absorbance in the 1350–1450 cm–1 range is proportional to the NB. In this part, regular platelets have been partly transformed. In the hydrogen-rich core, some platelet-related defects transform to IR-inactive defects. As is typical for diamonds with fully aggregated nitrogen, some of the platelets have undergone degradation into dislocation loops and voidites (Evans et al., Reference Evans, Kiflawi, Luyten, Van Tendeloo and Woods1995; Luyten et al., Reference Luyten, Vantendeloo, Fallon and Woods1994; Van Tendeloo et al., Reference Van Tendeloo, Luyten and Woods1990).
FTIR spectra of the core (1), intermediate zone (2) and outer parts (3); the inset shows the enlarged range 1340–1550 cm–1. Spectra are shifted for clarity. Note the difference between spectra of the core and the intermediate zone: the nitrogen content in the core is higher, and the height of the B’ band is the same, but its width is much larger. Additionally, the absorbance at 1400–1470 cm–1 is larger in the core.

A plot of nitrogen aggregation vs. nitrogen concentration, with isochrones plotted for 1 Ga mantle residence time. Black symbols indicate the hydrogen-rich core.

A plot of nitrogen in B form vs B’ absorbance and vs integrated absorbance in 1350–1450 cm–1 range. Black symbols indicate the hydrogen-rich core.

The main CL colour of the plate is blue, but some near-surface layers have green luminescence of H3 and H4 centres of irradiation origin (Nasdala et al., Reference Nasdala, Grambole, Wildner, Gigler, Hainschwang, Zaitsev, Harris, Milledge, Schulze, Hofmeister and Balmer2013; Vasilev et al., Reference Vasilev, Kozlov and Petrovsky2018a). The plate has a rare PL band with maxima at 660, 670, 693 and 700 nm. This uncommon luminescence system was observed in cubic growth sectors of diamonds with a nitrogen share of almost 100% in B form (Lang et al., Reference Lang, Bulanova, Fisher, Furkert and Sarua2007) and in high-nitrogen high-hydrogen violet and blue diamonds from the Argyle mine, Australia (Van der Bogert et al., Reference Van der Bogert, Smith, Hainschwang and McClure2009). Systematics and transformation of PL-active centres in diamonds remain unresolved. This is the difference between the PL-active centres in contrast to the IR-active centres with a known series of transformations (Kiflawi and Bruley, Reference Kiflawi and Bruley2000). There are PL centres with a well-established origin: NV, NV –, H2, H3, GR1, 3H and N3. Many minor luminescence systems are revealed, but their origin remains unknown (Dishler, Reference Dishler2012). Therefore, variations in the set of minor or rare luminescence systems for zones and growth sectors, as well as their relationship to growth conditions and the thermal history of crystals, are still uncertain.
It is known that hydrogen reduces the luminescence of NV centres, possibly by the formation of NVH centres (Stacey et al., Reference Stacey, Karle, McGuinness, Gibson, Ganesan, Tomljenovic-Hanic, Greentree, Hoffman, Beausoleil and Prawer2012). The hydrogen concentration in IR-active form, measured as absorbance at 3107 cm–1, differs in cuboid and octahedral zones in mixed-growth diamonds, which have different CL intensities (Howell et al., Reference Howell, Griffin, Piazolo, Say, Stern, Stachel, Nasdala, Rabeau, Pearson and O'Reilly2013). In some zonal crystals, one can see the inverse relationship between the concentration of hydrogen and the intensity of blue cathodoluminescence (Howell et al., Reference Howell, O'Neill, Grant, Griffin, O'Reilly, Pearson, Stern and Stachel2012). Controversially, in some monochrome CL images of mixed-growth diamonds (Howel et al., Reference Howell, Griffin, Piazolo, Say, Stern, Stachel, Nasdala, Rabeau, Pearson and O'Reilly2013), the luminescence intensity is stronger in cuboid sectors, where absorbance at 3107 cm–1 is higher than in octahedral sectors. Under identical conditions in some stones, cuboid sectors are brighter than octahedral sectors, while in other stones, it is vice versa (Rondeau et al., Reference Rondeau, Fritsch, Guiraud, Chalain and Notari2004). Undoubtedly the hydrogen concentration is only one of many parameters connected to the CL intensity. The main known factor of the quenching of the point defects luminescence in a diamond is the concentration of A centres (Collins, Reference Collins1992; Vasilev et al., Reference Vasilev, Ivanov-Omskii, Pomazanskii and Bogush2004). In our plate, the concentration of A centres is very small, and the diffusion mobility of this defect is negligible. Hence, A centres cannot cause the observed quenching patterns. Therefore, we can assume that hydrogen, only part of which is in an IR-active form, somehow affects CL intensity. It is still not clear in what form IR-inactive hydrogen is incorporated in diamonds. Annealing of diamonds can lead to increase of 3107 cm–1 absorbance (Kiflawi et al., Reference Kiflawi, Fisher, Kanda and Sittas1996), as well as to its decrease (De Weerdt and Collins, Reference De Weerdt and Collins2006). Therefore, there are several forms of incorporation of hydrogen in a diamond, there is an antecedent to N3VH centres, and there are products of its transformation.
The absence of N3 centres in the core is another feature of the crystal. It is believed that during nitrogen aggregation to the B centres, small amounts of nitrogen agglomerate as N3 centres, which are a planar array of three nitrogen atoms surrounding a common vacancy V. The N3 centre is created during nitrogen aggregation and it is a step in the B-centre formation. There are several models of the B defect formation sequence, in which vacancy-nitrogen centres H3 and N3 are discussed as a by-product (Goss et al., Reference Goss, Goomer, Jones, Fall, Briddon and Öberg2003; Vins and Eliseev, Reference Vins and Eliseev2010):
 $$ \eqalign{ &\hskip -7pc A\left( {{\rm N}_2} \right){\rm } + \left( {I + V} \right){\rm } \to H3\left( {{\rm N}_2V} \right){\rm } + I;{\rm n}I \to I_{\rm n}; \cr &\hskip -7pc H3\left( {{\rm N}_2V} \right){\rm } + A\left( {{\rm N}_2} \right)\to B\left( {{\rm N}_4V} \right)$$
 $$ \hskip -3pc \eqalign{& A\lpar {{\rm N}_2} \rpar {\rm} \to 2C\lpar {\rm N} \rpar ;C + A\lpar {{\rm N}_2} \rpar {\rm} \to N3\lpar {{\rm N}_3V} \rpar + I;{\rm} nI \to I_{\rm n}; \cr& N3\lpar {{\rm N}_3V} \rpar {\rm} + C\lpar {\rm N} \rpar {\rm} \to B\lpar {{\rm N}_4V} \rpar $$
 $$ \hskip -4.3pc \eqalign{& I_{\rm n} + \lpar {I + V} \rpar {\rm} \to I_{{\rm n} + 1} + V;A\lpar {{\rm N}_2} \rpar {\rm} + V \to H3\lpar {{\rm N}_2V} \rpar ; \cr& H3\lpar {{\rm N}_2V} \rpar {\rm} + A\lpar {{\rm N}_2} \rpar {\rm} \to B\lpar {{\rm N}_4V} \rpar $$
 $$ \hskip -8pt \eqalign{& I_{\rm n} + \lpar {I + V} \rpar {\rm} \to I_{{\rm n} + 1} + V;A\lpar {{\rm N}_2} \rpar {\rm} \to 2C\lpar {\rm N} \rpar ;C\lpar {\rm N} \rpar {\rm} + V \to {\rm N}V; \cr& {\rm} A\lpar {{\rm N}_2} \rpar + {\rm N}V \to N3\lpar {{\rm N}_3V} \rpar ; N3\lpar {{\rm N}_3V} \rpar {\rm} + C\lpar {\rm N} \rpar {\rm} \to B\lpar {{\rm N}_4V} \rpar $$
Here I = interstitials, I n = platelets. Which of these models is realised may be dependent on the temperature, the thermal history of the crystal and the nitrogen concentration.
The N3 centre is one of most stable defects; it does not anneal out at temperatures below 2300°C at a timescale available in a laboratory. Regardless of the thermal stability, all N3 defects as by-products of B-centre formation will eventually transform into B defects during long-term annealing (Vins and Eliseev, Reference Vins and Eliseev2010). In contrast, as by-products, N3 centres will not anneal out until full A to B transformation.
Only one hydrogen atom distinguishes the best-studied centre N3 from the centre N3VH with absorption band at 3107 cm–1 (Goss et al., Reference Goss, Briddon, Hill, Jones and Rayson2014). Therefore, we can assume incorporation of a hydrogen atom in the N3 centre:
 $$N3\lpar {{\rm N}_3V} \rpar {\rm} + {\rm H} \to {\rm} {\rm N}_3V{\rm H}$$
After trapping a hydrogen atom, the N3 centre transforms to PL-inactive but IR-active form N3VH. Full transformation of the N3 to PL-inactive form N3VH leads to absence of the N3 centre in the nitrogen-rich high-aggregated core. There is experimental evidence of long-range hydrogen diffusion through diamonds (Saguy et al., Reference Saguy, Cytermann, Fizgeer, Richter, Avigal, Moriya, Kalish, Mathieu and Deneuville2003). Here, if we assume the diffusion of hydrogen causes a reduction in PL, we see the possible diffusion length of up to 40 μm. Where did hydrogen come from? The nucleus in the crystal core might be the source of hydrogen. Determining the total hydrogen concentration in the crystal core and in the nucleus is the goal of further research.
In the investigated crystal we have distinguished four stages of growth. The first was growth of square-shaped nucleus, at the highest temperature. The second was growth in high-nitrogen, high-hydrogen environment; at this stage the splitting growth causes genesis of subgrains. The third was growth in a relatively low hydrogen eclogitic environment, at lower temperature. The fourth was growth in a low nitrogen environment, at this stage re-entrant corners between subgrains were filled by a low nitrogen, low hydrogen diamond. After growth was terminated, the crystal was naturally annealed; the model temperature is 1225°C for a mantle residence time of 1 Ga (after Taylor et al., Reference Taylor, Jaques and Ridd1990). During this annealing, hydrogen diffused from core to rim along cracks and subgrain boundaries; H atoms were trapped by N3 centres, converting them into a PL-inactive form. Dissolution was the final stage of the crystal genesis.
Conclusions
The internal heterogeneities of different origin were found in a diamond crystal from the Ichetju placer, northern Urals. The nitrogen content in the crystal exceeds 3100 ppm; the absorbance of N3VH centres at 3107 reaches 75 cm–1. The high concentration of impurities has caused the splitting growth of the crystal. The most interesting feature of the crystal is the darkness in the CL core because of its irregular boundaries and extensions along the cracks and subgrain interfaces. In the core, there are no N3 centres, which cause the bright blue luminescence of the outer part of the crystal. We suppose a conversion of nitrogen-vacancy N3 centres to PL-inactive IR-active N3VH centres. This supposition with respect to the highest content of hydrogen in the crystal core and its high diffusion mobility allows us to assume that the darkness in the CL boundaries marks hydrogen distribution. To verify the transformation of N3 centres to N3VH, it is necessary to carry out experiments on high-temperature annealing.
Acknowledgements
This study has been partly funded by Russian Science Foundation grant 19-17-00131. The reviewers and Associate Editor Sergey Krivovichev are thanked for comments and editorial handling of the manuscript.
Supplementary material
To view supplementary material for this article, please visit https://doi.org/10.1180/mgm.2019.32