


Introduction
Studies on population genetics of agricultural pests have emphasized the importance of the genetic structure and patterns of gene flow for the effective implementation of Integrated Pest Management (IPM) programs (Krafsur, Reference Krafsur, Dyck, Hendrichs and Robinson2005; Ochando et al., Reference Ochando, Reyes, Segura, Callejas and Rutgers2010) and for implementing strategies for insect resistance management to insecticides and transgenic crops (Gould et al., Reference Gould, Anderson, Reynolds, Bumgarner and Moar1995; Fuentes-Contreras et al., Reference Fuentes-Contreras, Espinoza, Lavandero and Ramirez2008). Although gene flow and genetic variation among populations may be difficult to measure directly, these parameters can be estimated by using molecular markers (Slatkin, Reference Slatkin1985; Roderick, Reference Roderick1996).
Among the different classes and types of available molecular markers for studies of insects (Behura, Reference Behura2006), sequences of mitochondrial DNA (mtDNA) have been successfully used for population genetics studies of several groups of Lepidoptera (Sperling & Hickey, Reference Sperling and Hickey1994; Behere et al., Reference Behere, Tay, Russell, Heckel, Appleton, Kranthi and Batterham2007; Porreta et al., Reference Porreta, Canestrelli, Bellini, Celli and Urbanelli2007), including analyzes of population structure and gene flow, phylogeography and phylogenetic relationships (Avise, Reference Avise2000; Peña et al., Reference Peña, Wahlberg, Weingartner, Kodandaramaiah, Nylin, Freitas and Brower2006; Norgate et al., Reference Norgate, Chamings, Pavlova, Bull, Murray and Sunnucks2009). Mitochondrial markers are especially suitable for the analysis of populations, and the history and evolution between closely related taxa due to their relative small size, high rate of evolutionary change and maternal inheritance (Simon et al., Reference Simon, Frati, Beckenbach, Crespi, Liu and Flook1994; Caterino et al., Reference Caterino, Cho and Sperling2000). Several studies have investigated mainly the subunits I and II of the cytochrome c oxidase gene (cox1 and cox2) (Brower, Reference Brower1994a; Caterino et al., Reference Caterino, Reed, Kuo and Sperling2001; Silva-Brandão et al., Reference Silva-Brandão, Freitas, Brower and Solferini2005). Since the suitability of cox1 for species identification and delimitation was proposed (‘DNA barcode’: Hebert et al., Reference Hebert, Stoeckle, Zemlak and Francis2004), the use of cox1 has outnumbered the use of other mitochondrial regions in studies with animals, including many Lepidoptera (Silva-Brandão et al., Reference Silva-Brandão, Lyra and Freitas2009). Currently, the availability of complete genomes of several species of Lepidoptera (Cameron & Whiting, Reference Cameron and Whiting2008; Yang et al., Reference Yang, Wei, Hong, Jiang and Wen2009) allows for the evaluation and selection of additional genes for studies at all taxonomic levels in this group. The subunits of the nicotinamide adenine dinucleotide dehydrogenase (NADH) gene are an example, as they have been recently applied in several studies on population genetics (Meraner et al., Reference Meraner, Brandstätter, Thaler, Aray, Unterlechner, Niederstätter, Parson, Zelger, Dalla Via and Dallinger2008; Gomez-P et al., Reference Gomez-P, Giraldo, Lopez and Uribe2009; Miller et al., Reference Miller, Dorhout, Rice and Sappington2009) despite their previous use in butterflies higher taxonomic levels studies (Weller et al., Reference Weller, Pashley, Martin and Constable1994; Morinaka et al., Reference Morinaka, Maeyma, Maekawa, Erniwati, Prijono, Ginarsa, Nakazawa and Hidaka1999; Yagi et al., Reference Yagi, Sasaki and Takebe1999).
The tobacco budworm Heliothis virescens (F.) is an important pest of cotton (Gossypium hirsutum L.) in the American continent. H. virescens is a polyphagous species, described as feeding on 14 families of host plants in nature (Waldvogel & Gould, Reference Waldvogel and Gould1990), which could possibly lead to a high variation among geographically separated populations due to host plant specialization. In Brazil, H. virescens occurs in all major cotton-producing areas at different infestation levels (Degrande, Reference Degrande1998) and has recently become an important pest of soybean (Glycine max (L.) Merr.) (Tomquelski & Maruyama, Reference Tomquelski and Maruyama2009). The occurrence of H. virescens in cotton- and soybean-producing areas has impacted the IPM strategies in practice in these crops.
Because of the excessive use of insecticides to its control, H. virescens has already evolved resistance (McCaffery, Reference McCaffery1998), which makes it particularly difficult to manage. Genetically modified (GM) plants expressing genes from the entomopathogenic bacterium Bacillus thuringiensis Berliner (Bt) are also available as an alternative controlling strategy of H. virescens. However, the potential for insect populations to develop resistance to Bt proteins has been a major threat and limitation to the sustainable use of this technology (Gould et al., Reference Gould, Martinezramirez, Anderson, Ferre, Silva and Moar1992). Although several strategies have been proposed to delay resistance to Bt-crops (Tabashnik, Reference Tabashnik1994; Alstad & Andow, Reference Alstad and Andow1995), attention has been focused on the refuge strategy, i.e. areas of cultivation of non-Bt host plants retained nearby toxic Bt-plant fields (Gould, Reference Gould1998). These areas of refuge would function as a source of susceptible individuals to mate with the resistant ones from Bt-plants (Tabashnik & Carrière, Reference Tabashnik, Carrière and Tilmon2008). Alternative host plants present in the same region could also contribute as a source of susceptible individuals. However, for these individuals to be effectively considered as a source of susceptibility to resistance management, alternative hosts should contain a population able to randomly mate with individuals emerging from Bt-crops (Martel et al., Reference Martel, Réjasse, Rousset, Bethenod and Bourguet2003). Therefore, studies on genetic structure of insect pests are especially important in designing resistance management strategies.
The aim of this study was to evaluate the genetic variability and population structure of H. virescens sampled in the major cotton- and soybean-producing regions in Brazil by using sequences of mitochondrial genes. Studies were conducted to (i) estimate the genetic diversity and population structure among cotton and soybean-feeding populations sampled in different growing seasons and regions, and (ii) investigate the demographic history of H. virescens in Brazil.
Material and methods
Specimens
Eleven populations of H. virescens were sampled from cotton-producing areas in the growing seasons 2007/2008, 2008/2009 and 2009/2010, and from soybean in 2009/2010 (table 1). Larvae were collected early in the infestation and reared on a white bean-based artificial diet adapted from Greene et al. (Reference Greene, Leppla and Dickerson1976). The obtained pupae were placed on Petri dishes lined with filter paper and covered with a thin layer of vermiculite until adult emergence. Adults were immediately frozen at −20°C for DNA extraction.
Features of sampled populations of H. virescens, with locality and date of collection, population code and total number of specimens sequenced for each mitochondrial region.

Gm, Glycine max.
DNA extraction, amplification and sequencing
Total genomic DNA was isolated from the thorax of adults of H. virescens according to the protocol of the Invisorb Spin Tissue kit (STRATEC Molecular, Berlin, Germany). The genes cox1 and cox2 (ca. 2200 bp) and the subunit 6 of NADH (nad6, ≈500 bp) were chosen for genetic analysis. The primers sets LCO+HCO (Folmer et al., Reference Folmer, Black, Hoeh, Lutz and Vrijenhoek1994) and Jerry+PatII (Caterino & Sperling, Reference Caterino and Sperling1999) were used to amplify cox1, George+Imelda (Brower et al., Reference Brower, Freitas, Lee, Silva-Brandão, Whinnett and Willmott2006) to amplify cox2 and tPro-J10090 and ND6-N10624 to amplify nad6 (Silva-Brandão et al., in press).
Amplification reactions were accomplished by using 1 μl of total DNA, 2.0 mM of MgCl2, 40 μM of dNTPs, 0.2 mM of each primer, 1 U of GoTaq® DNA Polymerase (Promega), 10% of 10× Taq Buffer in a 25 μl final volume. The PCR program to amplify cox1 and cox2 included an initial denaturation step at 95°C for 3 min, followed by 35 cycles of denaturation at 94°C for 30 s, annealing at 45–47°C for 30 s and polymerization at 72°C for 1.5 min, followed by an extension step at 72°C for 10 min. For nad6, PCR program included an initial denaturation step at 94°C for 5 min, followed by 35 cycles of denaturation at 94°C for 45 s, annealing at 45°C for 45 s and polymerization at 60°C for 1.5 min, followed by an extension step at 60°C for 5 min. After amplification, aliquots were analyzed by agarose gel electrophoresis using a 1% gel stab.
Amplicons were purified by using the Invisorb Fragment CleanUp kit (STRATEC Molecular) and sequenced by the ABI 377 or 3700 automated sequencers. The sequences obtained were analyzed by using the software FinchTV v.1.4.0 (Geospiza Inc., Seattle, WA, USA) and manually aligned in the software BioEdit v. 7.0.5.3 (Hall, Reference Hall1999).
Genetic distances and clustering analyzes
Unless otherwise indicated, all genetic analyzes were done using concatenated datasets for the obtained cox1, cox2 and nad6 sequences.
Genetic divergence of the three separated mtDNA regions were estimated by using Mega v.5 (Tamura et al., Reference Tamura, Peterson, Peterson, Stecher, Nei and Kumar2011) and DnaSP v.5 (Librado & Rozas, Reference Librado and Rozas2009). Genetic distances were calculated by using the p-distance model of nucleotide substitution (Nei & Kumar, Reference Nei and Kumar2000). Nucleotide diversity (π) and haplotype diversity (Ĥ), as defined by Nei (Reference Nei1987), were estimated by using Arlequin v.3.5 (Excoffier & Lischer, Reference Excoffier and Lischer2010). Current (θπ) and historical (θW) genetic diversities were assessed by using DnaSP v.5 (Librado & Rozas, Reference Librado and Rozas2009).
A minimum spanning network was calculated by using the program TCS v.1.21 (Clement et al., Reference Clement, Posada and Crandall2000), which uses the statistical probability based on the parsimony criterion to estimate genealogies of haplotypes (Templeton et al., Reference Templeton, Crandall and Sing1992). The connection of two haplotypes was limited by a probability of parsimony for DNA pairwise differences lower than 0.95. Network ambiguities were resolved by following the guidelines proposed by Crandall & Templeton (Reference Crandall and Templeton1993).
Analysis of molecular variance (AMOVA) was performed to assess the genetic structure among and within populations of H. virescens (Excoffier et al., Reference Excoffier, Smouse and Quattro1992), as implemented in the software Arlequin v.3.5 (Excoffier & Lischer, Reference Excoffier and Lischer2010). Three analyzes were conducted to quantify the distribution of the molecular variation attributed to the presence of genetic structure: (i) among individuals from all populations (non-hierarchic), (ii) among individuals within the different growing seasons, and (iii) among individuals sampled from soybean vs cotton. The degree of structure was interpreted by the statistics Φ associated with the different hierarchical levels in which the variation is distributed (Excoffier et al., Reference Excoffier, Smouse and Quattro1992). The parameters applied were: 10,000 permutations to determine significance, computed distance matrix using pairwise difference, and gamma a value equal 0. In addition, a matrix of Slatkin's pairwise linearized distances (Slatkin, Reference Slatkin1995) was estimated with Arlequin v.3.5 (Excoffier & Lischer, Reference Excoffier and Lischer2010).
Concatenated mtDNA sequences were analyzed with two different clustering methods, neighbor-joining (NJ) and principal component analysis (PCA). A dendrogram presenting the phenetic relationships among H. virescens specimens was obtained by using Mega v.5 (Tamura et al., Reference Tamura, Peterson, Peterson, Stecher, Nei and Kumar2011), with NJ clustering method and p-distance model of nucleotide substitution (Nei & Kumar, Reference Nei and Kumar2000). The reliability of each branch was determined by using the non-parametric bootstrapping procedure (Felsenstein, Reference Felsenstein1985) with 1000 replicates.
To perform multivariate PCA, each mutation found in the alignment of the three mitochondrial genes was treated as a single nucleotide polymorphism (SNP), and a new matrix composed only by these variable positions was constructed by using MEGA v.5 (Tamura et al., Reference Tamura, Peterson, Peterson, Stecher, Nei and Kumar2011). Each nucleotide was numerically coded as follows: A=1, C=2, G=3, T=4 and all other characters=0. PCAs based on Nei's genetic distance for individuals and on a pairwise matrix of ΦPT genetic distances for populations were calculated using the software Genalex (Peakall & Smouse, Reference Peakall and Smouse2006), with default parameters provided by the program.
Demographic history
The demographic history of the sampled populations was inferred by the distribution of paired differences among sequences (mismatch distribution analysis) (Slatkin & Hudson, Reference Slatkin and Hudson1991; Rogers & Harpending, Reference Rogers and Harpending1992). Mismatch distributions were graphically plotted with the R statistical package implemented in Arlequin v.3.5 (Excoffier & Lischer, Reference Excoffier and Lischer2010). According to simulations, populations in long stable demographic equilibrium must present a multimodal pattern, whereas populations that have experienced a recent expansion generally show a unimodal distribution (Rogers & Harpending, Reference Rogers and Harpending1992). This analysis was also applied to estimate the parameters of demographic expansion θ0, θ1 and Tau (τ) (using α=0.05 and 10,000 permutations). The adjustment to a model of population expansion was estimated from the sum of squared deviations (SSD) and the raggedness index (r), with significance evaluated by 10,000 permutations, under the sudden expansion model. Additionally, selective neutrality tests based on Tajima's parameter D (Tajima, Reference Tajima1989), and Fu's parameter F S (Fu, Reference Fu1997) were also estimated. All analyzes were developed in Arlequin v.3.5 (Excoffier & Lischer, Reference Excoffier and Lischer2010).
Historical dynamics of the population size fluctuation over time were further estimated by the Bayesian skyline plot (BSP) approach (Drummond et al., Reference Drummond, Rambaut, Shapiro and Pybus2005) based on a coalescent model analyzed by Markov Chain Monte Carlo sampling, as implemented by the program BEAST v.1.4.8 (Drummond & Rambaut, Reference Drummond and Rambaut2007). First of all, the program MrModeltest v.2 (Nylander, Reference Nylander2004) was used to determine the available substitution model with the best fit to each mitochondrial region. One hundred million interactions were run, with samples drawn every 10,000 MCMC steps, after a discarded burn-in of 10,000,000 steps, under the models of nucleotide substitution GTR+I for cox1, GTR for cox2 and HKY+I for nad6. Strict molecular clock model was applied with a mutation rate of 2% per million years for all partitions, as proposed for cox1 sequences (Brower, Reference Brower1994b). Skyline plots were visualized with Tracer v.1.5 (Rambaut & Drummond, Reference Drummond and Rambaut2007) from posterior distributions of parameters. The x-axis was reported as time in millions of years and the y-axis as Neτ, where Ne is the effective population size and τ is the generation time in the units ascribed to model parameters (Drummond et al., Reference Drummond, Rambaut, Shapiro and Pybus2005).
Results
The analyzed cox1, cox2 and nad6 fragments were of 1486 bp, 682 bp and 501 bp, respectively (GenBank accession numbers: cox1 JN798937–JN799050, cox2 JN799051–JN799151 and nad6 JN109017–JN109038 (Silva-Brandão et al., Reference Silva-Brandão, Lyra, Santos, Seraphim, Albernaz, Pavinato, Martinelli, Cônsoli and Omotoin press) and JN799152–JN799250). The mean genetic distance (uncorrected p-distance, Nei & Kumar (Reference Nei and Kumar2000)) among cox1 haplotypes was 0.001 (0–0.003), 0 (0–0.004) for cox2, and 0.001 (0–0.006) for nad6 (table 2). Sequences of nad6 presented the highest percentage of polymorphic sites (2.4%) and nucleotide diversity (π=0.13%).
Statistical summary of nucleotide sequences of H. virescens.

SD, standard deviation.
Alignment of combined datasets of cox1, cox2 and nad6 (2669 bp) contained sequences of 97 specimens from 11 sampled locations (table 2). The mean genetic distance among combined haplotypes was 0.001 (0–0.003).
In general, low nucleotide diversity (average-π=0.0706%, range: 0.0075–0.1540%) and high haplotype diversity (average-Ĥ=0.7907, range: 0.2–1.0) were observed in the sampled locations (table 3). Interestingly, in Chapadão do Sul, MS, the population sampled from soybean (MS10Gm) presented the lowest diversity indices (π=0.0075%; Ĥ=0.2), while that from cotton (MS08) showed the highest diversity values (π=0.0154%; Ĥ=1.0). Theta π (θπ) value was lower than the historical genetic diversity θW (θπ=0.00064; θW=0.00222), indicating population growth (Hamilton, Reference Hamilton2009).
Distribution of haplotypes and estimates of genetic diversity for H. virescens populations based on combined datasets of cox1, cox2 and nad6.

N hap, number of haplotypes found at each locality; Ĥ, haplotype diversity; π, nucleotide diversity (Nei, Reference Nei1987). SD, standard deviation.
The 97 combined mtDNA sequences were linked in a unique parsimony network (fig. 1b). The minimum spanning network method indicated 35 haplotypes, with 28 exclusive occurrences. The general topology of the network showed star-shaped structures with the most common haplotypes (1, 3, 5, 13 and 24) occupying a central position of these structures. The haplotype 1, representing approximately 53% (51/97) of the total sample, can be considered the ancestral haplotype. This haplotype was collected in all localities but Primavera do Leste, MT (MTP09), in which only haplotypes 24 and 25 occurred. Haplotypes 3, 5, 9, 13 and 24 represent together nearly 17% of the total sample and occur in two or three localities. Haplotype 3 is restricted to three populations from Luís Eduardo Magalhães, BA (BA08, BA10 and BA10Gm), haplotype 5 to the two populations from Goiás (GO08 and GO09) and haplotype 24 to populations from Mato Grosso do Sul (MS10Gm) and Mato Grosso (MTP09 and MT09). Haplotype 21 appeared in two individuals from Rio Verde, GO (GO09). The remaining 29 haplotypes were rare (single individuals) (table 3).
(a) Map of sampling areas of H. virescens specimens. (b) Minimum spanning network for H. virescens populations based on combined datasets of cox1, cox2 and nad6. Circle sizes are directly proportional to the number of individuals showing such haplotype. Small black circles indicate unsampled haplotypes. Each branch is equivalent to one base pair change. LEM, Luís Eduardo Magalhães. (c) Neighbor-joining distance tree estimated under p-distance model of nucleotide substitution. Numbers on branches indicate values of 1000 bootstrap replicates (when exceed 50%). Codes represent sampling localities of H. virescens populations, as detailed in table 1.

Non-hierarchical AMOVA among all populations and hierarchical analyzes among growing seasons and between crops for samples of H. virescens were non-significant. Then, data was grouped only by sampling localities, without considering year or crop. The hierarchical AMOVA revealed that 99.34% of the genetic variability was within localities, and the fixation index ΦST (Excoffier et al., Reference Excoffier, Smouse and Quattro1992) was non-significant.
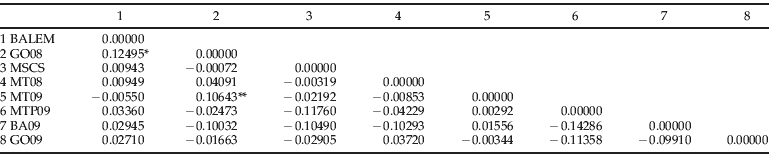
Slatkin's pairwise F ST (Slatkin, Reference Slatkin1995) between sampling localities were moderate and significant (F ST ∼0.13, P<0.05) only between the three samples from Luís Eduardo Magalhães, BA and Palmeiras, GO (BALEM and GO08) (table 4).
Slatkin´s linearized pairwise F ST (Slatkin, Reference Slatkin1995) between populations of H. virescens based on combined datasets of cox1, cox2 and nad6. Individuals are grouped by localities sampled two or three times during different growing seasons: BALEM=BA08+BA10+BA10Gm (samples from Luís Eduardo Magalhães, BA); MSCS=MS08+MS10Gm (samples from Chapadão do Sul, MS).
* P<0.05,
** P<0.1
The NJ tree based on the genetic p-distance (fig. 1c) and the PCA (fig. 2) did not show significant clustering due to geographical origin, year of sampling or host plant. Cumulative variations in the two principal coordinates obtained on the PCA were 61.97% and 79.63% for analyzes with individual samples and populations, respectively (fig. 2). PCA for population indicated the samples from soybean in Chapadão do Sul, MS (MS10Gm) as the most isolated from the main group (fig. 2a); however, this differentiation was diluted when the genetic distance between individual samples were used as input (fig. 2b).
Principal coordinate analysis of SNPs of combined datasets of cox1, cox2 and nad6 from H. virescens (a) populations and (b) individual samples. Codes represent sampling localities of H. virescens populations, as detailed in table 1.

Mismatch distribution analysis showed a unimodal pattern (fig. 3), indicating that H. virescens underwent a process of recent population expansion. This demographic expansion was also supported by the significant negative values of neutrality tests: Fu's F S=–27.52 (P<0.001) and Tajima's D=–2.29 (P<0.001). Moreover, the values of population size before (θ0=0.002) and after (θ1=2.455) the demographic expansion of the populations, the value of τ=4.133, besides the star-shaped haplotypes network, supported the pattern of recent demographic expansion. The change in the effective population size over time demonstrated by the Bayesian skyline plot analysis (fig. 4) coincided with a model of demographic expansion and implied that H. virescens has experienced a rapid population growth.
Mismatch distributions for all sampling localities for H. virescens populations based on combined datasets of cox1, cox2 and nad6 ( , observed; ——, expected;
 , 99% CI,
 , 95% CI,
 , 90% CI).

Bayesian skyline plot showing the effective population size fluctuation throughout time (solid line, median estimations; dotted lines, confidence intervals at 95% highest posterior density (HPD) limits of the effective population size). The x-axis is time in millions of years, and the y-axis represents the product of effective population size (N e) and generation time (τ) in years.

Discussion
Our data on the genetic variability of H. virescens from Brazil evaluated by mitochondrial markers indicated high haplotype and low nucleotide diversity in the total sample and within localities, but no significant genetic structure among the populations sampled in the major cotton and soybean cropping regions. The low genetic differentiation among samples of H. virescens associated with cotton or soybean crops from different geographic regions or growing seasons as indicated by clustering analyzes was similar to that reported for populations from USA and Mexico (Groot et al., Reference Groot, Classen, Inglis, Blanco, López, Vargas, Schal, Heckel and Schöfl2011). Low genetic structure has also been reported for other populations of H. virescens from different regions of the USA and Mexico, either by using mtDNA PCR-RFLP, allozymes or AFLP (Korman et al., Reference Korman, Mallet, Goodenough, Graves, Hayes, Hendricks, Luttrell, Pair and Wall1993; Roehrdanz et al., Reference Roehrdanz, Lopez, Loera and Hendricks1994; Han & Caprio, Reference Han and Caprio2004).
The low population structure inferred by mtDNA sequences found here can be due to different processes (Roehrdanz, Reference Roehrdanz1994). For example, a bottleneck event was followed by a population expansion from a small population in the recent evolutionary history of the species, or yet periodic annual population expansions from small populations, as a result of chemical control, which could reduce the population density and randomly eliminate entire mitochondrial lineages. The remaining individuals from these populations would then spread over all present geographical distribution of the species. Another possibility is the free actual exchange of migrants among populations of H. virescens, mainly among nearby populations. These scenarios are not mutually exclusive and may have contributed to the low genetic structure reported in this study.
There is no available information on the dispersal ability of H. virescens, and the hypothesis of free exchange of migrants sounds unlikely. The species is a facultative migratory crop pest with the ability to disperse at local and inter-regional scales, and migration seems to be related to local conditions of availability of oviposition sites and food supply (Farrow & Daly, Reference Farrow and Daly1987; Fitt, Reference Fitt1989). The adult dispersal ability enables the quick spread throughout the distribution range of their host plants (Farrow & Daly, Reference Farrow and Daly1987). As a polyphagous species, H. virescens could maintain resident populations feeding on any available host plant all year round in Brazil, and migratory events over long distances are unknown. In fact, a genetic structure signal would be expected due to geographic and genetic variation associated with host plant preference in H. virescens (Waldvogel & Gould, Reference Waldvogel and Gould1990), but this expectation was not fully confirmed by our data. Nonetheless, although H. virescens populations from Brazil do not demonstrate significant genetic structure, some haplotypes are exclusive of some regions. Haplotype 3, for example, is present only in Bahia (BA), haplotype 5 only in Goiás (GO), and haplotype 24 in Mato Grosso (MT) and Mato Grosso do Sul (MS), which suggests an incipient geographical isolation. It is worthy to note, however, that this pattern may also be recovered due to insufficient sampling.
Indeed, the alternative hypothesis of a recent event of demographic expansion is supported by our results, including the pattern of effective population size growth in the Bayesian skyline plot, the unimodal distribution of paired differences among mitochondrial sequences and the significant negative values of neutrality tests for the Tajima's D and Fu's F S parameters. Furthermore, the pattern of genetic variability observed in populations of H. virescens, as the high values of haplotype diversity and the low values of nucleotide diversity, combined with a high number of low frequency haplotypes, are characteristic of a species that has undergone a process of recent population expansion (Excoffier et al., Reference Excoffier, Foll and Petit2009). In addition, the star-shaped arrangement of the haplotypes network is typical of species that have undergone a recent demographic expansion, where interior haplotypes are expected to be ancestral whereas peripheral ones are expected to be derived (Crandall & Templeton, Reference Crandall and Templeton1993; Castelloe & Templeton, Reference Castelloe and Templeton1994). Population growth also relies on values of θπ<θW (Hamilton, Reference Hamilton2009), that is the difference between the current genetic diversity (θπ) based on pairwise differences between sequences and the historical genetic diversity (θW) based on the number of segregating sites among the sequences.
Extensive agriculture might have sped the demographic expansion of H. virescens, since its populations may switch to adjacent fields after every crop harvest, as hypothesized by Groot et al. (Reference Groot, Classen, Inglis, Blanco, López, Vargas, Schal, Heckel and Schöfl2011) for USA populations. For the Brazilian scenario, we can theorize that a very recent demographic expansion of H. virescens may have accompanied the development of the cotton-producing areas in Brazil. By the year 1990, the production of cotton in Brazil was concentrated mainly in the northeast, south and southeast regions. Cotton areas in Brazil had a marked growth by this time, coupled with the regional transfer of production from the Meridian regions towards midwest regions (mainly to Goiás, Mato Grosso and Mato Grosso do Sul states) and west of Bahia because of the favourable topography and the development of plants adapted to these regions (CONAB, 2009/2010).
Moreover, populations sampled from both cotton and soybean fields show unique haplotypes related to geographical occurrence, as evidenced by the haplotype network obtained with mtDNA sequences (fig. 1). Most frequent haplotypes are present in different localities in isolation. If low migration rates occur among these populations, this initial genetic isolation can lead to strongly structured populations.
This scenario can be more complicated due to the dynamic of appearance and disappearance of rare haplotypes within populations. Although unique haplotypes can be due to insufficient sampling, 29 out 35 haplotypes characterized here are unique occurrences, and all of them disappear in the next year from localities sampled for two consecutive years, as the three sampled sets from Luis Eduardo Magalhães, BA (BA08, BA10 and BA10Gm), and the two populations from Chapadão do Sul, MS (MS08 and MS09). This effect might be a consequence of the demographic population dynamic of a short-lived and semelparious species. Populations of insect pests are strongly subject to seasonal fluctuations. If collections are made at the maximum population size, even less frequent haplotypes may be sampled. Otherwise, if made at the lowest population level, it is very likely that only the most frequent haplotypes would be sampled, especially if the rare haplotypes are lost by chance. Consequently, population estimates and the delineation of genetic variation studies in seasonal populations should consider the time of year for sampling (Shpak et al., Reference Shpak, Wakeley, Garrigan and Lewontin2010).
Rare haplotypes might arise by new mutational events. Alternatively, these low frequency haplotypes might come from individuals leaving on wild host plants found nearby crop fields every season. This is especially true for a highly polyphagous species as H. virescens (Waldvogel & Gould, Reference Waldvogel and Gould1990). These rare haplotypes could be different for every sampled region, since each area present different natural vegetation associated to the Brazilian biomes: the Cerrado (a savannah-type vegetation), found in the states of Mato Grosso do Sul and Goiás, a transitional area between Cerrado and Caatinga (seasonal deciduous steppe savannah) in Bahia, and Amazon (open tropical rainforest, a transitional vegetation between the Amazon and the Cerrado) in Mato Grosso (Veloso et al., Reference Veloso, Rangel Filho and Lima1991; Werneck, Reference Werneck2011). Differential host plant preference might still have an additional effect on the migratory rate and in the spread of haplotypes between wild hosts and adjacent crops. If nearby wild host plants give a significant contribution to haplotype composition in populations attacking cultivated plants, it would be expected that most recent populations would present more haplotype variability than areas where crops are cultivated intensively for a longer period of time. Although this hypothesis is supported by samples taken from Chapadão do Sul, MS (MS08) (table 3), further studies on the haplotype diversity in wild hosts and on the landscape ecology in these areas are required.
Practical implications to IPM strategies
The characterization of the genetic structure of a species and the understanding of how populations are connected can help to define a management plan in which the resistance management programs may work for a particular pest (Scott et al., Reference Scott, Lawrence, Lange, Scott, Wilkinson, Merritt, Miles, Murray and Graham2005). Population structure and gene flow are also key aspects in the characterization of agronomically important species as they relate to the rate of evolution of insect resistance to insecticides and GM plants (Caprio & Tabashnik, Reference Caprio and Tabashnik1992; Alstad & Andow, Reference Alstad and Andow1995).
The success of the refuge strategy proposed to delay resistance to Bt-crops (Gould, Reference Gould1998) depends on the rate of dispersal and gene flow between refuges and transgenic fields, or between another source of susceptible individuals (alternative host plants and GM plants). For Brazilian H. virescens populations, soybean could serve as a large reservoir of susceptible individuals to potentially mate with resistant specimens developing from Bt-cotton. Our data on the lack of genetic structure among populations of H. virescens sampled from cotton- and soybean-producing areas support the hypothesis that specimens from these crops can mate at random.
However, care should be exercised. Soybean and cotton may be cultivated at the same region in Brazil (CONAB, 2009/2010), and the Bt-soybean, which also express the Cry1Ac protein found in Bt-cotton, was recently released for commercialization (CTNBio, 2011). Together, these events can unfavour the use of soybean as a source of susceptible specimens for the management of resistance in Bt-cotton. Besides, the presence of the same Bt-protein in both crops would favour the increase in the selection pressure and, consequently, the risks of resistance evolution (Caprio & Suckling, Reference Caprio and Suckling2000). Thus, the implementation of refuge areas for each one of these Bt-crops will be required in order to delay the development of resistance by reducing the likelihood that two resistant individuals will mate and produce offspring.
Our data suggest that the movement of H. virescens between cotton and soybean fields should be carefully considered within an agricultural region, as it would aid on designing strategies to manage resistance to Bt-crops and insecticides. Therefore, taking into consideration the landscape for soybean and cotton production in Brazil, the practices for managing resistance in H. virescens should be decided considering both crops.
Acknowledgements
We thank Conselho Nacional de Desenvolvimento Científico e Tecnológico (CNPq) (Process CNPq/MAPA 578509/2008-3) for providing financial support for this research and the doctoral scholarship to the senior author, Coordenação de Aperfeiçoamento de Pessoal de Nível Superior, CAPES for the postdoctoral fellowship to KLSB (PRODOC Process 0103/08-0), and Marcelo M. Brandão for helping with figures edition.



