Implications
Genome-wide association results are reported for the first time in Italian Duroc heavy pigs and provide useful information to dissect several important traits for dry-cured ham production (visible intermuscular fat, ham weight loss at first salting, backfat thickness, ham weight and lean cuts) and performance traits that are traditionally considered difficult to improve together. The identified quantitative trait loci included genes involved in fat deposition and adipocyte formation and muscle structure that have been previously reported for other traits in pigs. These results will improve our understanding of the biological mechanisms underlying these complex traits.
Introduction
The heavy pig production chain is a very important source of niche pork products particularly in Southern Europe. About 70% of Italian born pigs are raised for the production of Protected Designation of Origin (PDO) products, like Parma and San Daniele dry-cured hams, that, together with many other minor productions, reach a total economic value of more than 3 billion € per year (Qualivita-ISMEA, 2014). Protected Designation of Origin dry-cured hams are obtained from pigs that are slaughtered at about 160 kg of live weight when animals are at least 9 months old, according to dry-cured ham Consortia rules. Seasoning of the legs lasts at least 12 months during which the only addition of salt and the combined effects of controlled temperature and humidity in the processing plants act together to obtain the right dryness of the hams. This simple production technology cannot adjust intrinsic characteristics of the green (fresh) legs. Thus, it is fundamental that suitable raw materials (e.g. green legs) are supplied starting from a breeding program able to produce animals with the requested characteristics of the meat and legs.
For this reason, two important traits linked to the quality of the final products have been developed and are still considered in the selection programmes of Italian heavy pigs. These traits are visible intermuscular fat (VIF) and ham weight loss at first salting (HWLFS; Bosi and Russo, Reference Bosi and Russo2004). These traits are peculiar for dry-cured ham production and are measured/evaluated directly on the green ham itself, while other traits like backfat thickness (BFT), ham weight (HW) and lean cuts (LC), which are indicators of the overall fat/lean content of the animals, are measured on carcasses.
Visible intermuscular fat is a subjective evaluation of the level of fat deposition between leg muscles. This parameter uses a simplified classification method based on a three-class system, developed for routine application at the slaughterhouse that estimates the level of intermuscular fat in the hams (ANAS, 2016; Fontanesi et al., Reference Fontanesi, Schiavo, Galimberti, Bovo, Russo, Gallo and Buttazzoni2017a). The excess level of intermuscular fat is a defect that affects the acceptability of the hams by consumers and depreciates the final product. This defect is more common in Duroc lines (due to a higher content of intermuscular fat) than in other pig breeds or populations (i.e. Kouba and Sellier, Reference Kouba and Sellier2011). Despite the simplified and subjective methodology underlying VIF, a heritability estimate (~0.38; ANAS, 2016) supports the use of this parameter in the Total Merit Genetic Index for the Italian Duroc breed to reduce the intermuscular fat content of the hams (ANAS, 2016). This trait is only in part correlated to the intramuscular fat content (i.e. usually measured by extracting fat from muscle samples using chemical protocols), as VIF accounts for the morphological structure and infiltration of fat depots between muscles and not within muscles. Phenotypic and genetic correlations between intramuscular fat and intermuscular fat have been reported to be moderate (e.g. ranging from 0.20 to 0.40; reviewed in Kouba and Sellier, Reference Kouba and Sellier2011).
Ham weight loss at first salting (determined after 7 days in brine) is highly correlated with the total loss of weight of the hams up to the end of the seasoning period (Russo et al., Reference Russo, Nanni Costa, Lo Fiego and De Grossi1991; Buttazzoni et al., Reference Buttazzoni, Gallo, Baiocco and Carchedi1993). This trait is important in determining ham seasoning yields; thus, it is a very relevant parameter for the processing industry. Heritability estimates of this parameter have been reported to be moderate to high (0.30 to 0.61). This ensures HWLFS to be effectively used as criteria in selection plans aimed to improve meat quality for seasoning aptitude (Buttazzoni et al., Reference Buttazzoni, Gallo, Baiocco and Carchedi1993; Carnier et al., Reference Carnier, Cassandro, Knol and Padoan1999; ANAS, 2016). Ham weight loss at first salting is included in the Total Merit Genetic Index not only in the Italian Duroc but also in all other Italian heavy pig breeds (ANAS, 2016).
Together with HWLFS and VIF, BFT, HW and LC traits are also considered, because a balanced ratio of these traits is important for seasoning. As it also happens for fresh meat (Lonergan et al., Reference Lonergan, Huff-Lonergan, Rowe, Kuhlers and Jungst2001), pork quality for seasoning is affected when the carcass fat content lowers too much and lean content increases, so increasing the risk of the ham not satisfying customers. Moreover, carcass fatness level determines the classification of carcasses at slaughterhouse. The classification of the carcass in the central classes of a specific European grading system for pigs, is a prerequisite for determining the use of the legs for PDO hams (Disciplinare Generale e Dossier in accordance with the EC Rule no. 510/2006 of March, 20th 2006 of the Council). Estimated heritability for these parameters is high in this breed (0.55 for BFT, 0.51 for HW and 0.53 for LC). To dissect these traits at the genome level and identify the most important genetic factors affecting traits under selection in Italian Duroc pigs, we recently carried out candidate gene association studies that identified polymorphisms affecting a few of these parameters (e.g. Fontanesi et al., Reference Fontanesi, Bertolini, Scotti, Trevisi, Buttazzoni, Dall’Olio, Davoli, Bosi and Russo2012a).
In this work, we report, for the first time, genome-wide association study results in Italian Duroc heavy pigs. The study was conducted using two approaches, a window-based Bayesian analysis and single nucleotide polymorphism (SNP) linear mixed model (LMM) that were used to confirm quantitative trait loci (QTL) regions for VIF, HWLFS, BFT, HW and LC traits that are related to dry-cured ham and for average daily gain (ADG) and feed/gain ratio (FGR) that are important performance traits to improve efficiency. The results were useful in detecting novel QTL for these traits and to identify genes that are involved in biological mechanisms that affects seasoning, helping to clarify the genetic bases of dry-cured ham quality parameters and other important production traits in a breed that is specifically selected for the heavy pig production chain.
Material and methods
Animal and trait measurements
Pigs were not raised or treated in any way for the purpose of this study and for this reason no other ethical statement was needed. A total of 574 Italian Duroc pigs (452 entire gilts and 122 castrated males), born in the years 1997–2012 from 335 different litters and 181 different boars were included in this study. These pigs derived from triplets of siblings (two gilts and one castrated male) that were individually performance tested at the central genetic station of the National Pig Breeders Association (ANAS) for the sib-testing evaluation of a boar from the same litter (Fontanesi et al., Reference Fontanesi, Schiavo, Galimberti, Calò, Scotti, Martelli, Buttazzoni, Casadio and Russo2012b, Reference Fontanesi, Schiavo, Galimberti, Calò and Russo2014 and 2015).
At the beginning of the test, the animals were 30 to 45 days of age and were transported to the central genetic station, where they were fed quasi-ad libitum. Feed intake was recorded daily, BW was measured every 2 weeks, and then daily gain and FGR were calculated. Individual ADG were calculated by fixed regression on live weights measured every 15 days after fasting. The test ended when pigs reached 155±5 kg live weight and 9 months of age and were slaughtered in a commercial abattoir immediately after arriving at the slaughterhouse, through electrical stunning and bleeding in a lying position. Backfat thickness was measured on the carcasses at the level of Musculus gluteus medius and LC included the weight of neck and loin. More details on the measured traits and procedures are reported in Fontanesi et al. (Reference Fontanesi, Davoli, Nanni Costa, Beretti, Scotti, Tazzoli, Tassone, Colombo, Buttazzoni and Russo2008, Reference Fontanesi, Bertolini, Scotti, Trevisi, Buttazzoni, Dall’Olio, Davoli, Bosi and Russo2012a, Reference Fontanesi, Schiavo, Galimberti, Calò, Scotti, Martelli, Buttazzoni, Casadio and Russo2012b and Reference Fontanesi, Schiavo, Galimberti, Calò and Russo2014). Exposed muscles of the legs were scored for VIF at 24 h postmortem after trimming the hams at the slaughterhouse. Three classes of VIF were defined: 1=when muscles of neither legs from the same pig showed no intermuscular visible fat; 1.5=when muscles from only one leg showed VIF; 2=when muscles from both legs showed VIF (Fontanesi et al., Reference Fontanesi, Schiavo, Gallo, Baiocco, Galimberti, Bovo, Russo and Buttazzoni2017b). The evaluation was conducted by personnel after special training focused on the evaluation of this phenotype. Ham weight was measured on each leg at 24 h post mortem (after trimming) and then re-measured at the processing plant after 7 days in brine (first salting) and averaged across legs to calculate the raw value of weight loss at first salting (HWLFS; Fontanesi et al., Reference Fontanesi, Schiavo, Galimberti, Bovo, Russo, Gallo and Buttazzoni2017a). Ham weight loss at first salting discussed in this work derived from an averaged value across the two legs.
The use of estimated breeding values in association studies might give a high rate of false positives (Ekine et al., Reference Ekine, Rowe, Bishop and de Koning2014). For this reason, in this study, we used random residuals (RR) calculated for the seven investigated traits as trait scores. Random residuals have been previously shown to produce non-inflated results in association studies for several traits in pigs (e.g. Fontanesi et al., Reference Fontanesi, Bertolini, Scotti, Trevisi, Buttazzoni, Dall’Olio, Davoli, Bosi and Russo2012a). Random residuals were calculated using a fixed general linear model including fixed effects for sex, batch, date of slaughtering, age at slaughtering, VIF class (for HWLFS) and inbreeding coefficient.
Genotyping
Blood samples were collected at the abattoir after jugulation. Samples were dried or frozen at −20°C before DNA extraction carried out using standard protocols. Genotyping of all pigs was carried out using the Illumina PorcineSNP60 BeadChip (v.1 or v.2) (Illumina Co., St. Diego, CA, USA) following the manufacturer’s protocol. The assignment to the reference pig genome (Sscrofa11.1) was carried out as the assignment on the previous version v10.2 (Fontanesi et al., Reference Fontanesi, Schiavo, Galimberti, Calò, Scotti, Martelli, Buttazzoni, Casadio and Russo2012b and Reference Fontanesi, Schiavo, Galimberti, Calò and Russo2014). Genotyping data were filtered retaining SNPs with call rates >0.9, minimum allele frequency (MAF)>0.05, that did not deviate from Hardy–Weinberg equilibrium (considering a P>0.001), and chromosome mapped in the Sscrofa11.1 genome version excluding sexual chromosomes. After these SNP filtering steps, only animals with call rate >0.80 were used for the analyses and missing genotypes were imputed using the Beagle 3.3.2 software (https://faculty.washington.edu/browning/beagle/beagle_3.3.2_31Oct11.pdf).
Linear mixed model analyses
To assess the association between each SNP and the trait, the null hypothesis H 0 ; β=0 was tested. All models were fitted using GEMMA (Zhou and Stephens, Reference Zhou and Stephens2012), after computing K by the centered genomic matrix. Genomic inflation factors and quantile–quantile (Q–Q) plots were obtained (reported in Supplementary Material Figure S1). For each trait, SNPs were defined as associated based on the following two thresholds defined by the Wellcome Trust Case Control Consortium (2007) and by several other studies in livestock (e.g. Fontanesi et al., Reference Fontanesi, Schiavo, Galimberti, Calò, Scotti, Martelli, Buttazzoni, Casadio and Russo2012b; Sanchez et al., Reference Sanchez, Tribout, Iannuccelli, Bouffaud, Servin, Tenghe, Dehais, Muller, Del Schneider, Mercat, Rogel-Gaillard, Milan, Bidanel and Gilbert2014) to declare significant results in genome-wide studies for complex traits: P wald values<5.00E.05 and suggestive P wald values<5.00E.04.
Window-based Bayesian analyses
Bayesian analyses were performed with the GenSel software version 4 (Fernando and Garrick, Reference Fernando and Garrick2009) using a chain length of 51 000 iterations with the first 1000 cycles being discarded as burn-in. An output was created at every 50th iteration (Ponsuksili et al., Reference Ponsuksili, Reyer, Trakooljul, Murani and Wimmers2016). The proportion of SNPs that were considered as having no effect in a single iteration was set to π=0.993 to fit 200 to 250 SNPs per iteration of the Markov chain Monte Carlo sampling (Ponsuksili et al., Reference Ponsuksili, Reyer, Trakooljul, Murani and Wimmers2016). Because the estimation of RR for each trait already corrected for possible variables, no covariate of fixed effect was added in the model. For each trait, the Bayes C approach was first used to estimate additive genetic and residual variance components for each trait. Then, these values were used to run Bayes B models and estimate the window contributions to the genetic variance in non-overlapping 1-Mb windows using the window option implemented in the GenSel software. Windows with contributions equal or above the 1% of the total variance were retained. The gene search was performed only on windows detected with the Bayesian analyses that contained at least one significant or suggestive SNP from the LMM analyses. These regions were screened for annotated genes across the Sscrofa11.1 (GCA_000003025.6) available on NCBI (https://www.ncbi.nlm.nih.gov/).
Results
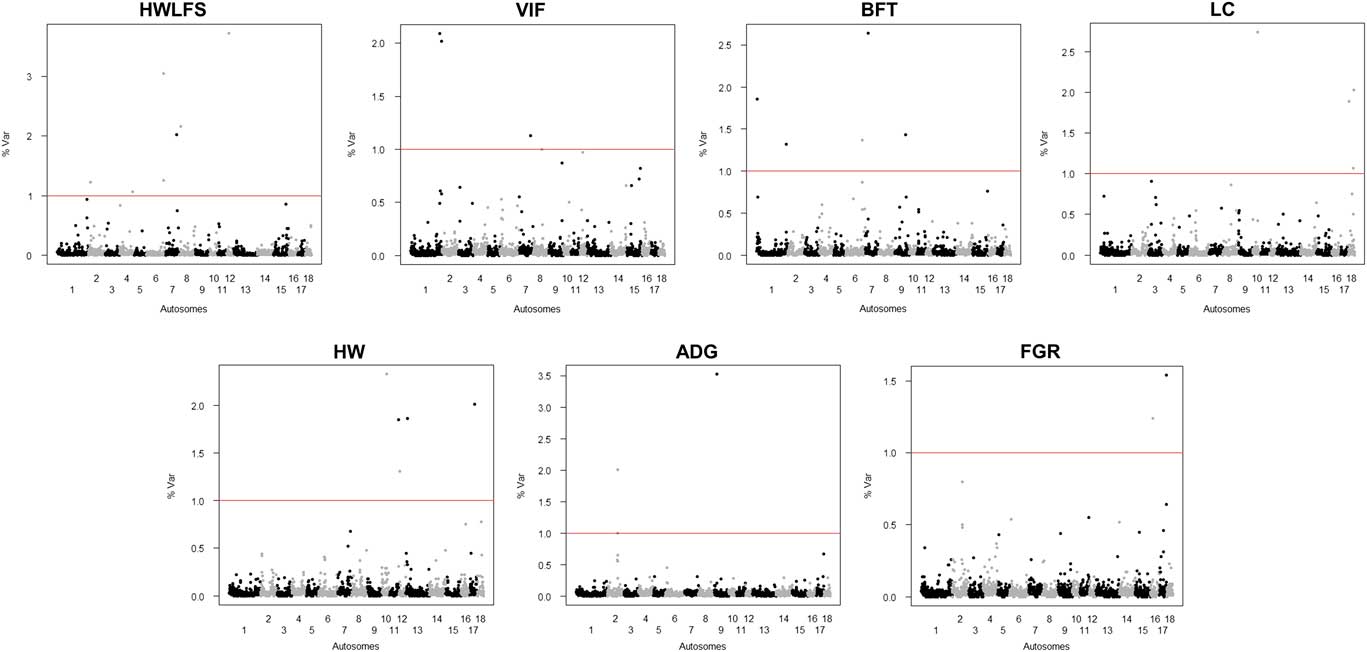
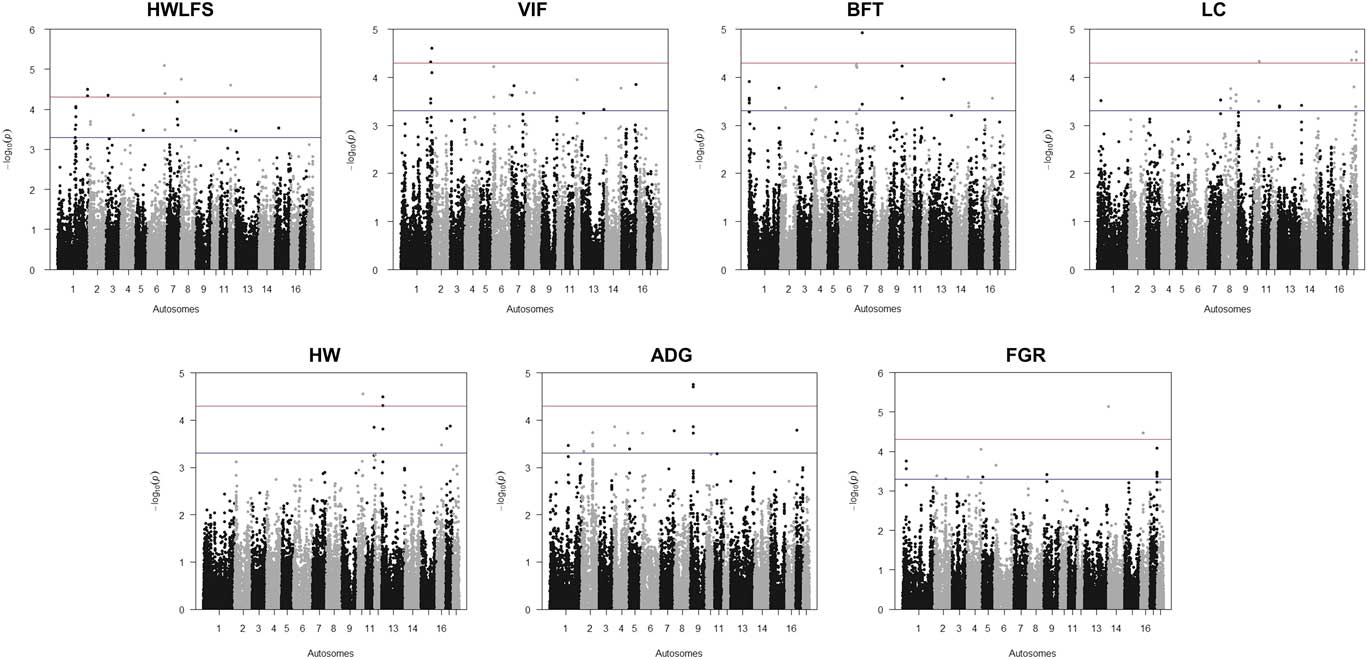
From a starting SNP set of 61 565, 52 034 SNPs were successfully and uniquely mapped on the Sscrofa11.1 genome version. Among these SNPs, after all other filtering steps a total of 33 101 SNPs were used for subsequent analyses. After animal DNA quality control, one animal was removed due to poor individual call rate, leaving 573 animals for the analyses. In Figure 1 and Supplementary Material Table S1 the results of the Bayesian analyses are shown for the seven traits, including data for 1 Mb windows or QTL that were above the 1% threshold. Several windows were above the threshold using the Bayesian approach for each trait, from a minimum of two for FGR to a maximum of seven for HWLFS. A Manhattan plot showing the results of the SNP (LMM analysis) for the seven considered traits is reported in Figure 2 and significant/suggestive SNPs are reported in Supplementary Material Table S2. Most of the windows detected were confirmed by the LMM analyses.
(color online) Manhattan plots showing the genome-wide association 1 Mb windows based on Bayesian B approach. For each plot, the horizontal line represents the 1% of explained variance threshold. HWLFS=ham weight loss at first salting; VIF=visible intermuscular fat; BFT=backfat thickness; LC=lean cuts; HW=ham weight; ADG=average daily gain; FGR=feed : gain ratio.

(color online) Manhattan plots showing the genome-wide association based on single marker linear mixed model analyses for the seven traits considered. For each plot, the upper horizontal line shows the suggestive threshold (P=5E-04), while the lower horizontal line shows the significant threshold (P=5E-05). HWLFS=ham weight loss at first salting; VIF=visible intermuscular fat; BFT=backfat thickness; LC=lean cuts; HW=ham weight; ADG=average daily gain; FGR=feed : gain ratio.

Dry-cured ham and heavy pig important traits
Ham weight loss at first salting
The Bayesian approach detected seven QTL that were also confirmed by the LMM analysis. The window explaining the highest percentage of variance (3.73%) was detected on porcine chromosome (SSC) 12 (18.03 to 18.94 Mb) and was confirmed by one SNP. Two windows that explained 3.05 and 1.25% of the variance, respectively were detected on SSC6 (151.13 to 151.99 Mb and 152.00 to 152.88 Mb) and were confirmed by one to two SNPs. The remaining windows were detected on SSC2 (15.07 to 15.84 Mb; 1.22%) confirmed by two SNPs, on SSC4 (111.01 to 111.99 Mb; 1.07%) confirmed by one SNP, on SSC7 (93.05 to 93.83 Mb; 2.02%) confirmed by two SNPs and on SSC8 (8.02 to 8.83 Mb; 2.16%) confirmed by two SNPs. A total of 79 genes were within the detected windows, 18 on SSC2, 11 on SSC4, nine within the two windows on SSC6, 9 on SSC7, one on SSC8 and 31 on SSC12 (Supplementary Material Table S3), including the VAV3 (vav guanine nucleotide exchange factor 3) gene on SSC4.
Visible intermuscular fat
A total of four QTL were detected for this trait. The window on SSC7 (99.14 to 99.99 Mb), was not confirmed by the LMM analysis, and therefore was not further considered. The QTL with the highest value were located on SSC1 (270.02 to 270.99 Mb and 257.05 to 257.93 Mb), explained ~2% of the total variance each, and were confirmed by five SNPs in total. The remaining window was located on SSC8 (76.01 to 76.97 Mb; 1%) and was confirmed by one SNP. A total of 20 genes were included in the three considered windows, 14 within the two windows on SSC1, including the tripartite motif containing 32 (TRIM32) and the far upstream element binding protein 3 (FUBP3) genes and six within the window on SSC8 (Supplementary Material Table S3).
Backfat thickness
Genome-wide association analysis for BFT identified five QTL, all confirmed by the LMM analysis. The window on SSC7 (26.00 to 26.98 Mb) explained the highest proportion of variance for this trait (2.64%) and was confirmed by one SNP. The other windows were detected on SSC1 (2.05 to 2.95 Mb and 263.02 to 263.78 Mb; 1.86% and 1.32%) were confirmed by six SNPs and by one SNP, respectively, on SSC6 (145.26 to 145.92 Mb; 1.37%) and on SSC9 (111.04 to 111.87 Mb; 1.43%). A total of 43 genes were detected, of which 28 were on the two regions of SSC1 that included the ribonuclease T2 (RNASET2) gene, 10 were on SSC6 (including the solute carrier family 35 member D1 (SLC35D1) gene and the SH3 domain GRB2-like endophilin interacting protein 1 (SGIP1) genes), four were on SSC7 that included the tubulointerstitial nephritis antigen (TINAG) gene and one gene was on SSC9 (Supplementary Material Table S3).
Lean cuts
A total of four windows were detected for the LC trait located on two chromosomes. The window located on SSC10 (44.04 to 44.78 Mb) explained the 2.74% of the total variance, was confirmed by one SNP and contained four genes, including the CACNB2 (calcium voltage-gated channel auxiliary subunit beta 2) gene. The other three QTL were in different part of SSC18 (10.03 to 10.96 Mb, 45.02 to 45.99 Mb and 48.01 to 48.98 Mb; 1.89%, 1.07% and 2.03%) confirmed by one SNP for the first two windows and by three SNPs for the last window. These windows contain 48 genes in total (Supplementary Material Table S3), including the tensin 3 (TNS3), serine/threonine kinase 31 (STK31) and phosphoglycerate mutase 2 (PGAM2) genes.
Ham weight
Four out of five windows were confirmed by LMM analyses. A window located on SSC10, had the highest value (44.04 to 44.78 Mb; 2.33%) and was confirmed by one SNP and was the only window that overlapped a window previously mentioned in the LC trait. Other windows were detected on SSC11, 13 and 17 (75.03 to 75.99 Mb, 13.04 to 13.97 Mb and 41.04 to 41.99 Mb; 1.85%, 1.86% and 2.01%), and confirmed by one to two SNPs. The window on SSC12 (7.05 to 7.98 Mb; 1.31%) did not overlap with any SNP of the LMM analysis. A total of 27 genes are annotated in these regions, including the calcium voltage-gated channel auxiliary subunit beta 2 gene (CACNB2) on SSC10.
Other production traits
The analysis for ADG identified two windows that included SNPs from the LMM analyses. The window with the highest percentage of variance was on SSC9 (23.10 to 23.98 Mb; 3.53%) and overlapped with four SNPs. The other window was located on SSC2 (96.00 to 96.84 Mb; 1% of the variance) and overlapped five SNPs. The window detected close to the previous one (SS2: 97.22 to 97.95 Mb; 2.01%) did not include any SNPs from the LMM analysis. For the FGR, two windows were detected on SSC16 and 17 (20.02 to 20.89 Mb and 60.02 to 60.98 Mb; 1.24% and 1.54% of the variance) and overlapped one and two SNPs respectively. The windows detected for these traits contained four and 10 genes for ADG and FGR, respectively (Supplementary Material Table S3). Among these genes, cysteine and histidine rich domain containing 1 (CHORDC1) in a region of SSC9 associated with ADG is discussed in more details.
Discussion
The dry-cured ham industry is an important source of income and production in several countries, where some efforts have been spent in dissecting the genetics of production traits related to seasoning (e.g. Stalder et al., Reference Stalder, Rothschild and Lonergan2005; Renaville et al., Reference Renaville, Piasentier, Fan, Vitale, Prandi and Rothschild2010). In this work, we report for the first time results of genome-wide association studies for several traits related to dry-cured ham production and other production traits in the Italian Duroc breed. This breed is constituted by a relatively small nucleus that has been under the Italian selection program since the beginning of the 1990s. The main general objective of this program has been the improvement of pigs to meet the needs of the Italian heavy pig industry mainly focused on the production of PDO dry-cured hams. The selection program of the Italian Duroc breed has defined the total genetic merit of the animals by including, in addition to performance and carcass traits (i.e. ADG, lean meat content and BFT), two ham quality traits (i.e. VIF and HWLFS) (ANAS, 2016). Estimated breeding values for other traits are also calculated (HW and FGR) but not included in the total genetic merit of the boars. The weights of the traits included in the selection index are chosen to counterbalance the negative correlations between quality traits and other production traits, ensuring some genetic progress for antagonistic multi-traits, that is, by definition, slower than a single trait-based selection program.
Therefore, the identification at the genome level of QTL affecting traits under selection could help to design and monitor tailored selection programs including this information, as genomic selection strategies are currently under evaluation also in Italian heavy pigs (Samorè et al., Reference Samorè, Buttazzoni, Gallo, Russo and Fontanesi2015). Both Bayesian and LMM approaches require data from a subset of a population for which phenotypes and genotypes are available and this might mean the possibility to appropriately use markers or genomic regions defining different weights according to the carried alleles at these loci. These simultaneous analyses and predictions could overcome, at least in part, negative correlations that could arise from closely linked loci having contrasting effects on the considered traits (e.g. Zhang et al., Reference Zhang, Ober, Erbe, Zhang, Gao, He, Li and Simianer2014). However, fine QTL mapping for each trait and the estimation of pleiotropic effects would be needed.
The traits that were used in the association studies had been developed for a routine recording system that needs to collect parameters that are cheap and simple to be measured but also effective in capturing genetic variability within the population under selection, as confirmed by the values of the heritability estimates (0.30 to 0.60; Buttazzoni et al., Reference Buttazzoni, Gallo, Baiocco and Carchedi1993; Carnier et al., Reference Carnier, Cassandro, Knol and Padoan1999; ANAS, 2016). Visible intermuscular fat is a simplified parameter that approximates the level of intermuscular fat (i.e. fat deposition between muscles) that could be more precisely measured by weighing trimmed fat in sliced muscle sections or by capturing with digital systems muscle images and determining fat areas or by other methodologies (i.e. Kouba and Sellier, Reference Kouba and Sellier2011). However, these are more expensive and difficult to be used in field conditions, where this phenotype can be recorded. Visible intermuscular fat estimates the level of intermuscular fat, that is the second most important fat depot in pigs (after subcutaneous fat depot) accounting for about 20% to 35% of the total fat deposition in an adult pig (Kouba and Sellier, Reference Kouba and Sellier2011). In Italian Duroc pigs, the selection process has aimed at first to lower and then to maintain the reached level of VIF, because its excess can hinder the final quality of dry-cured hams as well as the consumer’s acceptance of the final product. At present, this is the only Italian breed in which VIF is used in the evaluation of the total genetic merit of the animal. In Italian Large White, another important breed for dry-cured ham production, this trait is only used as a covariate in the model analyzing ham weight loss. Ham weight loss at first salting approximates the total weight loss at the end of the seasoning period. This parameter was developed to speed up the use of information that otherwise would need at least one additional year after slaughtering of the animals to be collected (Bosi and Russo, Reference Bosi and Russo2004).
The combination of two different approaches (Bayesian and LMM single SNP analyses) reduces the probability of detecting false positive results that could be derived by the method used to treat and elaborate data. All traits have already been corrected for inbreeding. This is probably the reason a high majority of the windows detected with the Bayesian analyses that does not account for genomic-related matrix have been confirmed by the detection of one or more SNPs with the LMM that requires instead the calculation of a genomic matrix. Particularly, 19 out of the 23 SNPs above the significant threshold were included in one window detected with the Bayesian approach. Moreover, the threshold of 1% of explained variance used in the Bayesian analyses is more stringent compared with other studies that used this type of window-based analysis (e.g. Ponsuksili et al., Reference Ponsuksili, Reyer, Trakooljul, Murani and Wimmers2016).
Overlapping windows within the analyzed traits
The simultaneous analyses of the major traits for dry-cured seasoning made it possible to identify at the same time what regions are associated with each trait and detect possible overlapping regions that may affect or enhance the consideration of these QTL for selection programs. This is important because the correlation among the dry-cured ham traits can be negative (e.g. LC and BFT). Despite the generally medium to high genetic and phenotypic correlations among these traits, no overlapping QTL were found in our analyses. This could be due to the limited power of the study. However, it is worth mentioning that these animals reflect in part the population structure of this nucleus and that they are pigs derived from a performance test program and therefore raised in a controlled environment. This may allow for a reduction in the number of animals needed to obtain meaningful association results. In general, these results may hint that it could be possible using the detected QTL for the improvement of specific traits without virtually affecting the other traits. Among the several identified QTL, only one on SSC10 at around 44 Mb was shared by LC and HW. In the Italian Duroc breed, LC and HW showed a genetic correlation of 0.77. This region contains several genes, including the CACNB2 gene. This gene encodes for a subunit that contributes to the function of the calcium channel by increasing peak calcium current, shifting the voltage dependencies of activation and inactivation, modulating G protein inhibition and controlling the alpha-1 subunit membrane targeting. This gene has been associated with Loin Marbling Score in a genome-wide analysis in Canadian Duroc pigs (Neustaeter et al., Reference Neustaeter, Grossi, Jafarikia, Sargolzaei and Schenkel2014).
Comparison with other genome-wide association studies in heavy pigs
There have been a few genome-wide association studies performed in Italian Large White using LMM analyses with ADG, VIF, HWLFS and BFT traits (Fontanesi et al., Reference Fontanesi, Schiavo, Galimberti, Calò and Russo2014, Reference Fontanesi, Schiavo, Galimberti, Bovo, Russo, Gallo and Buttazzoni2017a, Reference Fontanesi, Schiavo, Gallo, Baiocco, Galimberti, Bovo, Russo and Buttazzoni2017b and Reference Fontanesi, Schiavo, Galimberti, Calò, Scotti, Martelli, Buttazzoni, Casadio and Russo2012b). No overlapping QTL regions across the same traits were identified. It is worth noting that the analyses of BFT and ADG in Large White have been conducted selecting the extreme and divergent animals for that trait (selective genotyping approach), and therefore would have a binomial distribution rather than a normal distribution. This could have affected the number and type of QTL reported. Even though we should consider the possible limited power in detecting QTL by these studies, it seems clear that different QTL for these traits might segregate in different Italian heavy pig breeds. In any case, some QTL were overlapping across the traits. The QTL on SSC1 (257.05 to 257.92) detected for VIF, partially overlapped a QTL detected for ADG in Italian Large White (Fontanesi et al., Reference Fontanesi, Schiavo, Galimberti, Calò and Russo2014). This QTL contains the TRIM32 gene that encodes for a ligase involved in protein ubiquitination. TRIM32 was the closest gene to the ALGA0009614 SNP that was significantly associated to ADG in Italian large White heavy pigs (Fontanesi et al., Reference Fontanesi, Schiavo, Galimberti, Calò and Russo2014). Also, SLC35D1 on SSC6 detected for BFT was the closest gene to the DRGA0006951 SNP associated with ADG in Italian Large White pigs (Fontanesi et al., Reference Fontanesi, Schiavo, Galimberti, Calò and Russo2014).
Among the genes detected in the regions associated with LC, the QTL on SSC18 (48.00 to 48.98 Mb) contained three genes that have been associated to Italian Large White pig production traits and selection. The first is the PGAM2 gene that encodes the muscle subunit of the enzyme that catalyzes the interconversion of 2-phosphoglycerate and 3-phosphoglycerate in the glycolytic pathway. This gene has been associated with LC and HW in the Italian Large White breed (Fontanesi et al., Reference Fontanesi, Davoli, Nanni Costa, Beretti, Scotti, Tazzoli, Tassone, Colombo, Buttazzoni and Russo2008; Schiavo et al., Reference Schiavo, Galimberti, Calò, Samorè, Bertolini, Russo, Gallo, Buttazzoni and Fontanesi2016). The remaining two genes, TNS3 and STK31, have also been detected as under selection in the 20 years of breeding program in Italian Large White, even if they are not directly included in the genetic selection program (Schiavo et al., Reference Schiavo, Galimberti, Calò, Samorè, Bertolini, Russo, Gallo, Buttazzoni and Fontanesi2016).
Genes already related to production traits in other pig breeds
Among the genes located within the QTL detected for the seven traits, several have been associated with production traits in Duroc or other pig breeds. For example, the VAV3 gene, detected for HWLFS, has been associated with feed conversion ratio in Durocs (Wang et al., Reference Wang, Liu, Hernandez-Sanchez, Chen, Liu, Wu, Fang and Li2015). One of the genes within a QTL detected for VIF is FUBP3 (encoding for a transcription factor), a gene that has already been associated with daily gain, backfat, chest width, and circumference in a Duroc population and proposed as a candidate gene for skeletal formation (Sato et al., Reference Sato, Uemoto, Kikuchi, Egawa, Kohira, Saito, Sakuma, Miyashita, Arata, Kojima and Suzuki2016) and for loin eye area in a White Duroc×Erhualian F2 intercross population (He et al., Reference He, Ma, Zhang, Hou, Chen, Guo and Zhang2016).
Regions associated with BFT contain several genes already related to fat or other production traits in pigs. The TINAG gene codes for a glycoprotein that is mainly involved in nephrogenesis. A SNP within this gene (ALGA0039880) was associated in a genome-wide association analysis with rib fat in a Large White sire line. Duroc animals considered in the same analysis did not have this region associated with rib fat (Fowler et al., Reference Fowler, Pong-Wong, Bauer, Clemente, Reitter, Affara, Waite, Walling and Griffin2013). The RNASET2 gene, whose product regulates antioxidant tone and is required for physiological response to reactive oxygen species, has been significantly differentially expressed in liver, muscle, and adipose tissue under low and high residual feed intakes in Large White pigs (Gondret et al., Reference Gondret, Vincent, Houée-Bigot, Siegel, Lagarrigue, Causeur, Gilbert and Louveau2017). Therefore, RNASET2 may contribute to the general use of energy by pigs that may involve fat deposition. The SGIP1 gene, associated with BFT in our data set, encodes for a large proline-rich protein that is predominantly expressed in the brain, is involved in energy homeostasis (Trevaskis et al., Reference Trevaskis, Walder, Foletta, Kerr-Bayles, McMillan, Cooper, Lee, Bolton, Prior, Fahey, Whitecross, Morton, Schwartz and Collier2005) and was associated with fat mass in human (Cummings et al., Reference Cummings, Shields, Curran, Bozaoglu, Trevaskis, Gluschenko, Cai, Comuzzie, Dyer, Walder, Zimmet, Collier, Blangero and Jowett2012). This gene was already associated with BFT in Korean pigs (Lee et al., Reference Lee, Byun, Kang, Hwang, Park, Kim, Kim and Lee2012). Despite the lack of information about this gene in European pigs, our analysis agrees with what reported for Korean pigs, and considering the important biological function related to fat mass and energy metabolism in human, this make this gene a strong candidate for fat deposition in Italian Duroc pigs.
Conclusions
In this work, we report for the first time genome-wide association results obtained in the Italian Duroc breed for seven traits that are important for dry-cured ham quality and production (VIF, HWLFS, BFT, LC, HW, ADG, FGR). These traits are used in the genetic evaluation and/or are important for the Italian Duroc pig selection program. Despite the limits of these approximated phenotypes that are, however, cheap to collect, useful for routine evaluations and effective, considering their heritability, by using a combination of Bayesian analyses and linear mixed analyses, we localized 27 QTL windows for these traits with only one QTL overlapping between LC and HW on SSC10. Several regions contained genes that have been already associated with other production traits related to fat deposition or muscle structure in Duroc or other breed, providing a first description of the biological mechanisms affecting these traits and providing a global overview of the genomic regions linked to these traits. Other steps will be required to narrow these QTL and investigate the candidate genes identified in these regions in order to use additional information in the selection of heavy pigs. When little or no pleiotropic effect exists, gene assisted selection can be of particular use in enhancing selection for antagonistic traits, as it is the case for Italian heavy pigs. In the medium-term, the obtained information will be useful for developing a more accurate genomic selection program in the Italian Duroc breed including QTL information.
Acknowledgments
This work was funded by Italian MiPAAF Innovagen project and University of Bologna FARB project, Ensminger, State of Iowa and Hatch funding. This work is associated with the ANAS PSRN program.
Declaration of interest
The authors declare to have no conflicts of interest.
Ethics statement
All animals used in this study were kept according to the Italian and European legislations for pig production. All procedures described were in compliance with Italian and European Union regulations for animal care and slaughter.
Software and data repository resources
Data may be available upon request by contacting the corresponding author.
Supplementary material
To view supplementary material for this article, please visit https://doi.org/10.1017/S1751731118000757