1. INTRODUCTION
This paper's purpose is to present the concept of bathymetric data processing, which is especially useful in simplified comparative navigation – terrain (bottom) reference navigation and in production of precise bathymetric Electronic Navigational Charts (bENCs). In recent years, Unmanned Underwater Vehicles (UUVs), which are sometimes known as underwater drones or hydro drones, have become popular for hydrographic tasks and other underwater missions. These vehicles can operate underwater without a human occupant. They can be divided into two categories: Remotely Operated underwater Vehicles (ROVs), which are remotely controlled by a human operator, and Autonomous Underwater Vehicles (AUVs), which operate independent of direct human input.
One important problem associated with UUVs is precise vehicle positioning during movement in an underwater environment where the applicability of satellite navigation systems is limited by the need to place a receiver antenna over the water. Interactions with satellite positioning systems take place by at least partially surfacing the platform, which increases the risk of damaging or destroying it. It may be possible to position unmanned platforms that move in deep water using comparative navigation methods. In these methods, data gathered by onboard hydrographic systems is compared to data-rich bENCs that include important information about the seafloor morphology.
Several underwater positioning methods have been used in modern underwater navigation. Most are based on inertial sensors that provide underwater positioning during the short time between Global Navigation Satellite System (GNSS) position fixing and use of underwater acoustic transponders (contact points) placed on the bottom. Some AUVs use a more independent method: terrain navigation via digital terrain models. Terrain navigation runs on any sensor that provides bathymetric data. Wider, more comparative navigation methods also use other geodata such as sonar bottom coverage, magnetometry or gravity imaging. A comparative navigation system can be seen as an independent component of a navigation system whose primary function is to provide position measurement. In AUVs or submarines, position measurements can be integrated with an inertial navigation system just as they are integrated with GNSS. In other systems, they can integrate with a dead-reckoning system or serve as an independent source of position information.
Comparative navigation algorithms can be conceptually divided into global correlation finding algorithms (correlation methods) and tightly integrated terrain tracking algorithms. The accuracy of comparative navigation depends on the algorithmic characteristics, sensor accuracy, map accuracy and resolution and usefulness of the terrain. These navigation algorithms typically require heterogeneous terrain. If the terrain is flat, the algorithms can communicate only that the vehicle is over a flat area. In such cases, additional data is needed. This data can come from sonar (Dong et al., Reference Dong, Chou and Fang2017; Song et al., Reference Song, Bian and Zielinski2016; Wawrzyniak and Stateczny, Reference Wawrzyniak and Stateczny2017), magnetometers (Quintas et al., Reference Quintas, Teixeira and Pascoal2016; Wu and Yao, Reference Wu and Yao2015), gravimeters (Han et al., Reference Han, Wang, Deng and Fu2016; Menozzi et al., Reference Menozzi, Hansen, Peele, Snarski and Merrick2015; Wu et al., Reference Wu, Wang, Chai, Hsu and Wang2015; Zhu et al., Reference Zhu, Guo and Yang2016), or other systems (Jung et al., Reference Jung, Li, Choi and Myung2017; Ramesh et al., Reference Ramesh, Jyothi, Vedachalam, Ramadass and Atmanand2016; Wei et al., Reference Wei, Yuan and Zhe2015).
Terrain reference navigation has been analysed by many researchers and remains a subject of investigation. Multibeam echo sounder data is commonly used, but these systems can operate on any sensor that provides bathymetric data (Chen et al., Reference Chen, Li, Su, Chen and Jiang2015a; Reference Chen, Li, Su, Chen and Jiang2015b; Claus and Bachmayer, Reference Claus and Bachmayer2015; Hagen et al., Reference Hagen, Anonsen and Saebo2015; Li et al., Reference Li, Ma, Chen, Jiang, Wang and Zhang2017a; Reference Li, Ma, Wang, Chen, Shen and Jiang2017b; Reference Li, Wang, Chen and Zhang2017c; Salavasidis et al., Reference Salavasidis, Harris, McPhail and Phillips2016; Stuntz et al., Reference Stuntz, Kelly and Smith2016; Wang et al., Reference Wang, Yu and Zhu2015; Zhang et al., Reference Zhang, Xu and Xu2015; Zhou et al., Reference Zhou, Cheng, Zhu and Lu2015; Reference Zhou, Cheng and Zhu2016; Reference Zhou, Cheng, Zhu, Dai and Fu2017).
With regard to Autonomous Surface Vehicles (ASVs), comparative navigation methods might be used as autonomous GNSS positioning alternatives or in areas where GNSS positioning is not possible such as under bridges or in areas covered by trees on narrow rivers and canals.
The challenge with modern hydrographic systems is the large size of datasets collected. Reduction and filtering are essential components of data processing before data is presented to users. For example, for the purpose of navigation safety, users need to visualise the shallowest depths in true positions with a spacing dependent on the display scale. Reduction of bathymetric geodata with a focus on minimum depth has been described in previous articles (Wlodarczyk-Sielicka and Stateczny, Reference Wlodarczyk-Sielicka and Stateczny2015; Wlodarczyk-Sielicka et al., Reference Wlodarczyk-Sielicka, Lubczonek and Stateczny2016).
Several researchers have examined aspects of Electronic Navigational Charts (ENC) production planning and navigational data evaluation (Hyla et al., Reference Hyla, Wawrzyniak and Kazimierski2015; Kazimierski and Wlodarczyk-Sielicka, Reference Kazimierski and Wlodarczyk-Sielicka2016; Lubczonek, Reference Lubczonek2016; Lubczonek and Borawski, Reference Lubczonek and Borawski2016).
Bathymetric data is typically gathered using a Multi-Beam Echosounder (MBES). Processing of bathymetric data has been discussed by Maleika (Reference Maleika2015a; Reference Maleika2015b). Some researchers have attempted to collect bathymetric data using ASVs and Single Beam Echosounders (SBESs) (Specht et al., Reference Specht, Weintrit and Specht2016; Reference Specht, Switalski and Specht2017), however the resulting data is less dense than is desired for bENC production.
2. BATHYMETRIC DATA PROCESSING
In bathymetric data post-processing, the size of a data set is reduced, with a focus on shallowest depth, in order to make analysis easier and more effective. It is generally accepted that acquiring depth contours every 10 cm can fulfil comparative navigation positioning accuracy requirements. In this work, post-processing was performed using Hypack Max and Hysweep version 2017a software. This software is useful in data acquisition and processing. Another software system produced by Caris and SevenCs in different versions was used only for bENC verification.
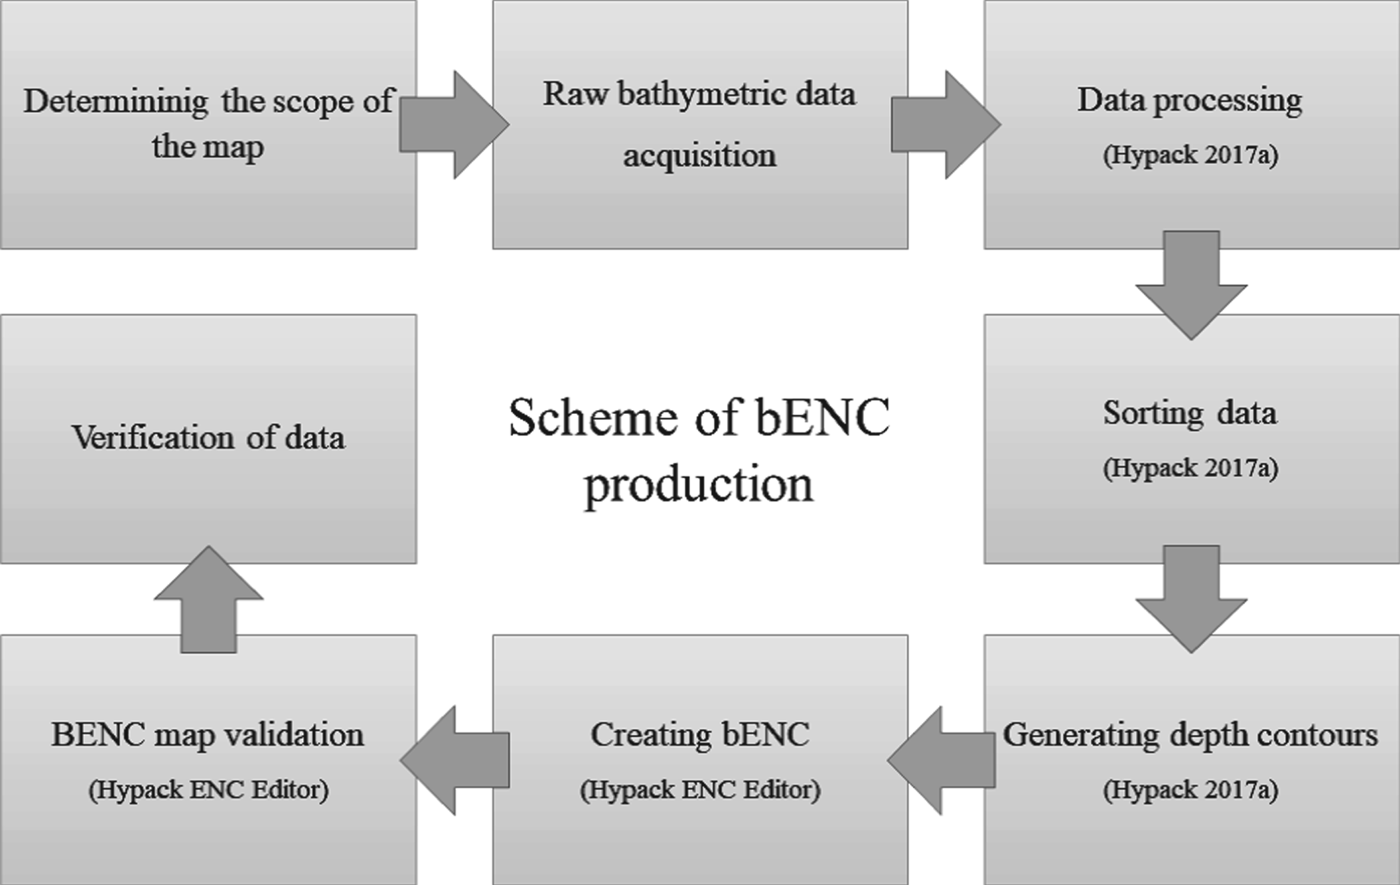
The bENC production algorithm starts with precise bathymetric data acquisition via MBES with Global Positioning System (GPS) Real Time Kinematic (RTK) positioning. Precise, accurate data is important to the goal of producing bENCs with depth contours — isobaths every 10 cm that are converted to depth information and used in charts. Raw MBES data contains spikes and other errors that should be carefully removed. After the cleaning process, the data was sorted, and the target density was isolated. In the next step, depth areas (areas of constant depth used to generate safety contours) were generated from the depth contours created during the previous step. These were used to generate the bENCs using ENC Editor from Hypack Max. Hypack Max was used to perform validation and determine the bENCs. Finally, verification and validation were performed using the Caris and SevenCs software. The purpose of this was to confirm that the product was properly recognised by all standard software commonly used by national hydrographic offices. A scheme of the bENC production process performed using Hypack software is shown in Figure 1.
Algorithm for bENC production based on Hypack Max and Hysweep.

3. RAW BATHYMETRIC DATA QUALITY
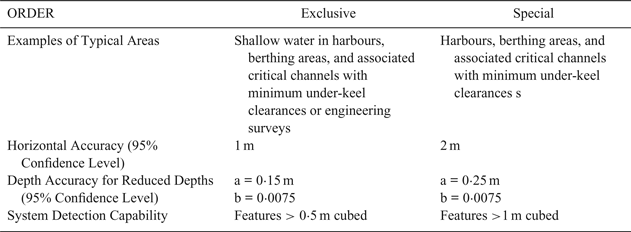
Precise plan and chart production requires use of the most accurate data available. International Hydrographic Organization (IHO) standard S-44 imposes low depth information requirements, which are insufficient for bENC production. This is true even of the version designed for “Special Orders” intended for harbours, berthing areas, and associated critical channels with minimal under-keel clearances. In 2013, the Canadian Hydrographic Service introduced more restrictive requirements, referred to as “Exclusive Orders”, for engineering surveys and shallow water in harbours, berthing areas and associated critical channels with minimal under-keel clearances (Canadian Hydrographic Service, 2013). Exclusive Order hydrographic surveys are based on the IHO Special Order system but require higher accuracy. Their use is intended to be restricted to shallow water areas (harbours, berthing areas, and critical channels) with optimal use of the water column and where specific critical areas with minimal under-keel clearances and bottom characteristics are potentially hazardous to vessels. Exclusive Order standards also apply to high-precision engineering surveys. All error sources must be minimised. Exclusive Orders require highly precise positioning systems, closely spaced lines (when target detection is required) and rigorous control of all aspects of the surveys (Canadian Hydrographic Service, 2013). Table 1 presents Standards for Exclusive and Special Order Hydrographic Surveys.
Compare Exclusive and Special Order Standards for Hydrographic Surveys (Canadian Hydrographic Service, 2013).

To calculate the depth accuracy error limits, the corresponding a and b values listed in Table 1 must be introduced into the formula below (Canadian Hydrographic Service, 2013):
 $$\pm \surd \lsqb a^{2}+\lpar \hbox{b x d}\rpar ^{2}\rsqb $$
where a is the constant depth error (that is, the sum of all constant errors in metres); b x d is the depth dependent error (that is, the sum of all depth dependent errors); b is the depth dependent error factor and d is the depth in metres.
4. HARDWARE QUALITY CONDITIONS FOR BATYHYMETRIC DATA GATHERING
Even the more restrictive Exclusive Standard introduced by the Canadian Hydrographic Service is insufficient for bENC production. Both horizontal and vertical accuracy should be 5 cm in order to produce precise isobaths every 10 cm. To fulfil such high hydrographic survey requirements, sophisticated MBES hydrographic equipment with external Inertial Navigation System (INS) sensors was introduced during a research project “Development of autonomous/remote operated surface platform dedicated hydrographic measurements on restricted reservoirs” supported by the National Centre for Research and Development (NCBiR) of Poland (http://www.marinetechnology.pl/hydrodron.html).
The goal of the project was to develop an autonomous/remote-controlled multitasking water-based platform for implementation of hydrographic survey missions around ports, estuaries, anchorages, bays and lakes, rivers and other restricted areas. The platform was intended to perform hydrographic survey missions using bathymetry, sonar and other measurements in both autonomous modes that use planned trajectories and in remote control modes. It was designed specifically to operate in navigationally difficult situations. The project included six sections that comprise the overall process of implementation and platform validation, from requirement definition to specific projects: sensor deployment, hull structure, software, navigation systems, propulsion modules and sensor integration. These sections encompass platform construction and validation, as well as development of the applicable exploitation methodology. The autonomous multi-purpose floating platform named HydroDron was developed within the framework of the project. It is equipped with Ping DSP 3DSS 450 Swath Bathymetry Three-Dimensional (3D) Sidescan technology, a SBG EKINOX2-U-G4A2-EL external inertial navigation system and an AML Micro-X SV sound velocity sensor. In addition, an AML BaseX2 sound velocity profiler with Wi-Fi was used. The hydrographic equipment was connected to a Getac s410 semi-ruggedised high-performance laptop computer with Hypack Max and Hysweep. In addition, a Trimble R10 receiver was used to secure RTK corrections in difficult areas.
All of the hardware specifications exceeded Exclusive Order requirements. During a series of experiments, all devices were precisely calibrated and tested. RTK correction during registration was downloaded from the Trimble service. The complete measurement system was used by the team of authors to obtain bathymetric data for the experimental production of bENC.
5. EXPERIMENT
Raw data from a survey of the area around the Port of Gdansk in Poland was used to verify the bENC production algorithm. The following figures include bathymetric data post-processing results. The data positions are given in the Universal Transverse Mercator (UTM) coordinate system, an international locational reference system. The procedure for processing the measurement data consisted of a sequence of three successive stages. First, data was sorted and reduced to collect bathymetric points, the isobath was generated on the base of TIN model and finally the bENC was created. The steps are described below.
5.1. Sorting and reduction of depth points
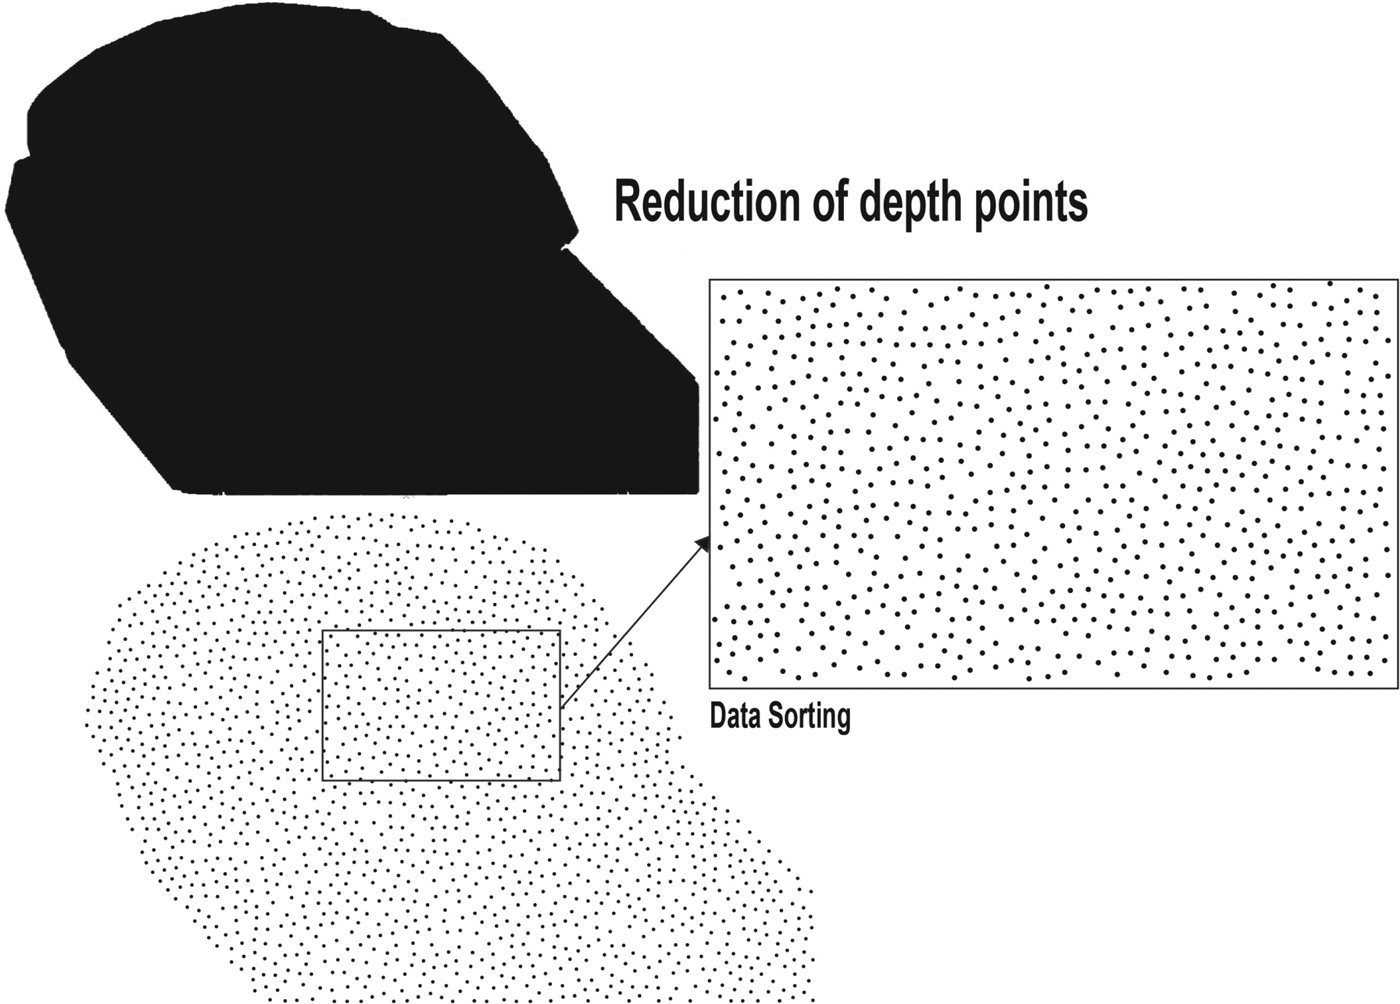
The first step in data processing was point reduction. The points must be reduced in such a way as to permit the visual reading of the individual depths on the scale of the map. The digits marking the individual depths must not overlap. The results are presented in Figure 2. After point reduction, selected depth points were chosen for presentation to the bENC. The reduction algorithm implemented in the Hypack system was used.
The process of depth points selection.

5.2. Generation of depth contours
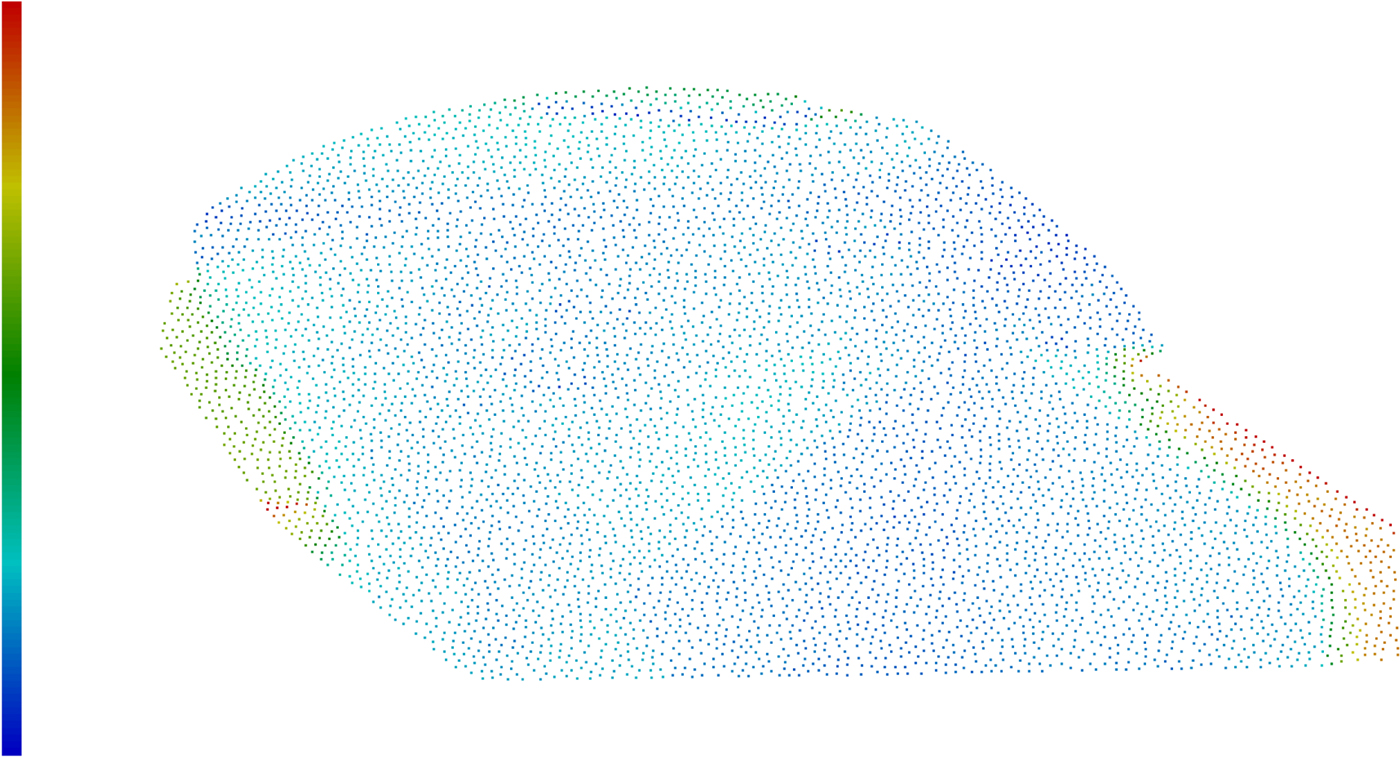
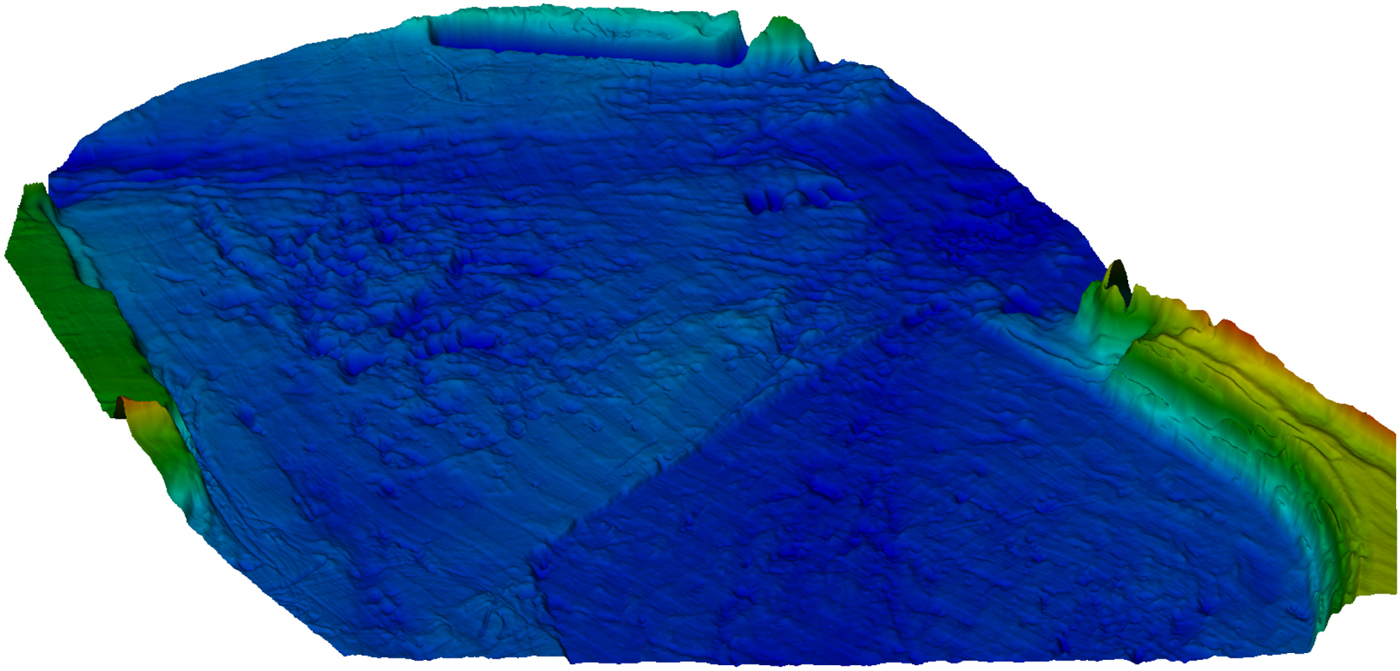
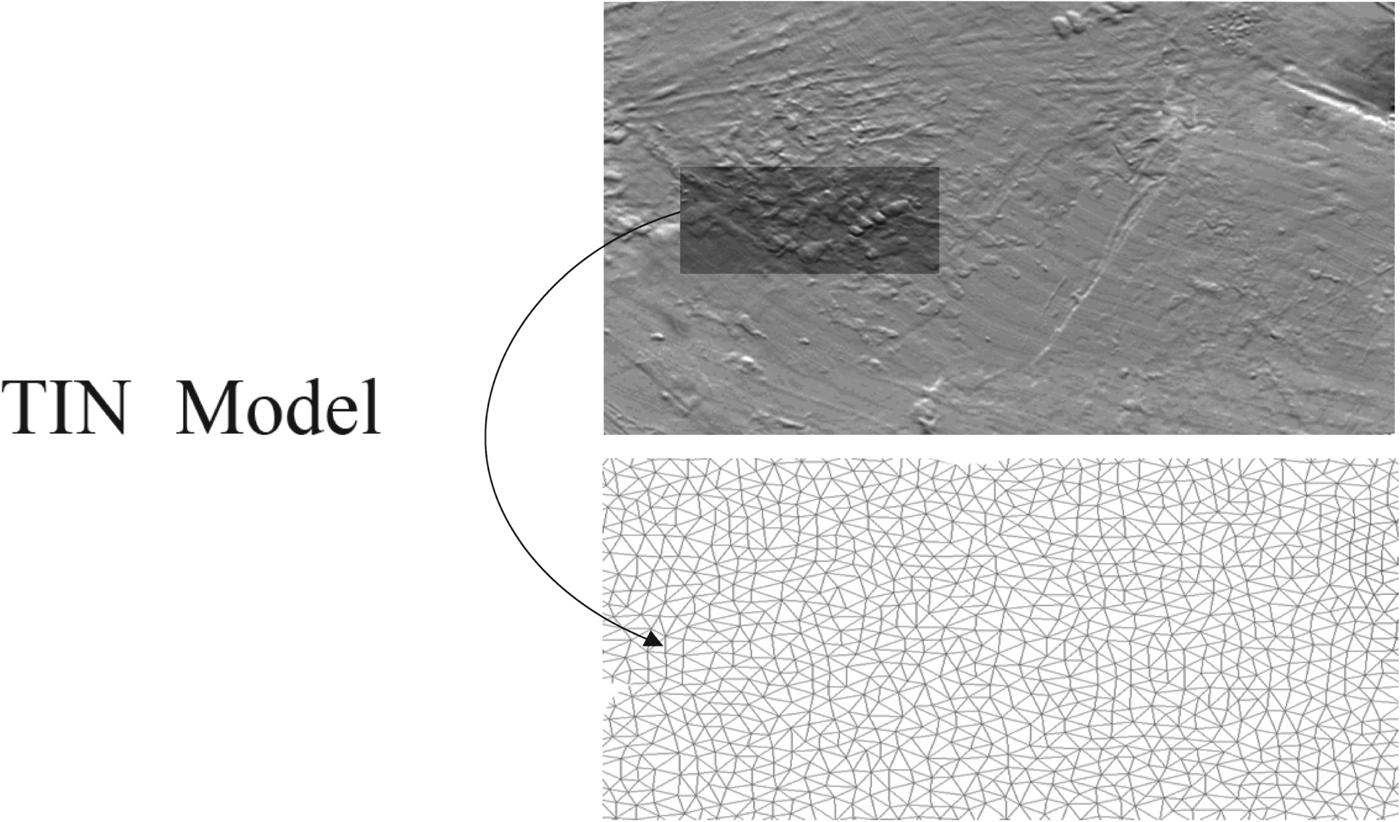
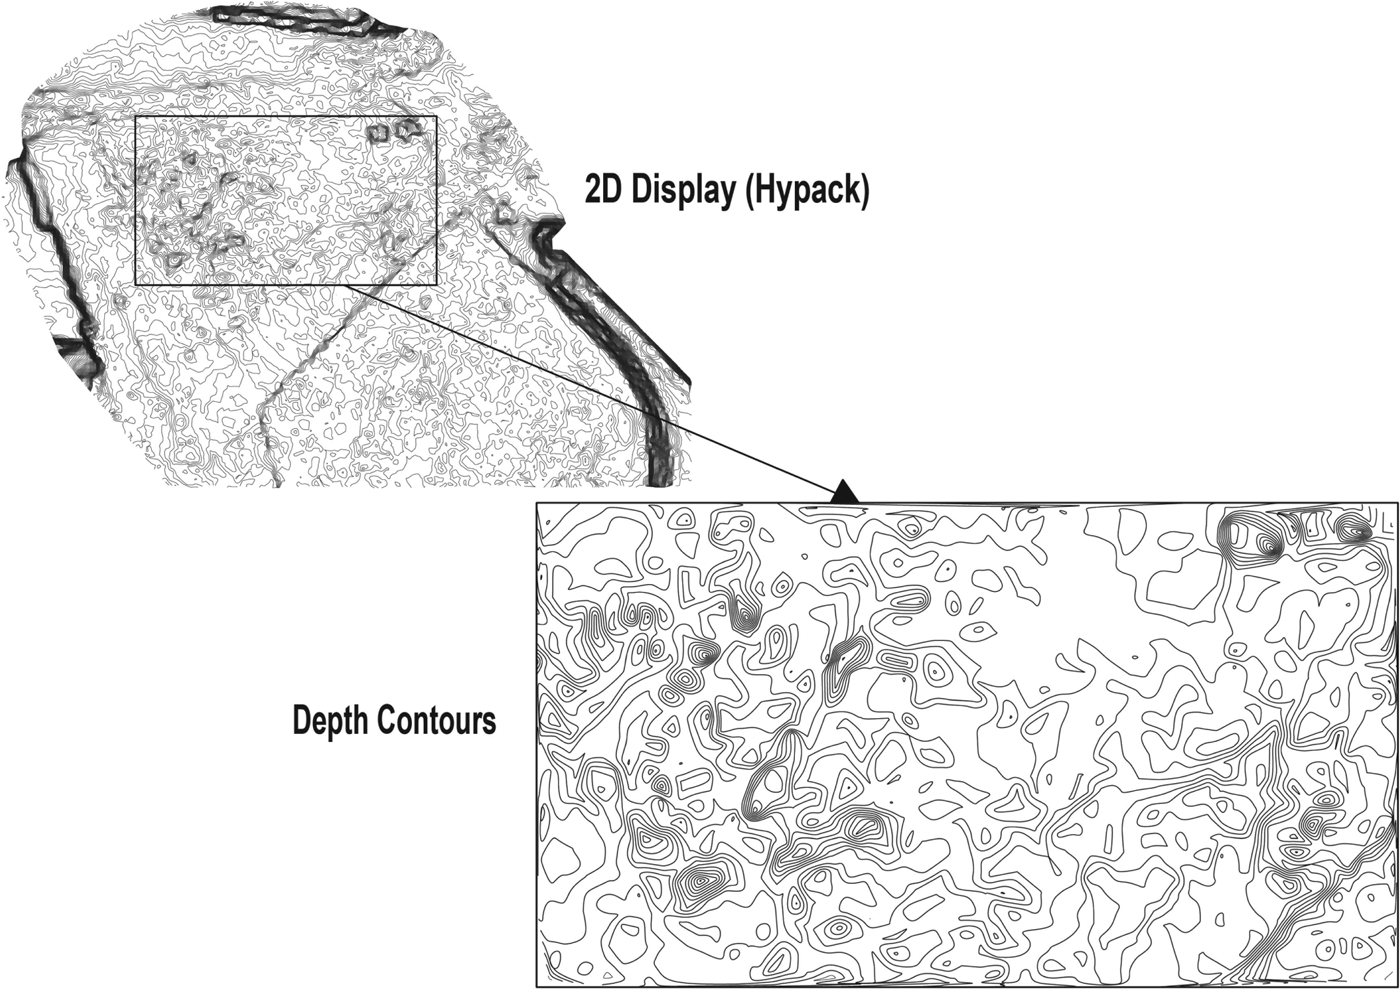
The second step in data processing was generation of depth contours from clouds of points. A cloud of points is presented in Figure 3 and its 3D visualisation is shown in Figure 4. Depth points are required to improve map readability but are not required for comparative (terrain reference) navigation. Depth areas are required for this task. To calculate the depth contours, first a Triangulated Irregular Network (TIN) model is produced from a reduced cloud of points. The TIN model is presented in Figure 5. Based on the TIN model, depth contours are calculated and generated every 10 cm. The result of the depth contour calculation is presented in Figure 6.
The picture presents cloud of points taken from Hypack 3D display of testing area.

3D visualisation of cloud of points of testing area.

Generation of Triangulated Irregular Network (TIN) from cloud of points.

Depth contour generated from the TIN every 10 cm.

5.3. bENC creation procedure
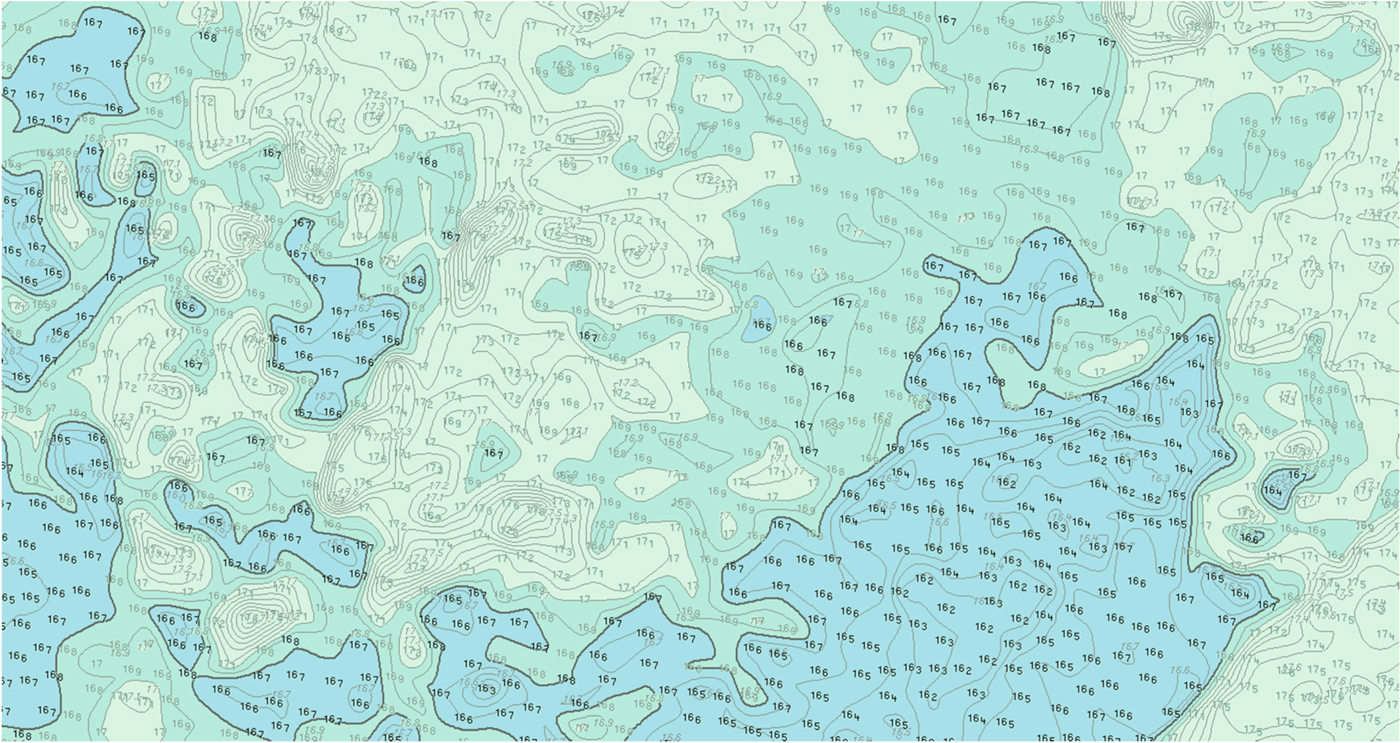
Depth contours can be included in the bENC, but it is better to include depth areas converted from depth contours. Depth contours are isolines and cannot be used to calculate safety contours. Depth areas should be used instead. They are also, as mentioned earlier, necessary for the non-GPS comparative navigation process. Figure 7 shows depth area and depth point results used to calculate the bENC of the test area.
Part of bENC made for area of experiment (SeeMyENC SevenCs software was used for chart visualisation).

Such precise bENCs of areas described in Exclusive or Special Orders could be useful for precise underwater vehicle navigation and other tasks where precise bottom shape information is needed.
6. CONCLUSIONS
Detailed knowledge of bathymetry is increasingly important for navigation safety, given the ever-decreasing safety margins for both surface and underwater operations. The density of data available in Bathymetric ENCs makes them appealing for navigation in confined waters, where under keel clearance is a critical element to consider. Comparative navigation methods based on terrain-depth information are attractive alternatives to GNSS positioning. They might also provide one of the few solutions, apart from dead-reckoning systems, for underwater vehicle navigation.
ACKNOWLEDGEMENTS
The results presented were financed from the European Regional Development Fund under the 2014–2020 Operational Programme Smart Growth. Project entitled “Developing of autonomous/remote operated surface platform dedicated hydrographic measurements on restricted reservoirs” implemented as part of the National Centre for Research and Development competition: INNOSBZ.