





Introduction
U.S. agriculture faces a critical economic paradox. Diversified cropping systems offer documented environmental benefits and enhanced resilience to climate variability (Hertel et al., Reference Hertel, Elouafi, Tanticharoen and Ewert2021; Teng et al., Reference Teng, Hou, Dungait, Zhou, Kuzyakov, Zhang, Tian, Cui, Zhang and Delgado-Baquerizo2024), yet their adoption remains limited. Despite widespread recognition of diversification’s agronomic advantages, including improved soil health, biodiversity conservation, and climate adaptation, farmers perceive substantial economic risks in transitioning from commodity-focused systems (Traldi et al., Reference Traldi, Asprooth, Usher, Floress, Arbuckle, Baskerville, Church, Genskow, Harden, Maynard, Thompson, Torres and Prokopy2024). These risks center on three interrelated forms of market uncertainty. First, farmers face demand uncertainty: it is unclear whether buyers exist for the specialty crops that diversified systems produce. Second, they face price uncertainty: even where buyers exist, it is unclear whether they will pay premiums sufficient to offset the transaction costs, learning investments, and forgone economies of scale associated with departing from monoculture systems. Third, they face market-access uncertainty: established buyer relationships, processing infrastructure, and distribution networks are often thinner for diversified specialty crops than for commodity crops. These uncertainties arise from a common source: information asymmetries in downstream markets, where farmers lack clear signals about whether diversified production will be economically rewarded (Roesch-McNally, Arbuckle and Tyndall, Reference Roesch-McNally, Arbuckle and Tyndall2018). This reluctance therefore stems not only from production constraints but from the structure of the markets that diversified farmers must navigate.
Resolving this coordination problem depends critically on the role of intermediary buyers. We use the term intermediary buyers to refer to midstream actors that purchase agricultural products from farmers for resale or transformation rather than final consumption (principally wholesalers and restaurants in our study) following recent work directing attention to the ‘hidden middle’ of agri-food supply chains (Reardon, Reference Reardon2015; Grabs et al., Reference Grabs, Carodenuto, Jespersen, Adams, Camacho, Celi, Chandra, Dufour, Zu Ermgassen, Garrett and Lyons-White2024). These actors are defined by their structural position between producers and final consumers, which distinguishes their procurement behavior from end-consumer purchasing: they buy as professional agents on behalf of downstream demand, not for personal use.
Because these buyers occupy the position between farmers and final consumers, they aggregate and transmit demand signals upstream: their procurement criteria determine which production attributes enter the supply chain and which farming practices are economically rewarded (Roy and Ballantine, Reference Roy and Ballantine2020). This intermediary position makes their procurement decisions pivotal to diversification outcomes. When intermediaries reward attributes associated with diversified production through price premiums or reliable purchase commitments, they translate otherwise diffuse consumer interest into concrete, farm-level incentives that can offset the transaction costs and risks of diversifying. Conversely, when intermediaries treat diversified products as undifferentiated commodities, consumer demand for sustainably produced foods may never reach producers as an actionable signal, and the coordination failure persists regardless of underlying consumer preferences. Intermediary procurement behavior thus functions as a transmission mechanism that can either close or perpetuate the information gap between diversified farmers and the markets they seek to access.
In response to growing consumer demand for environmentally and ethically produced foods, many intermediaries increasingly rely on food labels, both third-party certified and non-certified, as screening mechanisms to guide procurement decisions (Wang, Tao and Chu, Reference Wang, Tao and Chu2020; Velasco et al., Reference Velasco, Marques, Torres, Marshall and Deering2024). From an economic perspective, production methods, sustainability practices, and product origin constitute credence attributes: qualities buyers cannot verify even after purchase (Darby and Karni, Reference Darby and Karni1973). Labels function as signaling mechanisms that convey these otherwise unobservable characteristics, reducing the information gap between producers and buyers. However, the proliferation of diverse labeling schemes creates a complex signaling environment where buyers may interpret and value labels heterogeneously. This heterogeneity has important implications: if buyer preferences for labels are systematically related to sourcing behaviors, then understanding this relationship becomes essential for farmers seeking to differentiate products, access premium markets, and justify the investment required for diversification.
Despite the central role of intermediary buyers in agricultural supply chains, existing research has focused predominantly on end-consumer responses to food labels, leaving a critical gap in understanding how business-to-business (B2B) procurement decisions are influenced by labeling preferences. Little is known about whether distinct buyer segments exist based on label valuation, how these segments differ in their operational characteristics and sourcing strategies, or whether label preferences predict procurement from diversified farming operations. Addressing this gap is essential for designing targeted market development strategies and for understanding the market-level barriers that constrain U.S. agricultural diversification at scale.
This study examines how food label preferences segment the market for fresh specialty crops and shape procurement behavior among U.S. wholesalers and restaurants. Using survey data from 378 purchasing managers, we apply principal component analysis (PCA) to identify underlying dimensions of buyer attitudes toward 15 certified and non-certified food labels, followed by cluster analysis to segment buyers into distinct market groups. We then analyze how these segments differ in their sourcing practices, operational characteristics, willingness to purchase from diversified farms, and expectations for future demand.
Our analysis yields three key findings. First, buyer preferences for food labels reflect two distinct value dimensions: Practice-Based Labels emphasizing specific production attributes and transparency, and Credence-Based Labels prioritizing third-party verification and standardized certifications. Second, these dimensions define three distinct buyer segments: Label Advocates (27%), Market-Driven Buyers (34%), and Skeptics (39%). Each of these segments exhibits systematically different procurement behaviors and engagement with diversified farms. Third, buyers who value labels, particularly Label Advocates, are significantly more likely to source from diversified operations and perceive greater market opportunities for these products, suggesting that labeling preferences serve as a meaningful predictor of market access for specialty crop producers.
Our findings contribute to the literature in several ways. Theoretically, we extend credence goods theory to the B2B context to demonstrate how label-based signaling mechanisms operate among buyers. Empirically, we provide a systematic segmentation of specialty crop buyers based on label preferences. Lastly, our results suggest specific strategies for farmers, supply chain actors, and policymakers seeking to strengthen market linkages for diversified agriculture. By identifying which buyers value which labels and how these preferences relate to actual sourcing decisions, this research provides empirical evidence for market-based strategies to support product portfolio diversification and enhance economic resilience of U.S. farming systems.
Literature review
Information asymmetry and credence attributes in agricultural markets
Agricultural markets face a fundamental coordination problem: buyers cannot directly observe many product attributes even after purchase. Production methods, environmental impacts, and labor practices represent credence attributes, which are qualities that remain unverifiable to buyers under normal market conditions (Darby and Karni, Reference Darby and Karni1973). These market information gaps create potential market failures where high-quality or sustainably produced goods cannot command price premiums because buyers lack reliable mechanisms to distinguish them from conventional alternatives.
Food labels, both third-party certified and non-certified, have emerged as market responses to these information problems. Labels function as signaling devices that convey otherwise unobservable product characteristics, reducing search costs and enabling market differentiation (Velasco et al., Reference Velasco, Marques, Torres, Marshall and Deering2024). From a transaction cost perspective, labels lower the costs of verifying product claims, potentially expanding markets for specialty and sustainably produced agricultural products (Jia et al., Reference Jia, Li, Jin and Zhang2023). For producers, particularly those operating diversified farming systems, labels offer a pathway to access premium market segments and justify investments in alternative production practices (Schulze et al., Reference Schulze, Matzdorf, Rommel, Czajkowski, García-Llorente, Gutiérrez-Briceño, Larsson, Zagórska and Zawadzki2024).
Labeling systems, however, involve trade-offs. Third-party certified labels like USDA Organic, Fair Trade, and Non-GMO Verified provide standardized verification backed by established regulatory frameworks (Velasco et al., Reference Velasco, Marques, Torres, Marshall and Deering2024). These certifications tend to reduce buyer risk and increase consumer trust (Wang, Tao and Chu, Reference Wang, Tao and Chu2020). Yet, certification imposes significant costs (e.g., audit fees, compliance investments, and administrative burdens) that can exceed the capacity of small-scale operations (Liu et al., Reference Liu, Gao, Snell and Ma2020). Many farmers employing sustainable practices remain uncertified, relying instead on direct marketing channels where personal relationships substitute for formal verification (Torres et al., Reference Torres, Marshall, Alexander and Delgado2016).
Non-certified labels (i.e., terms like ‘locally grown’, ‘chemical-free’, or ‘regenerative agriculture’) offer flexibility but introduce ambiguity. Without standardization definitions or third-party oversight, these claims may face credibility challenges (Tonkin et al., Reference Tonkin, Wilson, Coveney, Webb and Meyer2015; Meijer et al., Reference Meijer, Detzel, Grunert, Robert and Stancu2021). Despite this, non-certified labels resonate with specific buyer requirements seeking attributes like local origin, reduced food miles, or specific production practices such as pesticide- or chemical-free (Rondoni and Grasso, Reference Rondoni and Grasso2021; Tran et al., Reference Tran, Broeckhoven, Hung, My, De Steur and Verbeke2022). The proliferation of both certified and non-certified labels creates a complex signaling environment where buyer interpretation and valuation likely vary across market segments.
Buyer behavior and procurement in specialty crop markets
Understanding buyer behavior in B2B agricultural markets differs fundamentally from consumer research. Wholesalers and restaurants function as professional procurement agents positioned between farmers and final consumers, aggregating and transmitting market signals upstream to producers (Roy and Ballantine, Reference Roy and Ballantine2020). Because this intermediary position determines which product attributes enter the supply chain, their procurement criteria shape demand signals, influence price, and establish the economic viability of alternative farming practices.
Procurement decisions in these markets involve multiple interdependent factors. Price remains important but rarely operates as the sole decision criterion. Product quality, including freshness, consistency, visual appeal, and taste, directly affects customer satisfaction and competitive positioning (Burgess, Sunmola and Wertheim-Heck, Reference Burgess, Sunmola and Wertheim-Heck2023; Cirone et al., Reference Cirone, Masotti, Prosperi, Bosi, Dinelli and Vittuari2023). Supply reliability, order fulfillment capacity, and established supplier relationships also influence sourcing patterns, particularly for buyers requiring consistent volumes (Torres, Lancaster and Boas, Reference Torres, Lancaster and Boas2020). For restaurants, ingredient quality ties directly to menu differentiation and customer experience, while wholesalers balance quality standards against logistical efficiency and price competitiveness across diverse retail and foodservice clients.
Recent shifts in procurement priorities reflect changing consumer preferences and competitive dynamics. A growing segment of buyers has adopted local sourcing and sustainability-focused procurement strategies, motivated by perceptions that local products offer superior freshness and align with consumer values around environmental stewardship and community support. Independent restaurants and fine-dining establishments often emphasize local sourcing as a brand differentiation strategy, while institutional buyers (e.g., universities and healthcare facilities) increasingly implement farm-to-institution programs that balance sustainability goals with traditional cost and availability requirements (Cirone et al., Reference Cirone, Masotti, Prosperi, Bosi, Dinelli and Vittuari2023; Love et al., Reference Love, Jablonski, McFadden and Bellows2025).
This market evolution extends beyond local sourcing to encompass broader sustainability considerations throughout supply chains. Buyers are increasingly evaluating suppliers on environmental performance, ethical labor practices, and production methods, integrating sustainability criteria into procurement scorecards and supplier assessment frameworks (García-Torres, Albareda and Seuring, Reference García-Torres, Albareda and Seuring2019; Molin et al., Reference Molin, Lingegård, Martin and Björklund2024). For wholesalers and restaurants, sustainable sourcing can enhance brand reputation and market positioning, particularly among consumer segments willing to pay premiums for verified environmental and ethical attributes.
The growing emphasis on transparency and traceability creates additional pressures. Consumer awareness about food safety, origin, and production methods drives demand for verifiable information about supply chain practices (Hobbs, Reference Hobbs2021; Rossi et al., Reference Rossi, Gemma, Borghini, Perini, Butini, Carullo and Campiani2025). Buyers respond by seeking suppliers who can document production practices through certifications, labels, or direct verification systems (Zhou, Jin and Liang, Reference Zhou, Jin and Liang2022). This emphasis on transparency favors producers who can credibly document sustainability practices through certification or direct verification, while potentially excluding those who cannot (Caputo and Reardon, Reference Caputo and Reardon2025).
Agricultural diversification and market access
The transition from commodity-focused agriculture to diversified farming systems confronts substantial economic barriers despite documented environmental benefits. Diversified systems incorporate crop rotation, perennial forages, specialty fruits and vegetables, and integrated livestock that can improve soil health, enhance biodiversity, stabilize yields under variable weather conditions, and reduce environmental impacts (Bowles et al., Reference Bowles, Mooshammer, Socolar, Calderón, Cavigelli, Culman, Deen, Drury, Garcia, Garcia, Gaudin, Harkcom, Lehman, Osborne, Robertson, Salerno, Schmer, Strock and Grandy2020; Beillouin et al., Reference Beillouin, Ben-Ari, Malézieux, Seufert and Makowski2021; Baldwin-Kordick et al., Reference Baldwin-Kordick, De, Lopez, Liebman, Lauter, Marino and McDaniel2022; Teng et al., Reference Teng, Hou, Dungait, Zhou, Kuzyakov, Zhang, Tian, Cui, Zhang and Delgado-Baquerizo2024). Yet, adoption remains limited, particularly in commodity-dominated regions like the Midwest Corn Belt, where monoculture systems prevail (Prokopy et al., Reference Prokopy, Gramig, Bower, Church, Ellison, Gassman, Genskow, Gucker, Hallett, Hill, Hunt, Johnson, Kaplan, Kelleher, Kok, Komp, Lammers, LaRose, Liebman, Margenot, Mulla, O’Donnell, Peimer, Reaves, Salazar, Schelly, Schilling, Secchi, Spaulding, Swenson, Thompson and Ulrich-Schad2020).
Market uncertainty represents a primary adoption constraint to diversification. Farmers face established market channels for commodity crops with predictable pricing and standardized quality specifications (Traldi et al., Reference Traldi, Asprooth, Usher, Floress, Arbuckle, Baskerville, Church, Genskow, Harden, Maynard, Thompson, Torres and Prokopy2024). Diversification introduces market risk: uncertain demand for specialty crops, lack of established buyer relationships, limited processing infrastructure, and fragmented distribution networks all can increase transaction costs and reduce expected returns (Sánchez et al., Reference Sánchez, Kamau, Grazioli and Jones2022). If intermediary buyers (i.e., wholesalers and restaurants) value products from diversified farms and translate that value into price premiums or consistent demand, diversification can become economically feasible. Conversely, if these buyers treat diversified products as undifferentiated commodities, farmers may lack economic incentives to adopt alternative systems regardless of environmental benefits (Rasmussen et al., Reference Rasmussen, Grass, Mehrabi, Smith, Bezner-Kerr, Blesh, Garibaldi, Isaac, Kennedy, Wittman, Batáry, Buchori, Cerda, Chará, Crowder, Darras, DeMaster, Garcia, Gómez, Gonthier, Guzman, Hidayat, Hipólito, Hirons, Hoey, James, John, Jones, Karp, Kebede, Kerr, Klassen, Kotowska, Kreft, Llanque, Levers, Lizcano, Lu, Madsen, Marques, Martins, Melo, Nyantakyi-Frimpong, Olimpi, Owen, Pantevez, Qaim, Redlich, Scherber, Sciligo, Snapp, Snyder, Steffan-Dewenter, Stratton, Taylor, Tscharntke, Valencia, Voge and Kremen2024).
Recent studies suggest potential market pathways. Some buyer segments actively seek local, sustainable, or diversified sources, creating niche markets that support alternative production systems (Bogado et al., Reference Bogado, Estrada-Carmona, Beillouin, Chéron-Bessou, Rapidel and Jones2024; Yang et al., Reference Yang, Xiong, Du, Ju, Gan, Li, Xia, Shen, Pacenka, Steenhuis and Siddique2024). Grassroots organizations like Practical Farmers of Iowa facilitate market connections, reducing information costs and helping diversified farmers identify receptive buyers (Blesh et al., Reference Blesh, Mehrabi, Wittman, Kerr, James, Madsen and Kremen2023). Yet, systematic understanding of which buyers value diversified production, and whether label preferences predict sourcing behavior, remains limited. Addressing this gap is essential for developing targeted strategies that connect diversified producers with receptive market segments and establish economically viable pathways for agricultural transition.
Data and methodology
Survey design and sampling strategy
This study examines procurement behavior among wholesalers and restaurants purchasing fresh market specialty crops in the United States. Although diversified farming encompasses a broad set of practices (defined in Data collection), specialty crops (fresh fruits and vegetables) are the market-facing output of these systems that flows through wholesale and restaurant procurement channels; wholesalers and restaurants do not purchase rotation, forage, or livestock-integration practices directly. Specialty crops are, therefore, the product category through which intermediary demand for diversified production is actually expressed, which makes them the appropriate locus for examining how buyer preferences shape market access for diversified farms.
These buyer types represent distinct but complementary channels through which diversified farms access markets. Wholesalers function as aggregators operating regional and national distribution networks, providing logistical infrastructure and market access for producers supplying at commercial scale (Ganapati, Reference Ganapati2025; Thomas et al., Reference Thomas, Lewis, Poirier, Williamson, Xie, Lightner and Gittelsohn2025). Restaurants increasingly serve as direct buyers, particularly for local and specialty crops where quality differentiation and origin verification matter for menu positioning and customer appeal (Forné and Leer, Reference Forné and Leer2025).
Our use of the term intermediary warrants clarification, as midstream actors in agri-food supply chains are heterogeneous (Grabs et al., Reference Grabs, Carodenuto, Jespersen, Adams, Camacho, Celi, Chandra, Dufour, Zu Ermgassen, Garrett and Lyons-White2024). We define intermediaries as midstream buyers that procure fresh specialty crops from farmers and supply them to downstream markets, either by reselling (wholesalers) or by transforming them into prepared meals (restaurants). This definition deliberately excludes upstream suppliers to farmers (e.g., input or seed suppliers), who are not buyers of farm output, as well as final consumers, who purchase for personal consumption rather than resale. We acknowledge that other midstream and retail actors, including grocery retailers, farmers’ markets, and online grocery-delivery platforms, also intermediate between diversified farms and consumers and would fall within a broader definition of the category. We focus on wholesalers and restaurants for two reasons. First, they represent the two highest-volume direct-purchase channels through which diversified specialty-crop farms reach commercial and foodservice markets, while many retail channels (e.g., supermarkets) typically source through wholesalers rather than directly from farms, placing them further downstream. Second, restricting the sample to two well-defined channel types enables the cross-sector segmentation that is central to our analysis. We return to the implications of this scope restriction in the discussion of limitations.
Procurement criteria differ systematically between these channels. Wholesalers typically prioritize volume consistency, standardization, and reliable supply across diverse retail and foodservice clients (Ganapati, Reference Ganapati2025). Restaurants often emphasize specific product attributes (e.g., flavor profiles, visual quality, origin stories) that enable menu differentiation and justify premium pricing (Mukahhal, Abebe and Bahn, Reference Mukahhal, Abebe and Bahn2022). Despite these operational differences, both buyer types face similar pressures around sustainability, transparency, and traceability as consumer preferences evolve. Understanding how food labels influence procurement decisions across these segments provides insight into market access pathways for farmers pursuing diversification strategies.
We developed parallel survey instruments for wholesalers and restaurants, drawing on established supply chain management and buyer behavior constructs. Both instruments included identical question modules addressing: (1) current procurement practices and supplier relationships; (2) preferences for certified and non-certified food labels; (3) sourcing from diversified farming operations; (4) perceived barriers to direct farm sourcing; and (5) expected future demand for labeled products. While each survey included sector-specific questions tailored to operational contexts, this analysis focuses on shared components to enable cross-sector comparison and market segmentation.
Data collection
Wholesaler survey
Qualtrics Panel Services recruited participants from its proprietary business panel between September 12 and October 12, 2023. Eligibility required decision-making authority for fresh produce procurement and age 18 or older. Qualifying roles included chief executive officer, procurement manager, merchant manager, or business owner. We implemented stratified sampling targets based on U.S. Census Bureau Statistics of U.S. Businesses (SUSB) data for NAICS code 424480 (Fresh Fruit and Vegetable Merchant Wholesalers). Regional targets followed SUSB distributions: West (37%), South (31%), Northeast (22%), and Midwest (10%). Firm size targets based on employee counts were fewer than 5 employees (49%), 5–9 (17%), 10–19 (12%), 20–99 (16%), 100–499 (5%), and 500 or more (1%) (U.S. Census Bureau, 2021). The final sample included 204 completed responses spanning all 50 states.
Restaurant survey
We distributed surveys via email to 9,141 restaurant contacts compiled from DataCaptive (a commercial business database) and D&B Hoovers records accessed through university library subscriptions. Eligible respondents were owners or managers with purchasing authority. To validate survey content, we pretested instruments with managers from 10 restaurants across 2 Midwestern metropolitan areas, including establishments representing fast food, casual dining, and fine dining segments. Data collection occurred from September 5, 2023, through April 18, 2024. The first 100 respondents received $25 gift cards as participation incentives, consistent with best practices for improving response rates in online business surveys (Dillman, Smyth and Christian, Reference Dillman, Smyth and Christian2014). The restaurant survey yielded 174 completed responses.
The restaurant survey response rate was 1.9% (174 of 9,141 contacts) after four email reminders sent with an interval of 3–5 weeks (Dillman, Smyth and Christian, Reference Dillman, Smyth and Christian2014). To assess representativeness, we compared our sample to industry benchmarks. The distribution included diverse operational formats such as casual dining (38%), fast casual (21%), catering (20%), quick service (12%), family dining (14%), fine dining (8%), and coffee shops (10%), which were consistent with U.S. restaurant industry structure. Geographic distribution spanned all four Census regions, with concentrations in the South (41%) and Midwest (24%) reflecting population patterns. Revenue distribution aligned with Small Business Administration data, with 64% reporting under $5 M in annual sales.
Combined sample
The analysis sample comprises 378 buyers, composed by 204 wholesalers and 174 restaurants, who reported purchasing fresh market agricultural products directly from U.S. farmers in 2022. Both surveys received Institutional Review Board approval (IRB-2022-151) and adhered to ethical standards for human subjects research. All surveys were administered online via Qualtrics (Qualtrics LLC, Provo, UT).
Measurement and variable construction
Following Traldi et al. (Reference Traldi, Asprooth, Usher, Floress, Arbuckle, Baskerville, Church, Genskow, Harden, Maynard, Thompson, Torres and Prokopy2024), we operationalized diversified farming as implementing one or more of the following practices: (1) crop rotation with three or more crops; (2) perennial pasture, forage, or biomass production; (3) agroforestry systems including riparian buffers, windbreaks, or silvopasture; (4) specialty fruit and vegetable cultivation; or (5) grazed livestock integration. Respondents indicated whether their business purchased from farmers meeting this definition during 2022. This classification distinguishes buyers engaging with diversified systems from those sourcing exclusively from conventional commodity operations, enabling analysis of procurement patterns that support or constrain agricultural diversification (Horrigan, Lawrence and Walker, Reference Horrigan, Lawrence and Walker2002; Carlisle, Reference Carlisle2014; Gliessman, Reference Gliessman2015). Because wholesalers and restaurants transact in fresh produce rather than in farming practices per se, our analysis necessarily observes engagement with diversified farms through their specialty-crop output, the segment of diversified production that reaches these intermediary channels.
An extensive literature review identified 15 food labels commonly marketed to wholesale and foodservice buyers. We categorized these into non-certified labels (pollinator-friendly, low food miles, regenerative agriculture, low carbon footprint, chemical-free, low/zero greenhouse gas emissions, sustainably produced, fair labor practices, locally grown, organically grown, and pesticide free) and third-party certified labels (USDA Organic, Non-GMO Verified, Certified Naturally Grown, Fair Trade Certified). Label selection reflected both established certifications with documented market presence (Poret and Chambolle, Reference Poret and Chambolle2007; Dimitri and Oberholtzer, Reference Dimitri and Oberholtzer2009) and emerging sustainability claims gaining traction in specialty crop markets (Liu, Bui and Leach, Reference Liu, Bui and Leach2013; Bell and Horvath, Reference Bell and Horvath2020).
For each label, respondents indicated whether their business currently requires or prioritizes that label when purchasing fresh produce. Additionally, respondents estimated expected customer demand for each label over the next 3 years (i.e., increase, decrease, or remain stable), providing forward-looking indicators of market trajectory. These measures capture both current procurement criteria and anticipated market evolution, enabling analysis of buyer positioning relative to emerging sustainability trends (Velasco et al., Reference Velasco, Marques, Torres, Marshall and Deering2024).
We collected firm demographic variables including geographic region (Northeast, Midwest, South, West following U.S. Census Bureau definitions) and annual gross revenue (<$500K, $500K–$5M, $5M–$50M, $50M–$100M, >$100M). Product category procurement covered fruits, vegetables, grains, and legumes purchased in 2022. Operational type classifications captured business model diversity: wholesalers selected from brokers, cooperatives, exporters, merchants, retailers, food processors, and other categories; restaurants identified as coffee shops, casual dining, catering, family dining, fast casual, quick service, fine dining, or other formats.
Supplier relationship variables documented primary sourcing channels. Wholesaler options included aggregators, brokers, cooperatives, domestic farmers, foreign farms, importers, and other wholesalers (Arya, Mittendorf and Sappington, Reference Arya, Mittendorf and Sappington2007; Gao, Shen and Tan, Reference Gao, Shen and Tan2023). Restaurant options encompassed local farms, non-local farms, farm-to-table suppliers, local food markets, local wholesalers, national distributors, retailers, and specialty suppliers. We classified ‘direct farm sourcing’ as wholesalers selecting domestic, regional, or local farmers or cooperatives and restaurants selecting local farms, non-local farms, farm-to-table operations. This consistent definition across buyer types enables comparative analysis of direct sourcing patterns.
Although wholesalers and restaurants differ in scale and operational focus, we merged datasets for several analytical reasons. First, both sectors operate as professional procurement intermediaries making similar credence attribute evaluations when assessing food labels, despite differences in order volumes and customer bases. The information asymmetry problems they face when evaluating unobservable product attributes are fundamentally similar (Darby and Karni, Reference Darby and Karni1973). Second, both buyer types face convergent pressures around sustainability, transparency, and traceability as consumer preferences evolve, making their responses to food labeling schemes comparable despite operational differences. Lastly, both buyers represent distinct but interconnected pathways through which diversified farms access markets. Understanding heterogeneity across the full procurement spectrum provides more actionable insights than sector-specific analyses alone. Capturing cross-sector heterogeneity enables market segmentation that reflects real-world buyer diversity, where farmers typically engage multiple channel types simultaneously rather than exclusively targeting one sector. To ensure the robustness of merging wholesaler and restaurant datasets, we conducted multiple validation tests. We tested for configural invariance using multi-group confirmatory factor analysis, confirming that the same factor structure holds across both buyer types (CFI = 0.92, RMSEA = 0.058). Kolmogorov–Smirnov tests on key variables (operational characteristics, food label requirements) showed no significant differences after controlling for sector-specific scaling factors (P > 0.10). Lastly, we conducted separate PCAs for each sector, finding highly correlated factor scores, confirming stable underlying dimensions. In addition, PCA on the merged dataset produced strong internal consistency (Kaiser–Meyer–Olkin = 0.90) and interpretable factor structures applicable to both buyer types.
Methodology
This study employs a two-stage multivariate approach to segment buyers based on food label preferences and examines how these segments differ in procurement behavior.
Principal component analysis
Principal component analysis (PCA) is a dimension-reduction technique that transforms a set of correlated variables into a smaller number of uncorrelated composite variables, called principal components, while retaining as much of the original variance as possible (Jolliffe and Cadima, Reference Jolliffe and Cadima2016). Each component is a linear combination of the original variables,
$ P{C}_k={\sum}_{j=1}^p{w}_{kj}{x}_j $
 , where
$ {x}_j $
 are the observed variables and
$ {w}_{kj} $
 are the component weights (loadings); the weights are obtained from the eigenvectors of the variables’ correlation matrix, and each component’s eigenvalue gives the amount of total variance it captures. Components are extracted in order of decreasing variance explained, so that the first few components summarize the dominant patterns of covariation among the variables. We use PCA here to identify the latent dimensions underlying buyers’ valuations of the 15 food labels: rather than treating each label as a separate, correlated outcome, PCA allows us to characterize buyer preferences in terms of a small number of interpretable underlying constructs, whose respondent-level scores then serve as inputs to the cluster analysis described in Cluster analysis.
In implementing PCA on the 15 binary label variables, we computed tetrachoric correlations, which provide appropriate estimates of relationships among dichotomous indicators assumed to reflect latent continuous constructs (Bonett and Price, Reference Bonett and Price2005; Verhulst and Neale, Reference Verhulst and Neale2021). The Kaiser–Meyer–Olkin measure confirmed strong sampling adequacy (KMO = 0.90), indicating correlations among variables were sufficiently large to warrant factor extraction. We retained components with eigenvalues exceeding 1.0, consistent with the Kaiser criterion for determining dimensionality (Shrestha, Reference Shrestha2021). Varimax rotation provided orthogonal factors that maximize interpretability by producing simple structure with high loadings on subsets of variables (Rohe and Zeng, Reference Rohe and Zeng2023).
The final two-component solution explained 74.6% of total variance, well above the 60% threshold typically considered adequate for social science studies (Jolliffe and Cadima, Reference Jolliffe and Cadima2016). All 15 variables exhibited communalities (1 − uniqueness) above 0.50, indicating that the factor solution adequately captured variance in each observed variable (Mooi, Sarstedt and Mooi-Reci, Reference Mooi, Sarstedt and Mooi-Reci2018). Factor scores for each respondent on the two extracted components serve as inputs for subsequent cluster analysis.
Cluster analysis
Using extracted factor scores, we performed hierarchical cluster analysis using Ward’s linkage method, which minimizes within-cluster variance (Alamgir and Naveed, Reference Alamgir and Naveed2021). Multiple criteria evaluated the optimal number of clusters. The Calinski–Harabasz Variance Ratio Criterion, which compares between-cluster to within-cluster variance, achieved its maximum value at three clusters. The Duda–Hart index and pseudo-F statistics corroborated this solution. We then applied k-means clustering with the three-cluster hierarchical solution to refine cluster boundaries and assign final memberships.
Agreement between hierarchical and k-means cluster assignments reached 89%, indicating consistency across methods (Jain, Murty and Flynn, Reference Jain, Murty and Flynn1999). We validated segment distinctiveness through multiple approaches. ANOVA tests comparing cluster means on both factor scores and original label variables yielded F-statistics significant at P < 0.01 for all comparisons. We characterized each cluster through comprehensive profiling across firm characteristics, procurement behaviors, and market perceptions. Chi-square tests assessed associations between cluster membership and categorical variables (e.g., buyer type, region, operational format, sourcing from diversified farms). For continuous variables (e.g., revenues, product volumes), we used one-way ANOVA with Tukey’s Honestly Significant Difference (HSD) (P < 0.01) post hoc tests for pairwise comparisons.
We assessed whether cluster membership was associated with sourcing from diversified farms, the primary behavioral outcome of interest. We also tested whether clusters differed in expected future demand for labels and perceptions of market opportunities. All analyses used Stata 18.5 (StataCorp, College Station, TX). We report means, standard deviations, and significance levels for key comparisons. Tables 1–6 present full descriptive statistics, cluster profiles, and comparative analyses.
Sample characteristics of specialty crop buyers by type (N = 378)

Table 1. Long description
The table reports proportions for the full sample and separately for wholesalers and restaurants, with asterisks marking significant differences. Revenue brackets: under $500K (0.20), $500K–$5M (0.39), $5M–$50M (0.25), $50M–$100M (0.08), $100M or more (0.08). Regions: Northeast 0.15, Midwest 0.24, West 0.20, South 0.41. Purchases in 2022: fruits 0.89, grains 0.83, legumes 0.72, vegetables 0.91. Wholesalers purchased fruits (0.97), legumes (0.80), and vegetables (0.94) at significantly higher rates than restaurants (0.80, 0.63, 0.87), and more often fell in the $50–100M revenue bracket.
Note: Sample includes wholesalers (N = 204) and restaurants (N = 174) purchasing fresh market agricultural products directly from U.S. farmers in 2022.
1 Values represent proportions except for employment variables, which are means.
*, **, *** indicate significant differences between wholesalers and restaurants at P < 0.10, 0.05, and 0.01, respectively, based on two-sample t-tests (continuous variables) or chi-square tests (categorical variables).
Factor loadings from principal component analysis of food label requirements (N = 378)

Table 2. Long description
Each label’s loading on two varimax-rotated components is shown. Component 1, Practice-Based Labels, loads highly on non-certified labels: pollinator-friendly 0.85, low food miles 0.83, regenerative agriculture 0.83, low carbon footprint 0.81, chemical-free 0.76, low/zero GHG 0.76, sustainably produced 0.72. Component 2, Credence-Based Labels, loads highly on certifications: USDA Organic 0.91, Non-GMO Verified 0.83, organically grown 0.77, Fair Trade 0.72, pesticide-free 0.64. Eigenvalues are 10.01 and 1.18; variance explained is 66.72% and 7.84%, totaling 74.56%. KMO sampling adequacy is 0.90.
1 Factor loadings represent correlations between observed variables and extracted components. Values range from −1 to +1, with higher absolute values indicating stronger associations. Extraction method: principal component analysis with varimax rotation. Kaiser–Meyer–Olkin measure of sampling adequacy = 0.90. Total variance explained = 74.56%.
Food label requirements by buyer cluster (N = 378)

Table 3. Long description
Rows are 15 certified and non-certified labels; columns are three clusters with significance letters. Label Advocates require nearly all labels at high rates (0.68–0.94), including practice-based labels like chemical-free 0.94 and pollinator-friendly 0.82. Market-Driven Buyers require certifications highly (USDA Organic 0.94, Non-GMO 0.84, Certified Naturally Grown 0.57) but practice-based labels much less (regenerative 0.11, low food miles 0.09). Skeptics require almost no labels (0.01–0.20). Differences across clusters are significant at P < 0.01 for every label. Cluster composition: Label Advocates 98% wholesalers; Market-Driven 64% wholesalers, 36% restaurants; Skeptics 85% restaurants.
1 Different uppercase letters show statistically significant differences across columns at P < 0.01 using Tukey’s significant difference test.
2 Values represent the proportion of buyers in each cluster requiring each label when purchasing fresh produce.
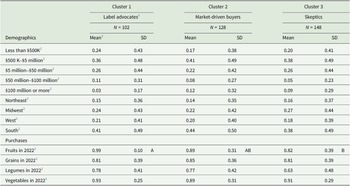
Demographic and operational characteristics by buyer cluster (N = 378)

Table 4. Long description
Revenue brackets are similar across clusters, though Label Advocates have the fewest very large firms ($100M or more, 0.03), while Market-Driven Buyers have the most (0.12). Regional distribution is comparable, with the South largest in all clusters (0.38–0.44). Purchases in 2022: fruits differ significantly, with Label Advocates highest at 0.99, Market-Driven 0.89, and Skeptics lowest at 0.82. Grains (around 0.81–0.85), legumes (0.63–0.78), and vegetables (0.89–0.93) do not differ significantly across clusters. Significance letters mark differences at P < 0.01.
1 Different uppercase letters show statistically significant differences across columns at P < 0.01 using Tukey’s significant difference test.
2 Values represent proportions except for employment variables, which are means.
Expected increase in customer demand for food labels by buyer cluster (N = 378)

Table 5. Long description
Values are the proportion of buyers in each cluster expecting increased customer demand for each label within three years. Label Advocates consistently expect the largest increases: pesticide-free 0.62, chemical-free 0.61, locally grown 0.55, low/zero GHG 0.54, sustainably produced 0.54. Market-Driven Buyers and Skeptics expect smaller increases, generally between 0.22 and 0.57. Significant differences across clusters at P < 0.01 appear for low carbon footprint, low/zero GHG emissions, pesticide-free, and regenerative agriculture, with Label Advocates highest and Skeptics lowest on these items.
1 Different uppercase letters show statistically significant differences across columns at P < 0.01 using Tukey’s significant difference test.
2 Values represent the proportion of buyers in each cluster expecting increased customer demand for each label within 3 years.
Sourcing patterns, barriers, motivations, and perceptions regarding sourcing from diversified farms by buyer cluster (N = 378)

Table 6. Long description
Label Advocates source from farmers most (0.75) and buy from diversified farmers as a share of farmer-suppliers most (0.76), versus Market-Driven (0.60) and Skeptics (0.45). Barriers (quality concerns, higher prices, lack of supply) do not differ significantly. Motivations: relationship-building is highest for Label Advocates (0.58). Perceptions differ sharply: Label Advocates most often view diversified products as part of their prime portfolio (0.77 vs. 0.55 vs. 0.30), believe consumers will pay premiums for sustainability information (0.85 vs. 0.60 vs. 0.40), and perceive increasing supply (0.76 vs. 0.58 vs. 0.40). Many differences are significant at P<0.01.
1 Different uppercase letters show statistically significant differences across columns at P < 0.01 using Tukey’s significant difference test.
2 Values represent the proportion of buyers in each cluster agreeing with each statement.
Results
Sample statistics
The sample includes 204 wholesalers and 174 restaurants, exhibiting substantial heterogeneity in sourcing patterns, business structures, and operational focus. Wholesalers demonstrated broader supplier diversification than restaurants. Among wholesalers, 63% sourced directly from domestic farmers, 38% from importers, 29% through cooperatives, 23% via brokers, and 22% from foreign suppliers. This pattern reflects wholesalers’ dual reliance on domestic production and global supply chains, with domestic farms serving as the primary source. Restaurants operated through different channels, relying predominantly on national wholesalers (81%) and local wholesale distributors (71%). Direct farm sourcing was less common but still substantial: 44% of restaurants purchased some fresh market agricultural products from local farms and 24% from non-local farms. Restaurants also sourced from retailers (48%) and specialty suppliers (47%).
Within wholesaler types, merchant wholesalers comprised the largest segment (37%), followed by retailers (30%), manufacturers’ sales branches (20%), and processors (19%). Restaurants exhibited similar operational variety. Casual dining dominated (38%), followed by fast casual (21%), catering (20%), quick service (12%), family dining (14%), fine dining (8%), and coffee shops (10%). These distributions capture the structural complexity of specialty crop distribution channels, where buyers perform multiple functions and serve diverse customer segments.
Table 1 presents demographic and procurement characteristics for 378 buyers who purchased fresh market specialty crops in 2022. Revenue concentration centered on small to mid-sized operations: 20% reported annual gross sales below $500,000, 39% between $500,000 and $5 million, and 25% between $5 million and $50 million. Only 8% exceeded $50 million annually, with wholesalers slightly more represented in this category than restaurants (10% vs. 5%, P < 0.1). Relative to U.S. Census data showing 98% of businesses in these sectors generate under $5 million annually (NAICS Association, 2024), the sample overrepresents mid-sized firms, likely because direct farm sourcing requires procurement infrastructure and relationship management capacity less common among micro-enterprises.
Regionally, respondents concentrated in the South (41%), followed by the Midwest (24%), West (20%), and Northeast (15%). Fresh produce dominated procurement with vegetables (91%) and fruits (89%), while grains (83%) and legumes (72%) showed somewhat lower but still substantial rates. Wholesalers sourced fruits significantly more than restaurants (97% vs. 80%, P < 0.01), consistent with their role supplying retail and foodservice channels requiring diverse product assortments. Similarly, wholesalers more frequently purchased legumes (80% vs. 63%, P < 0.01) and vegetables (94% vs. 87%, P < 0.05), reflecting their function as aggregators serving multiple downstream buyers.
These patterns establish the sample’s diversity across firm characteristics, buyer types, and procurement behaviors, providing a foundation for examining how food label preferences segment this heterogeneous market.
Principal component analysis
Principal component analysis identified two distinct dimensions underlying buyer preferences for the 15 food labels examined in this study (Table 2). The two-component solution explained 74.6% of total variance, exceeding conventional thresholds. The first component (eigenvalue = 10.01) accounted for 66.7% of variance, while the second component (eigenvalue = 1.18) contributed an additional 7.8%. Factor loadings, ranging from 0.60 to 0.91, indicate strong associations between observed label preferences and the underlying dimensions.
The first component, Practice-Based Labels, loaded strongly (0.60–0.85) on nine non-certified labels: pollinator-friendly (0.85), low food miles (0.83), regenerative agriculture (0.83), low carbon footprint (0.81), chemical-free (0.76), low GHG emissions (0.76), sustainably produced (0.72), fair labor practices (0.71), and locally grown (0.60). Certified Naturally Grown (0.64) also loaded on this dimension despite being a certification, likely because it emphasizes grassroots, farm-level practices rather than third-party regulatory frameworks. This component captures buyers who value detailed production attributes about specific environmental or ethical practices. These buyers appear to prioritize knowing how food is produced, through specific methods like pollinator protection or reduced food miles, rather than relying primarily on standardized certification schemes.
The second component, Credence-Based Labels, exhibited strong loadings (0.64 to 0.91) on formal certifications: USDA Organic (0.91), Non-GMO Verified (0.83), Fair Trade Certified (0.72), and Certified Naturally Grown (0.63). Two non-certified attributes, organically grown (0.77) and pesticide-free (0.64), also loaded strongly on this dimension. Although ‘organically grown’ technically describes production practices, its strong association with USDA Organic suggests buyers perceive it as functionally equivalent to formal certification rather than a distinct practice claim. Similarly, ‘pesticide-free’ aligns with organic standards in buyers’ minds, functioning as a credence attribute valued for its association with safety and environmental standards. Overall, this component reflects buyers who prioritize third-party verification, regulatory compliance, and standardized definitions of sustainability. These buyers seek assurance through established certification systems that provide traceability and market-wide recognition.
The two-component structure reveals fundamentally different approaches to evaluating sustainability in procurement. Practice-Based Labels represent a practice-oriented framework where buyers value specific, detailed information about production methods. Credence-Based Labels represent a verification-oriented framework where buyers rely on institutional certification to validate claims. This distinction aligns with credence goods theory: when product attributes cannot be verified through direct observation, buyers must choose between detailed attribute disclosure (practice-based) or institutional guarantees (credence-based) as mechanisms to reduce market information gaps (Darby and Karni, Reference Darby and Karni1973).
Buyer segmentation
Cluster analysis using the two PCA factor scores identified three distinct buyer segments. The Calinski–Harabasz Variance Ratio Criterion indicated that a three-cluster solution optimized the trade-off between within-cluster homogeneity and between-cluster separation. ANOVA tests confirmed significant differences across clusters on all label preferences (P < 0.01), validating the analytical robustness of the three-cluster solution. Tables 3–6 present comprehensive profiles of each cluster, including label requirements (Table 3), firm characteristics (Table 4), expected customer demand (Table 5), and procurement behavior (Table 6).
Cluster 1: Label Advocates (N = 102, 27%). This segment consisted almost entirely of wholesalers (98%) and exhibited the strongest endorsement of labels across both dimensions. Label Advocates required non-certified practice-based labels at exceptionally high rates: chemical-free (94%), Certified Naturally Grown (90%), fair labor practices (85%), pesticide-free (82%), and sustainably produced (82%). They also valued environmental impact labels, including pollinator-friendly (82%), regenerative agriculture (80%), low carbon footprint (77%), low GHG emissions (75%), and locally grown (76%).
Interestingly, Label Advocates showed somewhat lower requirements for the most established certifications compared to Cluster 2: USDA Organic (79% vs. 94%) and Non-GMO Verified (77% vs. 84%) (P < 0.01). This pattern suggests Label Advocates prioritize detailed sustainability narratives and diverse practice claims over reliance on a few mainstream certifications. Their profile reflects values-driven procurement, emphasizing transparency and comprehensive environmental stewardship rather than market-driven certification signaling.
Cluster 2: Market-Driven Buyers (N = 128, 34%). This mixed segment included both wholesalers (64%) and restaurants (36%) and exhibited a strong preference for third-party certifications: USDA Organic (94%), Non-GMO Verified (84%), Fair Trade Certified (63%), and Certified Naturally Grown (57%). Market-Driven Buyers also valued non-certified attributes closely aligned with certification frameworks, particularly organically grown (64%) and pesticide-free (58%), likely reflecting consumer association between these terms and formal organic standards.
Market-Driven Buyers showed substantially lower interest in other practice-based labels compared to Label Advocates. Preference for regenerative agriculture (11%), low food miles (9%), and pollinator-friendly (15%) remained minimal, suggesting these buyers focus procurement criteria on widely recognized certifications that facilitate consumer communication rather than comprehensive sustainability attributes. This cluster appears motivated primarily by market signaling, using certifications to meet customer expectations and differentiate products, rather than detailed environmental commitments.
Cluster 3: Skeptics (N = 148, 39%). The largest segment consisted predominantly of restaurants (85%) and demonstrated minimal engagement with both certified and non-certified labels. Fewer than 10% of Skeptics required any third-party certification: USDA Organic (7%), Non-GMO Verified (8%), Fair Trade (3%), and Certified Naturally Grown (7%). Non-certified label requirements remained equally low, with only locally grown showing modest interest (20%), followed by fair labor practices (14%) and chemical-free (12%). Differences between Skeptics and other clusters on these attributes were significant (P < 0.01), confirming this segment’s heterogeneity.
Skeptics’ procurement decisions appear driven by factors other than sustainability signaling, likely emphasizing price, availability, quality consistency, and established supplier relationships. This segment may view labels as irrelevant to their operational priorities or question their value in differentiation and marketing.
Label Advocates sourced fruits at higher rates (99%) than Market-Driven Buyers (89%) or Skeptics (82%) (P < 0.01), potentially reflecting fruit production’s association with diversified farming systems (Table 4). Label Advocates anticipated increased customer demand across sustainability-focused labels more than other segments (Table 5). They expected rising demand for low carbon footprint (52% vs. 37% for Market-Driven, 30% for Skeptics, P < 0.01), low GHG emissions (54% vs. 33% vs. 26%, P < 0.01), and regenerative agriculture (43% vs. 29% vs. 22%, P < 0.01). These expectations suggest Label Advocates position themselves for evolving sustainability requirements, while Skeptics anticipate limited market shifts toward environmental labeling.
Cluster membership strongly predicted sourcing from diversified farmers (Table 6). Label Advocates purchased from diversified farms at significantly higher rates (76%) than Market-Driven Buyers (60%) or Skeptics (45%) (P < 0.01). Label Advocates also more frequently viewed diversified products as part of their core portfolio (77% vs. 55% vs. 30%, P < 0.01), perceived increasing supply (76% vs. 58% vs. 40%, P < 0.01), and believed consumers would pay premiums for sustainability information (85% vs. 60% vs. 40%, P < 0.01). These patterns demonstrate that label preferences serve as meaningful predictors of actual procurement behavior, not merely stated attitudes. Buyers valuing labels, particularly Practice-Based Labels, translate those preferences into tangible sourcing relationships with diversified producers.
Discussion
This study segments U.S. wholesalers and restaurants based on food label preferences and examines how these preferences relate to procurement from diversified farms. Using principal component analysis and cluster analysis on survey data from 378 buyers, we identified two underlying dimensions: Practice-Based Labels emphasizing production information and Credence-Based Labels prioritizing third-party verification, that define three distinct buyer segments with systematically different procurement behaviors.
The three-cluster solution reveals substantial market heterogeneity. Label Advocates (27%), composed almost entirely of wholesalers, require both Practice-Based and Credence-Based labels at high rates, suggesting comprehensive sustainability commitments shape their procurement criteria. Market-Driven Buyers (34%), a mixed segment of wholesalers and restaurants, concentrate on established certifications such as USDA Organic, Non-GMO Verified, and Fair Trade, while largely dismissing Practice-Based labels. This pattern indicates strategic use of certifications as market signals rather than comprehensive sustainability evaluation. Skeptics (39%), predominantly restaurants, demonstrate minimal engagement with any labels, suggesting that for the largest buyer segment, traditional procurement criteria including price, quality consistency, and supply reliability outweigh sustainability signaling.
The relationship between cluster membership and diversified farm sourcing provides critical evidence that label preferences translate into actual procurement behavior. Label Advocates purchased from diversified farms at substantially higher rates (76%) than Market-Driven Buyers (60%) or Skeptics (45%). This gradient demonstrates that buyers valuing sustainability labels actively seek suppliers employing diversification strategies. If label preferences reliably predict buyer receptivity, farmers can strategically target segments aligned with their production systems. Label Advocates represent high-value partners given their broad sustainability commitments and perception that diversified products fit their core portfolio. Market-Driven Buyers offer larger volume opportunities but may require formal certification investments. Skeptics present entry barriers requiring alternative value propositions beyond sustainability.
The two-dimensional label structure aligns with economic theory on credence goods and information asymmetry (Darby and Karni, Reference Darby and Karni1973). When buyers cannot directly observe production practices, they choose between detailed attribute disclosure and institutional verification to reduce uncertainty. Label Advocates appear willing to evaluate diverse practice claims, suggesting either lower information costs or higher returns to sustainability knowledge in their customer relationships. Market-Driven Buyers seem to reduce information processing costs by relying on standardized certifications that consolidate multiple attributes into recognized signals. Producers targeting Label Advocates can benefit from transparent documentation of specific practices such as pollinator protection, regenerative methods, and carbon measurement, even without formal certification. Producers targeting Market-Driven Buyers require third-party verification. The certification cost barrier documented in prior research (Liu et al., Reference Liu, Gao, Snell and Ma2020), thus becomes segment-specific: Label Advocates offer market access for uncertified sustainable producers, while Market-Driven Buyers require certification investments that may exclude smaller operations.
The buyer-level analysis highlights how intermediaries function as a transmission mechanism in agricultural market transformation. Rather than passing consumer preferences upstream unchanged, wholesalers and restaurants selectively transmit them: they filter and interpret sustainability signals according to their own procurement criteria, determining which farming practices reach producers as economic rewards. This selectivity is precisely what makes the intermediary position consequential, as the same consumer-level demand can yield strong or negligible farm-level incentives depending on which buyer segment receives it. Label Advocates’ procurement patterns potentially create niche markets supporting diversified farms even when broader consumer awareness remains limited. Market-Driven Buyers’ certification focus concentrates demand on verified attributes rather than comprehensive sustainability, potentially creating production incentives toward narrow compliance over holistic environmental stewardship. Understanding these mechanisms is essential for scaling diversified agriculture, as farmer adoption decisions respond not only to agronomic benefits or consumer demand but to specific procurement criteria of accessible buyer segments.
Conclusions
This study provides empirical evidence that food label preferences segment specialty crop buyers into distinct groups with systematically different procurement behaviors. The three buyer segments, Label Advocates, Market-Driven Buyers, and Skeptics, differ in their valuation of practice-based versus credence-based labels and in their sourcing from diversified farms. These findings demonstrate that labels function not merely as marketing tools but as signals predicting buyer values and actual purchasing decisions.
For farmers pursuing diversification strategies, these results suggest targeted market development approaches. Farmers can emphasize transparent production narratives and detailed sustainability attributes when approaching Label Advocates, who value comprehensive environmental commitments. When targeting Market-Driven Buyers, farmers should prioritize obtaining recognized certifications that facilitate consumer communication and meet verification requirements. For Skeptics, market entry likely requires demonstrating value through quality consistency, reliability, and service rather than sustainability attributes.
Translating this segmentation into a tool farmers can use in practice does not require replicating our statistical analysis. The two preference dimensions map onto a small number of observable buyer signals that farmers can assess during ordinary sales conversations. A buyer who asks primarily about specific certifications (USDA Organic, Non-GMO, Fair Trade) likely fits the Market-Driven Buyer profile, for whom obtaining those certifications is the priority; a buyer who probes production practices and sustainability narratives beyond formal certification reflects the Label Advocate profile and rewards detailed transparency; and a buyer whose questions center on price, consistency, and reliability corresponds to the Skeptic segment, for whom service and quality assurance matter more than sustainability claims. A simple decision aid (e.g., a one-page guide pairing these diagnostic questions with the corresponding outreach strategy) could allow farmers, and the extension agents who advise them, to apply the framework without specialized analytical training. Embedding such guidance in existing extension and technical-assistance channels would offer a low-cost pathway to adoption.
For supply chain managers and policymakers, the segmentation framework offers practical guidance for resource allocation. Investments in certification support programs benefit Market-Driven Buyers who require third-party verification but may be less relevant for Label Advocates who accept diverse practice claims. Buyer education initiatives targeting Skeptics could emphasize operational benefits of sustainable sourcing such as supply chain resilience, quality differentiation, or consumer loyalty, rather than environmental messaging alone.
The findings also contribute to policy debates on agricultural diversification and market access. If intermediary buyers’ procurement criteria determine which farming practices receive economic rewards, then policies supporting diversification must address buyer-level barriers: certification costs, market information gaps, and supply chain coordination challenges. Market-based strategies for agricultural transformation require understanding not just consumer preferences but the intermediary actors who translate those preferences into farm-level incentives.
As U.S. agriculture confronts pressures to enhance environmental performance while maintaining economic viability, understanding buyer segmentation becomes increasingly important. The market for sustainably produced specialty crops is not uniform; rather it comprises distinct segments with different evaluation criteria, information needs, and sourcing priorities. Recognizing this heterogeneity enables more effective strategies to connect diversified producers with receptive buyers and to scale alternative farming systems through targeted market development.
Several factors constrain the generalizability of these findings. The restaurant survey’s low response rate (1.9%) raises potential non-response bias despite sample diversity across operational formats and regions. Relatedly, our sample over-represents mid-sized firms relative to the broader population of specialty-crop buyers. Because procurement behavior may vary with firm size—larger buyers, for instance, often gravitate toward higher-volume, more standardized commodity sourcing driven by economies of scale—this composition could affect how well our absolute sourcing rates generalize to the full buyer population. Because our central findings concern the relationships among buyer segments and between label preferences and sourcing behavior, rather than population-level point estimates, we expect them to be robust to the sample’s size composition; absolute procurement rates, however, are best interpreted as characterizing our sample rather than the population. We note, however, that our central findings concern the relationships among buyer segments and between label preferences and sourcing behavior, which are less sensitive to the sample’s size composition than population-level point estimates would be; absolute procurement rates should therefore be interpreted with this caveat in mind. Results reflect buyers purchasing directly fresh market agricultural products from farms, a selective subset representing more engaged, relationship-oriented procurement rather than arms-length commodity transactions. Geographic concentration in the South and Midwest may not fully represent coastal markets where local and sustainable sourcing is more established. The cross-sectional design captures preferences at one point in time, limiting assessment of how buyer priorities evolve as markets and certification systems change. Label preferences, while predictive of sourcing behavior, do not capture the full range of factors influencing procurement decisions. Personal relationships with suppliers, supply chain logistics, regional market dynamics, and firm-specific strategies all shape purchasing patterns in ways this analysis does not fully address. The clustering approach identifies meaningful market segments but necessarily simplifies continuous variation in buyer preferences into discrete categories.
Our focus on wholesalers and restaurants, while capturing the two principal direct-purchase channels for diversified specialty crops, omits other midstream and retail intermediaries such as grocery retailers, farmers’ markets, and online delivery platforms, whose label preferences and sourcing behavior may differ; extending the segmentation framework to these actors is a natural direction for future work.
The cross-sectional design also limits our ability to assess how buyer segments evolve, which bears on a question worth highlighting: what becomes of the Label Advocate segment if consumer demand for sustainably produced foods does not continue to broaden? Two trajectories are plausible. Because Label Advocates are overwhelmingly wholesalers, their comprehensive sustainability criteria partly reflect derived demand, an anticipation of downstream retailer and consumer preferences. If those preferences plateau, the economic rationale for maintaining stringent multi-attribute sourcing standards could weaken, and some Label Advocates might converge toward the more selective, certification-focused posture of Market-Driven Buyers, contracting the segment. Alternatively, the segment may prove resilient if its sourcing standards are anchored in durable factors (brand differentiation, institutional procurement commitments, or regulatory expectations) that do not depend on continued growth in consumer demand. Our cross-sectional data cannot adjudicate between these paths; doing so would require longitudinal observation of whether segment membership is stable as market conditions evolve. This reinforces the value of periodically re-estimating buyer segments rather than treating them as fixed, and we identify it as a priority for future research.
Future research should extend this work in several directions. Longitudinal studies tracking buyer preferences and sourcing behaviors over time could assess whether segments remain stable or shift as certification systems evolve and consumer awareness increases. Understanding the constraints preventing Skeptics from valuing labels, whether due to knowledge gaps, budget pressures, operational complexity, or competitive positioning, could reveal strategies to expand sustainable sourcing beyond current niche markets. Examining how label preferences vary by product category (e.g., fruits vs. vegetables vs. grains) would inform crop-specific market development strategies. Additional research on the mechanisms linking label preferences to farm-level outcomes would strengthen the understanding of market transformation pathways. Finally, comparative research examining buyer segmentation across regions, countries, and supply chain positions would assess whether the three-cluster structure identified here represents a generalizable pattern or reflects specific U.S. market conditions. Understanding how buyer preferences for sustainability labels vary internationally could inform strategies for producers participating in export markets and for multinational firms managing diverse procurement across regions.
Data availability statement
Data will be made available on request.
Acknowledgments
This research is part of ‘#DiverseCornBelt (#DCB): Enhancing rural resilience through landscape diversity in the Midwest’ and is supported by Agriculture and Food Research Initiative Competitive Grant No. 2021-68012-35896 from the U.S. Department of Agriculture’s National Institute of Food and Agriculture. Project website: www.diversecornbelt.org. The authors used Claude Sonnet 4.6 (Anthropic, https://claude.ai) during manuscript preparation on November 11, 2025, to assist with grammar and spelling checks and during the revision in May 20, 2026, to assist with grammar and spelling checks for the response to reviewers and corresponding revisions to the manuscript. The AI tool was not used to generate scientific findings, conduct data analysis, interpret results, or generate references or literature review content. All AI-assisted text was reviewed, edited, and approved by the authors, who take full responsibility for the content of the published article.
Author contribution
Conceptualization: A.P.T.; Data curation: A.P.T.; Formal analysis: A.P.T., A.H.; Funding acquisition: A.P.T.; Investigation: A.P.T.; Methodology: A.P.T., A.H.; Project administration: A.P.T.; Resources: A.P.T.; Supervision: A.P.T., J.M.R.M.; Validation: A.P.T., J.M.R.M., A.D.S.; Writing—original draft: A.P.T., A.H., J.M.R.M., A.D.S.; Writing—review and editing: A.P.T.
Competing interests
The authors declare that they have no competing interests, financial or otherwise, that could have influenced the work reported in this manuscript.
Ethics statement
The authors have nothing to report.




 Open access

