1 Introduction
Steady, uniform flow incident on a circular cylinder at low Reynolds number is a classical problem in fluid mechanics, having both fundamental and practical significance because it demonstrates the phenomena of separation, vortex shedding and transition to turbulence. Of these phenomena vortex shedding and transition to turbulence are of particular interest because they can lead to changes in the forces on the cylinder, as well as mixing and momentum transfer in the wake.
For an isolated cylinder, the occurrence of each of these phenomena depends solely on the Reynolds number
 $Re$
(
 $=\,UD/\unicode[STIX]{x1D708}$
), where
 $U$
is the approaching flow velocity,
 $D$
is the cylinder diameter and
 $\unicode[STIX]{x1D708}$
is the fluid viscosity. However, in any practical scenario, additional parameters will influence separation, vortex shedding and transition to turbulence. One example is the presence of a plane boundary, located so that the long axis of the cylinder is at some perpendicular distance
 $G+D/2$
from the wall, where
 $G$
is the gap between the cylinder and plane boundary. In this arrangement the plane boundary may be representative, for example, of the ‘seabed’ or ‘ground’ in practical applications involving bluff bodies such as pipelines.
Because of its practical relevance, the problem of flow past a circular cylinder near a stationary wall has been investigated extensively. An important feature of this problem is that a boundary layer is developed near the stationary wall, which complicates the local flow around the cylinder. Consequently, the flow near the cylinder is dependent on not only the Reynolds number
 $Re$
and non-dimensional gap ratio
 $G^{\ast }$
(
 $=G/D$
), but also the properties of the boundary layer. Based on two-dimensional (2D) direct numerical simulations (DNS) which employed the Blasius boundary layer profile at the inlet, Lei et al. (Reference Lei, Cheng, Armfield and Kavanagh2000) found that the critical
 $G^{\ast }$
for vortex shedding suppression was 0.2 at
 $Re\geqslant 800$
(with a boundary layer thickness
 $\unicode[STIX]{x1D6FF}/D$
at the location of the cylinder of approximately 0.5), but increased to 0.6 at
 $Re=200$
(
 $\unicode[STIX]{x1D6FF}/D=0.9$
) and 1.0 at
 $Re=100$
(
 $\unicode[STIX]{x1D6FF}/D=1.2$
). Thapa et al. (Reference Thapa, Zhao, Zhou and Cheng2014) studied the three-dimensional (3D) flow structure at
 $Re=500$
and both
 $G^{\ast }=0.4$
and 0.8 by adopting the logarithmic law of wall for the inlet flow profile, and found that the streamwise vortices (a representation of the flow three dimensionality) were much weaker than those for an isolated cylinder. However, it is worth noting that even by adopting a prescribed boundary layer profile (e.g. Blasius or logarithmic profile) at the inlet, the boundary layer profile may still develop with distance from the inlet, which complicates further the flow around the cylinder.
Because of the dependence of these earlier results to the boundary layer profile, in addition to
 $Re$
and
 $G^{\ast }$
, the parameter space for numerical simulations is large. Consequently, in the present work it is assumed that the boundary moves at the same speed as the upstream flow (or equally that the body is moved in still fluid parallel to a stationary boundary). This arrangement avoids any upstream boundary layer, such that the flow is only dependent on
 $Re$
and
 $G^{\ast }$
. This allows for a more systematic study focussing on the ‘near-wall effect’.
Several different studies have focused on the flow around a circular cylinder near a moving wall. For example, by towing a circular cylinder close to a stationary wall at
 $Re=170$
(Taneda Reference Taneda1965) and
 $Re=3550$
(Zdravkovich Reference Zdravkovich1985), Taneda (Reference Taneda1965) and Zdravkovich (Reference Zdravkovich1985) observed alternate vortex shedding at
 $G^{\ast }=0.6$
, whereas only a single row of vortices was developed at
 $G^{\ast }=0.1$
. Huang & Sung (Reference Huang and Sung2007) performed 2D DNS for a circular cylinder near a moving wall for
 $G^{\ast }\geqslant 0.1$
and
 $Re=200$
–500, and reported variations of the pressure and force coefficients with
 $G^{\ast }$
and
 $Re$
. They also reported that at
 $Re=300$
alternate vortex shedding was suppressed at
 $G^{\ast }\leqslant 0.28$
, and a single vortex row at the upper side of the cylinder dominated the flow for
 $G^{\ast }\leqslant 0.28$
. Yoon et al. (Reference Yoon, Lee, Seo and Park2010) carried out 2D DNS for
 $G^{\ast }\geqslant 0.1$
and
 $Re=60$
–200, and investigated variations of the pressure and force coefficients with
 $G^{\ast }$
and
 $Re$
. Rao et al. (Reference Rao, Thompson, Leweke and Hourigan2013b
) showed that while the 2D unsteady wake at larger
 $G^{\ast }$
is characterized by the formation of the classical Kármán vortex streets, vortex shedding at smaller
 $G^{\ast }$
(e.g.
 $G^{\ast }=0.1$
or 0.01) is characterized by the pairing of the negatively signed separating shear layer from the top of the cylinder and the positively signed vortex from the boundary layer at the wall. It has been revealed from the above studies that without the upstream boundary layer effect vortex shedding can at least be observed at a
 $G^{\ast }$
of as low as 0.1. However, the physical mechanisms responsible for the variations of the hydrodynamic forces and onset point of vortex shedding, on the basis of the flow characteristics at different
 $G^{\ast }$
and
 $Re$
, have not been addressed in detail.
Stewart et al. (Reference Stewart, Thompson, Leweke and Hourigan2010), through a linear stability analysis, observed a wake transition sequence of ‘2D steady
 $\rightarrow$
3D steady
 $\rightarrow$
3D unsteady’ for flow past a circular cylinder near a moving wall with
 $G^{\ast }=0.005$
, rather than the sequence of ‘2D steady
 $\rightarrow$
2D unsteady
 $\rightarrow$
3D unsteady’ for the case of an isolated cylinder (Williamson Reference Williamson1996). By adopting a similar linear stability analysis, Rao et al. (Reference Rao, Thompson, Leweke and Hourigan2013b
, Reference Rao, Thompson, Leweke and Hourigan2015) obtained critical
 $Re$
for 2D and 3D wake transitions (denoted as
 $Re_{cr2D}$
and
 $Re_{cr3D}$
, respectively) for flow past a circular cylinder near a moving wall for
 $G^{\ast }\geqslant 0.005$
. Rao et al. (Reference Rao, Thompson, Leweke and Hourigan2013b
) also observed the transition sequence of ‘2D steady
 $\rightarrow$
3D steady
 $\rightarrow$
3D unsteady’ for
 $G^{\ast }\leqslant 0.22$
, and the transition sequence of ‘2D steady
 $\rightarrow$
2D unsteady
 $\rightarrow$
3D unsteady’ for larger gap ratios. However, the distinctive transition sequence for
 $G^{\ast }\leqslant 0.22$
has not been studied in a great detail in terms of the transition mechanism and the actual nonlinear 3D flow structures (which may be different from the well-known Mode A and Mode B flow structures observed by Williamson (Reference Williamson1996) for the case of an isolated cylinder).
In light of the earlier works, this paper investigates further the flow structure and wake transition for flow past a circular cylinder near a moving wall by using 2D and 3D DNS. Based on the analysis of the 2D flow characteristics at various
 $G^{\ast }$
and
 $Re$
(§ 4.1), the physical mechanisms for the variations of the hydrodynamic forces and
 $Re_{cr2D}$
are discussed in §§ 4.2 and 4.3, respectively. The distinctive 3D steady and 3D unsteady flow structures for
 $G^{\ast }\leqslant 0.22$
and the transition mechanisms are studied in § 5.
2 Numerical model
2.1 Numerical method
Numerical simulations have been carried out with OpenFOAM (available from www.openfoam.org) to solve the continuity and incompressible Navier–Stokes equations:
 $$\begin{eqnarray}\displaystyle & \displaystyle \frac{\unicode[STIX]{x2202}u_{i}}{\unicode[STIX]{x2202}x_{i}}=0, & \displaystyle\end{eqnarray}$$
 $$\begin{eqnarray}\displaystyle & \displaystyle \frac{\unicode[STIX]{x2202}u_{i}}{\unicode[STIX]{x2202}t}+u_{j}\frac{\unicode[STIX]{x2202}u_{i}}{\unicode[STIX]{x2202}x_{j}}=-\frac{1}{\unicode[STIX]{x1D70C}}\frac{\unicode[STIX]{x2202}p}{\unicode[STIX]{x2202}x_{i}}+\unicode[STIX]{x1D708}\frac{\unicode[STIX]{x2202}^{2}u_{i}}{\unicode[STIX]{x2202}x_{j}\unicode[STIX]{x2202}x_{j}}, & \displaystyle\end{eqnarray}$$
where
 $(x_{1},x_{2},x_{3})=(x,y,z)$
are Cartesian coordinates,
 $u_{i}$
is the velocity component in the direction
 $x_{i}$
,
 $t$
is time and
 $p$
is pressure. The same numerical approach used in Jiang et al. (Reference Jiang, Cheng, Draper, An and Tong2016a
) is adopted here. Specifically, the finite volume method (FVM) and the pressure implicit with splitting of operators (PISO) algorithm (Issa Reference Issa1986) are used to solve the equations. The convection, diffusion and time derivative terms are discretized using the fourth-order cubic scheme, the second-order linear scheme and a blended scheme consisting of the second-order Crank–Nicolson scheme and a first-order Euler implicit scheme, respectively.
2.2 Boundary and initial conditions
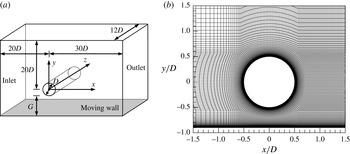
As shown in figure 1(a), a hexahedral computational domain of
 $(L_{x},L_{y},L_{z})=(50D,G+20.5D,12D)$
, with
 $L_{x}$
,
 $L_{y}$
and
 $L_{z}$
being the domain sizes in the
 $x$
-,
 $y$
- and
 $z$
-directions, respectively, is adopted for the simulations. This domain size is determined based on both 2D and 3D domain size dependence studies for an isolated cylinder presented in Jiang et al. (Reference Jiang, Cheng, Draper, An and Tong2016a
).
(a) Schematic model of the computational domain, and (b) close-up view of the 2D mesh near the cylinder with
 $G^{\ast }=0.4$
.

The boundary conditions are specified as follows. At the inlet boundary and the bottom moving wall, a uniform flow velocity
 $U$
is specified in the
 $x$
-direction. At the outlet, the Neumann boundary condition (i.e. zero normal gradient) is applied for the velocity, and the pressure is specified as a reference value of zero. A symmetry boundary condition is applied at the top boundary, while a periodic boundary condition is employed at the two lateral boundaries perpendicular to the cylinder span. A non-slip boundary condition is applied on the cylinder surface.
At the start of each simulation, the internal flow is stationary. The flow three dimensionality in the FVM simulations is triggered by small-scale numerical disturbances in the computational domain (mainly due to skewed mesh elements; see also Jiang et al.
Reference Jiang, Cheng, Tong, Draper and An2016b
) in a similar way to the introduction of small-scale spanwise disturbances to the initial flow field for the spectral element method (e.g. Henderson Reference Henderson1997; Thompson, Leweke & Williamson Reference Thompson, Leweke and Williamson2001). For the present 3D DNS, the amplitude of the spanwise disturbance observed in the computational domain is of the order of
 $10^{-4}U$
, which would not influence the simulation results noticeably.
2.3 Mesh dependence study
The mesh topology for the present study is modified from the ‘standard mesh’ for flow past an isolated cylinder reported in Jiang et al. (Reference Jiang, Cheng, Draper, An and Tong2016a
). However, the mesh pattern on the wall side of the cylinder is slightly different from the mesh for an isolated cylinder. Therefore, the dependence of the numerical results on the computational mesh resolution in the plane perpendicular to the cylinder span (the
 $x$
–
 $y$
plane) is revisited.
For the standard 2D meshes adopted here, the cylinder perimeter is discretized with 132 nodes for
 $G^{\ast }\geqslant 1.5$
and 160 nodes for
 $G^{\ast }<1.5$
(due to a slight change of the mesh topology at smaller gap ratios). The height of the first layer of mesh next to the moving wall and next to the cylinder surface is approximately
 $0.001D$
. The cell expansion ratio in the whole domain is kept below 1.1. To capture detailed wake flow structures, a relatively high mesh resolution is used in the cylinder wake by specifying a constant mesh size along the
 $x$
-direction for
 $x/D>0.7$
. Figure 1(b) shows a close-up view of the mesh near the cylinder with a gap ratio of
 $G^{\ast }=0.4$
.
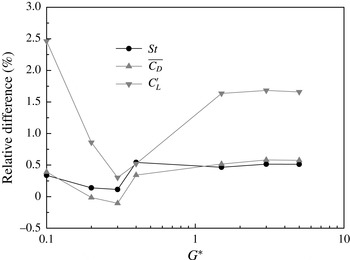
Relative differences of hydrodynamic forces at
 $Re=300$
by using the refined and standard 2D meshes.

The adequacy of the standard 2D mesh resolution for each case is examined by doubling the amount of cells in both directions. The total number of cells after mesh refinement is four times of that employed in the standard mesh. Specifically, the number of cells around the cylinder is doubled, while the height of the first layer of mesh next to the moving wall and the radial size of the first layer of mesh next to the cylinder surface are halved. The mesh resolution dependence is quantified by examining the influence of the mesh refinement on the drag and lift force coefficients (
 $C_{D}$
and
 $C_{L}$
) and Strouhal number
 $St$
, which are defined as follows:
 $$\begin{eqnarray}\displaystyle & \displaystyle C_{D}=F_{D}/(\unicode[STIX]{x1D70C}DU^{2}L_{z}/2), & \displaystyle\end{eqnarray}$$
 $$\begin{eqnarray}\displaystyle & \displaystyle C_{L}=F_{L}/(\unicode[STIX]{x1D70C}DU^{2}L_{z}/2), & \displaystyle\end{eqnarray}$$
 $$\begin{eqnarray}\displaystyle & \displaystyle St=f_{L}D/U, & \displaystyle\end{eqnarray}$$
where
 $F_{D}$
and
 $F_{L}$
are the integrated drag force and lift force on the cylinder, respectively,
 $\unicode[STIX]{x1D70C}$
is fluid density and
 $f_{L}$
is the frequency of the fluctuating lift force. The time-averaged drag and lift coefficients are denoted as
 $\overline{C_{D}}$
and
 $\overline{C_{L}}$
, respectively. The root-mean-square lift coefficient
 $C_{L}^{\prime }$
is defined as:
 $$\begin{eqnarray}C_{L}^{\prime }=\sqrt{\frac{1}{N}\mathop{\sum }_{i=1}^{N}(C_{L,i}-\overline{C_{L}})^{2}},\end{eqnarray}$$
where
 $N$
is the number of values in the time history of
 $C_{L}$
.
The 2D mesh resolution dependence study is carried out at
 $Re=300$
(the highest
 $Re$
adopted in this study) for various gap ratios. For each case, the relative differences in
 $St$
,
 $\overline{C_{D}}$
, and
 $C_{L}^{\prime }$
using the refined and standard meshes are shown in figure 2. The variations of
 $St$
,
 $\overline{C_{D}}$
, and
 $C_{L}^{\prime }$
after mesh refinement are, respectively, within 0.6 %, 0.6 % and 2.5 % for all of the cases. Because of this close agreement the standard 2D meshes are adopted hereafter.
The standard 3D mesh is formed by replicating the standard 2D mesh along the
 $z$
-axis, resulting in an identical mesh resolution in all planes perpendicular to the cylinder. According to the 3D mesh dependence study for an isolated cylinder presented in Jiang et al. (Reference Jiang, Cheng, Draper, An and Tong2016a
), the spanwise cell and domain lengths are chosen as
 $0.1D$
and
 $12D$
, respectively. Based on the standard 3D mesh for an isolated cylinder and a refined 3D mesh with four times the cell number in the
 $x$
–
 $y$
plane, the
 $Re_{cr3D}$
are 193.2 and 190.0, respectively. The latter value is extremely close to the linear stability analysis result of 190.2 (
 $\pm 0.02$
) by Posdziech & Grundmann (Reference Posdziech and Grundmann2001) for an isolated cylinder. However, such mesh refinement would increase the computational cost by a factor of larger than eight, which is impractical considering the large amount of cases to be simulated in this study. Therefore, the standard 3D mesh is used in the present study.
3 Critical
 $Re$
for wake instability

The present numerical model has been validated in Jiang et al. (Reference Jiang, Cheng, Draper, An and Tong2016a
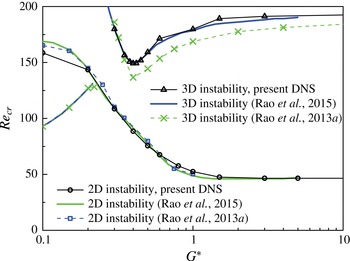
) by comparing numerical results of wake transition in flow past an isolated circular cylinder with the experimental results reported in Williamson (Reference Williamson1996). For the work undertaken in this paper, further validation is performed for the case of flow past a circular cylinder close to a moving wall. Figure 3 shows the predicted
 $Re_{cr2D}$
and
 $Re_{cr3D}$
values for various gap ratios (refer to figures 11
a and 11
b for examples of the 2D steady and unsteady flows at
 $Re$
just below and above
 $Re_{cr2D}$
, respectively, and figure 20 for examples of the 3D flows at
 $Re>Re_{cr3D}$
).
Critical
 $Re$
for 2D and 3D wake instabilities for various gap ratios.

In figure 3 the
 $Re_{cr2D}$
for each gap ratio is calculated to a resolution of
 $\unicode[STIX]{x0394}Re=1$
. The time history of the lift coefficient is used to determine
 $Re_{cr2D}$
. For example, at
 $G^{\ast }=0.4$
the lift coefficient converges to a constant value at
 $Re=88$
whereas regular periodic fluctuations of the lift coefficient are observed at
 $Re=89$
, which suggests that the 2D instability occurs at
 $Re_{cr2D}=88.5$
(
 $\pm 0.5$
). As shown in figure 3, the
 $Re_{cr2D}$
values predicted by the present DNS are in good agreement with the numerical results by Rao et al. (Reference Rao, Thompson, Leweke and Hourigan2013b
, Reference Rao, Thompson, Leweke and Hourigan2015).
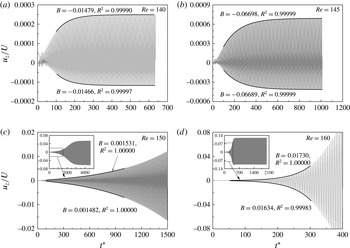
Time histories of the spanwise velocity sampled at
 $(x/D,y/D,z/D)=(3.0,0.5,6.0)$
and exponential fitting of the upper and lower envelopes.

The
 $Re_{cr3D}$
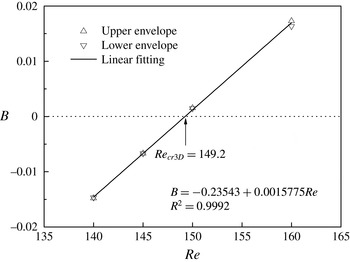
for each gap ratio in figure 3 is obtained by analysing the transient growth/decay rates of the spanwise velocity amplitude at a sampling point in the near wake of the cylinder. This is illustrated for
 $G^{\ast }=0.4$
in figure 4, which shows the time histories of the spanwise velocity recorded at
 $(x/D,y/D,z/D)=(3.0,0.5,6.0)$
for
 $Re$
from 140 to 160 (with
 $t^{\ast }(=\,Ut/D)$
being the non-dimensional flow time). The upper and lower envelopes of the transient
 $u_{z}$
curves are then fitted with an exponential function:
 $$\begin{eqnarray}u_{z}/U=A\exp (Bt^{\ast })+C,\end{eqnarray}$$
where
 $A$
,
 $B$
and
 $C$
are curve fitting coefficients. It is seen in figure 4 that after discarding the initial oscillations as well as the further 3D instabilities for
 $Re>Re_{cr3D}$
, the coefficient of determination (denoted as
 $R^{2}$
) for the fitted curves is very close to 1. It is evident from the growth/decay rate
 $B$
shown in figure 4 that
 $B<0$
and
 $B>0$
correspond to exponential decay and growth, respectively. A linear relationship between
 $B$
and
 $Re$
is obtained in figure 5, and
 $Re_{cr3D}=149.2$
is interpolated at
 $B=0$
. For each gap ratio the simulations are carried out for 3 to 4
 $Re$
values to ensure that a good correlation between
 $B$
and
 $Re$
is achieved.
Relationship between the growth/decay rate
 $B$
and the Reynolds number.

As shown in figure 3, the
 $Re_{cr3D}$
values predicted by the present DNS are in good agreement with the linear stability analysis results by Rao et al. (Reference Rao, Thompson, Leweke and Hourigan2015). The results by Rao et al. (Reference Rao, Thompson, Leweke and Hourigan2015) are believed to be improved from those in Rao et al. (Reference Rao, Thompson, Leweke and Hourigan2013b
) (also shown in figure 3) since it was noted in Rao et al. (Reference Rao, Thompson, Leweke and Hourigan2013b
) that the use of a relatively small computational domain size in that study could affect the accuracy of
 $Re_{cr3D}$
by
 ${\sim}15\,\%$
.
According to the linear stability analysis results by Rao et al. (Reference Rao, Thompson, Leweke and Hourigan2013b
), the most unstable spanwise wavelength for the secondary instability is very close to
 $4.0D$
at
 $G^{\ast }=0.32$
–0.35 and
 $G^{\ast }\geqslant 2.0$
, but reduces to a minimum value of approximately
 $3.65D$
at
 $G^{\ast }=0.5$
–0.75. The constant spanwise domain length of
 $12D$
used in the present numerical model is not always an integer multiple of the most unstable spanwise wavelength at some particular gap ratios, which may restrict the development of the secondary instability to some extent and result in an over-prediction of
 $Re_{cr3D}$
. However, a test run at
 $G^{\ast }=0.5$
by adopting a spanwise domain length of
 $11D$
(approximately 3 times of the most unstable spanwise wavelength) confirms only a slight drop of
 $Re_{cr3D}$
from 159.2 to 157.7. Since the influence of the spanwise wavelength (based on the choice of the spanwise domain length) on the prediction of
 $Re_{cr3D}$
is less than 1 %, a constant spanwise domain length of
 $12D$
is still adopted in this study.
The present 3D DNS results for
 $G^{\ast }<0.22$
are not presented in figure 3. This is because a different wake transition sequence of ‘2D steady
 $\rightarrow$
3D steady
 $\rightarrow$
3D unsteady’ is observed in the range of
 $G^{\ast }\leqslant 0.22$
(Rao et al.
Reference Rao, Thompson, Leweke and Hourigan2013b
). For
 $G^{\ast }\leqslant 0.22$
the stability analysis by Rao et al. (Reference Rao, Thompson, Leweke and Hourigan2013b
) was performed on a steady base flow and the
 $Re_{cr3D}$
appeared to be lower than the
 $Re_{cr2D}$
(through 2D calculations) as shown in figure 3. Since the
 $Re_{cr2D}$
values for
 $G^{\ast }\leqslant 0.22$
are calculated with 2D DNS, they may not be reliable in representing the onset of unsteady flow because the flow is already in a 3D state at
 $Re<Re_{cr2D}$
. The present DNS results for
 $G^{\ast }\leqslant 0.22$
will be studied separately in § 5.
4 2D near-wall effect
As shown in figure 3, for
 $G^{\ast }\geqslant 3.0$
the
 $Re_{cr2D}$
and
 $Re_{cr3D}$
values are almost independent of
 $G^{\ast }$
. The moving wall in proximity to the cylinder starts to influence
 $Re_{cr2D}$
and
 $Re_{cr3D}$
at
 $G^{\ast }\leqslant 1.5$
. Three principal physical mechanisms are responsible for the variation of flow around the cylinder with wall proximity. One mechanism involves the blockage or restriction to the flow around the cylinder due to the proximity of the wall. The confinement of the near-wake flow by the plane wall forms another mechanism. The third mechanism involves shear layers formed just above the moving wall due to the local acceleration or deceleration of flow near the cylinder. The above three mechanisms will be explained based on the 2D flow characteristics, and the corresponding variation of
 $Re_{cr2D}$
with
 $G^{\ast }$
will be investigated.
4.1 Flow characteristics
Firstly, the blockage effect is quantified by examining the variation of the flow rate around the cylinder at different
 $G^{\ast }$
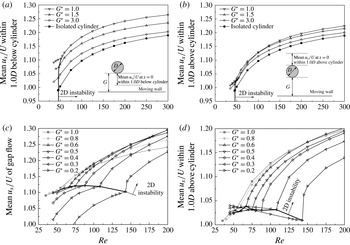
. Figure 6 shows the mean (averaged over the time and sampling length) streamwise velocity along the
 $y$
-direction at
 $x=0$
for various
 $Re$
and
 $G^{\ast }$
. As
 $G^{\ast }$
reduces from 19.5 (representing an isolated cylinder) to 1.0, an obvious increase in the mean streamwise velocity within
 $1.0D$
below the cylinder is observed (figure 6
a), while the increase in the mean streamwise velocity within
 $1.0D$
above the cylinder (figure 6
b) is smaller. In particular, at approximately the onset of 2D instability of
 $Re\sim 50$
the mean streamwise velocities within
 $1.0D$
above the cylinder for
 $G^{\ast }=3.0$
–1.0 are almost unchanged. Overall, for
 $G^{\ast }\geqslant 1.0$
, the total flow rate passing within the vicinity of the cylinder increases with decreasing
 $G^{\ast }$
, with a large percentage of the increase taking place in the gap.
Mean streamwise velocity along the
 $y$
-direction at
 $x=0$
: (a) within
 $1.0D$
below the cylinder for
 $G^{\ast }\geqslant 1.0$
, (b) within
 $1.0D$
above the cylinder for
 $G^{\ast }\geqslant 1.0$
, (c) over the entire gap length for
 $G^{\ast }\leqslant 1.0$
, and (d) within
 $1.0D$
above the cylinder for
 $G^{\ast }\leqslant 1.0$
.

For
 $G^{\ast }\leqslant 1.0$
, the flow rate passing within the vicinity of the cylinder generally decreases with decreasing
 $G^{\ast }$
. At the onset point for 2D instability
 $Re_{cr2D}$
, there exists a sharp increase in the mean streamwise velocity within the gap as well as within
 $1.0D$
above the cylinder (figure 6
c,d). For
 $Re$
close to
 $Re_{cr2D}$
, the flow rate in the gap generally decreases with decreasing
 $G^{\ast }$
(figure 6
c). For the mean flow within
 $1.0D$
above the cylinder, a decrease of the flow rate with decreasing
 $G^{\ast }$
is observed for
 $Re$
in a range above
 $Re_{cr2D}$
(figure 6
d). For
 $Re<Re_{cr2D}$
, however, the mean flow rate remains in a similar level (a monotonic decreasing trend is not observed). This is mainly attributed to the shear layer developed above the moving wall which leads to a redistribution of the velocity profile.
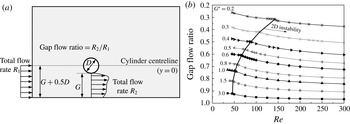
As discussed above, with the decrease of the gap ratio, the total flow rate around the cylinder first increases and then decreases. However, the gap flow ratio, defined as the ratio between the total gap flow rate and the total free-stream flow rate below the cylinder centreline
 $y=0$
(figure 7
a), decreases monotonically with decrease of the gap ratio. Figure 7(b) shows the variation of the gap flow ratio with
 $Re$
and
 $G^{\ast }$
. The results are determined from the mean flow field. It is apparent that for an isolated cylinder, the gap flow ratio is always equal to 1.0. With the decrease of the gap ratio, the incoming flow below the cylinder centreline is partly deflected to the upper side of the cylinder, leading to a gap flow ratio of less than 1.0 (figure 7
b). With the decrease of the gap ratio or
 $Re$
, a larger percentage of the flow is deflected from below the cylinder centreline to the upper side of the cylinder. This is because when
 $G^{\ast }$
or
 $Re$
is reduced, the shear layer in the gap becomes more vital in restricting the flow through the gap, and it is easier for the flow to pass through the upper side of the cylinder where less restriction is present.
(a) Sketch of the definition of the gap flow ratio, and (b) variation of the gap flow ratio with
 $Re$
and
 $G^{\ast }$
.

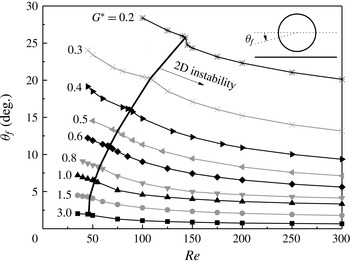
The redistribution of the approaching flow in the vicinity of the cylinder leads to a downward movement of the front stagnation point and an upward shift of the recirculation zone behind the cylinder. Figure 8 shows the angular position of the front stagnation point
 $\unicode[STIX]{x1D703}_{f}$
with respect to the front point of the cylinder. The front stagnation point is determined from the mean flow field. It should be noted that for an isolated cylinder, the front stagnation point based on the symmetrical mean flow field is always at the front point of the cylinder. As the gap ratio is reduced and the flow becomes more asymmetrical, the front stagnation point moves towards the plane wall, and this phenomenon is more pronounced with decrease of
 $Re$
(figure 8). It is seen that figures 8 and 7(b) share similar features. With the decrease of
 $Re$
or
 $G^{\ast }$
, a larger percentage of the flow is deflected from below the cylinder centreline to the upper side of the cylinder, and the front stagnation point exhibits a downward movement accordingly.
Angular position of the front stagnation point with respect to the front point of the cylinder.

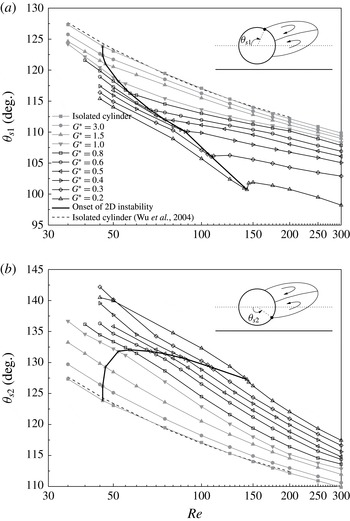
The upward shift of the recirculation zone is examined through the variations of the separation angles with
 $Re$
and
 $G^{\ast }$
(figure 9). The mean flow field is used as before to determine the separation points. In figure 9 the logarithmic coordinate is used for the
 $x$
-axis for a better view of the variation trends at lower
 $Re$
values. As shown in figure 9, for the case of an isolated cylinder, the separation angles predicted by the present DNS agree well with the empirical formula given by Wu et al. (Reference Wu, Wen, Yen, Weng and Wang2004). It is well known that for an isolated cylinder, boundary layer separation points move upstream with increase of
 $Re$
. This is also generally valid as the cylinder approaches the moving wall (figure 9). On the other hand, with the decrease of
 $G^{\ast }$
, the upper separation point moves upstream while the lower one moves downstream (figure 9), which indicates that the recirculation zone is shifted upwards.
Variations of the separation angles with
 $Re$
and
 $G^{\ast }$
: (a) upper separation point, and (b) lower separation point.

4.2 Hydrodynamic forces
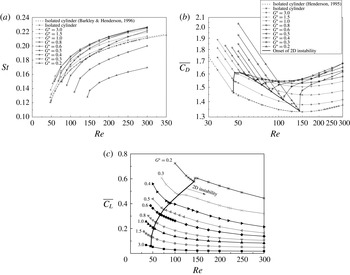
The variations of the Strouhal number and force coefficients with
 $Re$
and
 $G^{\ast }$
are examined. Figure 10(a) shows the
 $St$
–
 $Re$
relationships for different gap ratios. For each gap ratio, an increase of
 $Re$
leads to an increase of
 $St$
, which is consistent with the increase of the non-dimensional mean flow rates just above and below the cylinder for
 $Re>Re_{cr2D}$
(figure 6). On the other hand,
 $St$
generally increases as
 $G^{\ast }$
decreases from 19.5 to 1.0–0.8, and decreases as
 $G^{\ast }$
decreases further. This is also consistent with the variation of the mean flow rate around the cylinder with
 $G^{\ast }$
, where the maximum flow rate is observed at
 $G^{\ast }=1.0$
–0.8 (figure 6).
Variation of the 2D hydrodynamic forces with
 $Re$
and
 $G^{\ast }$
: (a) Strouhal number, (b) mean drag coefficient, and (c) mean lift coefficient.

Figure 10(b) shows the variation of the mean drag coefficient with
 $Re$
and
 $G^{\ast }$
. For an isolated cylinder, Henderson (Reference Henderson1995) obtained a power law
 $\overline{C_{D}}-Re$
relationship for
 $Re<Re_{cr2D}$
, which is well reproduced by the present DNS as shown in figure 10(b). Similar trends are also observed for the case of a cylinder near a moving wall, as shown by the linear decreasing trend of the
 $\overline{C_{D}}-Re$
curve in the log–log space (figure 10
b). The same trend was also observed by Rao et al. (Reference Rao, Thompson, Leweke and Hourigan2013b
) from a separate study. Beyond the onset of 2D instability, different trends are observed for different gap ratios. This is explained by separating the drag force into the viscous and pressure components. Beyond the point of
 $Re_{cr2D}$
, the viscous drag continues to decrease while the pressure drag starts to increase (refer to Henderson (Reference Henderson1995) for the case of an isolated cylinder). For
 $G^{\ast }\geqslant 1.5$
, the drag coefficient continues to decrease beyond
 $Re_{cr2D}$
until
 $Re\sim 150$
, as the decrease of the viscous drag dominates the increase of the pressure drag in this range. For
 $G^{\ast }\leqslant 1.0$
, a local minimum is observed at the point of
 $Re_{cr2D}$
. The local minimum becomes more obvious as
 $G^{\ast }$
decreases. This is because at a higher
 $Re_{cr2D}$
(under a smaller
 $G^{\ast }$
), the influence from the viscous force becomes smaller, and the total drag force is dominated by the pressure drag, starting from the sudden increase of the pressure drag at
 $Re_{cr2D}$
. Beyond the local minimum of the drag coefficient at
 $Re_{cr2D}$
, a slight decrease of the drag coefficient is observed in a small range below
 $Re\sim 150$
for
 $G^{\ast }\geqslant 0.6$
, whereas a continuous increase of the drag coefficient is observed for
 $G^{\ast }\leqslant 0.5$
. This is also due to the combined behaviour of the viscous drag and pressure drag. For all the gap ratios considered here, the drag coefficient increases with increase of
 $Re$
beyond
 $Re\sim 150$
, as the viscous drag becomes too small to affect the general trend set by the pressure drag.
The variation of the mean lift coefficient with
 $Re$
and
 $G^{\ast }$
is shown in figure 10(c). The variation trend is similar to that of the gap flow ratio (figure 7
b) and
 $\unicode[STIX]{x1D703}_{f}$
(figure 8), since the mean lift force is generated by the asymmetric flow distribution between the upper and lower sides of the cylinder. However, an obvious difference is observed at the
 $Re_{cr2D}$
point at
 $G^{\ast }=0.2$
, where a local increase is observed for the mean lift coefficient whereas a local drop is observed for the gap flow ratio and
 $\unicode[STIX]{x1D703}_{f}$
. This is because a significant local minimum of the mean drag coefficient occurs at the
 $Re_{cr2D}$
of
 $G^{\ast }=0.2$
(figure 10
b). By examining the force vector angle
 $\arctan (\overline{C_{L}}/\overline{C_{D}})$
instead of
 $\overline{C_{L}}$
, it is found that a local drop is observed at this point (omitted here for simplicity).
4.3 Variation of
$Re_{cr2D}$
with
$G^{\ast }$


The influence of the flow characteristics on the variation of
 $Re_{cr2D}$
with
 $G^{\ast }$
is now analysed. It is seen in figure 3 that the
 $Re_{cr2D}$
value increases monotonically as
 $G^{\ast }$
is reduced from 3.0. Judging from the variation of the mean flow rate around the cylinder (figure 6), it is believed that one of the main causes for the increase in
 $Re_{cr2D}$
for
 $G^{\ast }\leqslant 1.0$
(figure 3) is due to the reduction of the mean flow rate around the cylinder with decreasing
 $G^{\ast }$
. However, for
 $G^{\ast }\geqslant 1.0$
the increase of the mean flow rate around the cylinder due to the decrease of
 $G^{\ast }$
(figure 6
a,b) does not manifest a decrease in
 $Re_{cr2D}$
in figure 3. This is because the variation of
 $Re_{cr2D}$
with
 $G^{\ast }$
is also affected by other contributing factors which may stabilize the flow and delay the
 $Re_{cr2D}$
at all of the gap ratios.
A second contributing factor involves the shear layers developed on the moving wall. Due to the presence of the moving wall, the streamwise velocity at the moving wall is constrained to a fixed value equal to the free-stream velocity
 $U$
. Due to the local acceleration or deceleration of flow near the cylinder, there exists a deviation between the internal flow velocity and the velocity at the moving wall (
 $=U$
), and this results in the development of shear layers on the moving wall. This is further examined with two typical cases with
 $(G^{\ast },Re)=(0.4,88)$
and
 $(G^{\ast },Re)=(0.4,90)$
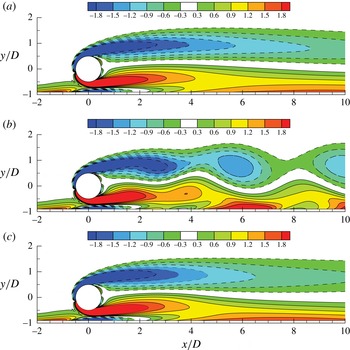
, where the former one is in the 2D steady regime while the latter one is in the 2D unsteady regime with periodic vortex shedding. Figure 11(a,b) shows the vorticity contours of the above two cases, where the vorticity
 $\unicode[STIX]{x1D714}_{z}$
is defined in a non-dimensional form:
 $$\begin{eqnarray}\unicode[STIX]{x1D714}_{z}=\left(\frac{\unicode[STIX]{x2202}u_{y}}{\unicode[STIX]{x2202}x}-\frac{\unicode[STIX]{x2202}u_{x}}{\unicode[STIX]{x2202}y}\right)\frac{D}{U}.\end{eqnarray}$$
For the 2D unsteady case at
 $(G^{\ast },Re)=(0.4,90)$
, the vorticity contours of the time-averaged flow field are also shown in figure 11(c), which are found to be quite similar to the vorticity contours of the 2D steady flow at
 $(G^{\ast },Re)=(0.4,88)$
shown in figure 11(a).
(a) Vorticity contours of the 2D steady flow at
 $(G^{\ast },Re)=(0.4,88)$
, (b) vorticity contours of the instantaneous 2D unsteady flow at
 $(G^{\ast },Re)=(0.4,90)$
and (c) vorticity contours of the time-averaged 2D flow at
 $(G^{\ast },Re)=(0.4,90)$
.

For the time-averaged vorticity contours shown in figure 11(a,c), it is found that three additional shear layers are generated just above the moving wall. The shear layer in the gap flow region (with negative vorticity) is believed to be more associated with the increase of
 $Re_{cr2D}$
shown in figure 3. Through close interaction of the two shear layers in the gap, the shear layer on the lower side of the cylinder (with positive vorticity) is weakened by the shear layer on the moving wall with opposite sign of vorticity. This is evidenced in figure 11(a,c) as the shear layer generated on the lower side of the cylinder (with positive vorticity) is not as well developed as the shear layer generated on the upper side of the cylinder (with negative vorticity). As the shear layer on one side of the cylinder is weakened, the vortex structure formed in the cylinder wake is more stable, and the onset point of wake instability (i.e.
 $Re_{cr2D}$
) is delayed. This phenomenon was also observed for the case of a circular cylinder near a stationary wall (Lei et al.
Reference Lei, Cheng, Armfield and Kavanagh2000). In that case, due to a much stronger confinement by the stationary wall with respect to the moving wall, a much stronger shear layer was formed on the stationary wall, which contributed to a much higher
 $Re_{cr2D}$
or even a complete suppression of vortex shedding at
 $G^{\ast }\leqslant 0.2$
(Lei et al.
Reference Lei, Cheng, Armfield and Kavanagh2000). Similarly, in the experimental study by Strykowski & Sreenivasan (Reference Strykowski and Sreenivasan1990), the shear layer on one side of the cylinder was weakened by the placement of a much smaller control cylinder in the near wake of the main cylinder, and the
 $Re_{cr2D}$
was also delayed to higher values.
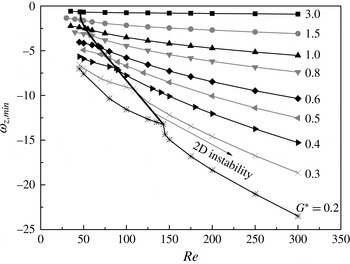
Figure 12 shows the variation of the minimum vorticity on the moving wall (which is within the negatively signed shear layer in the gap flow region) with
 $Re$
and
 $G^{\ast }$
. For 2D unsteady flows, the vorticity field calculated based on the time-averaged 2D flow is used to determine the minimum vorticity on the moving wall. As shown in figure 12, it is apparent that for a fixed
 $G^{\ast }$
the absolute value of the minimum vorticity increases with increase of
 $Re$
. It is also seen in figure 12 that for a fixed
 $Re$
the absolute value of the minimum vorticity increases with decrease of
 $G^{\ast }$
. This suggests that with decrease of
 $G^{\ast }$
the influence of the wall shear layer in the gap flow region becomes stronger in weakening the shear layer on the lower side of the cylinder and stabilizing the wake flow, leading to a higher
 $Re_{cr2D}$
.
Variation of the minimum vorticity on the moving wall (which is within the negatively signed shear layer in the gap flow region) with
 $Re$
and
 $G^{\ast }$
.

Case study of flow past a circular cylinder confined by two parallel slip walls: (a) schematic model of the computational domain, (b) variation of the
 $Re_{cr2D}$
value with
 $G^{\ast }$
and (c) streamwise velocity profiles along the
 $y$
-direction at
 $x=0$
for various
 $G^{\ast }$
at
 $Re$
just below the respective
 $Re_{cr2D}$
.

The confinement of the near-wake flow by the plane wall represents a third contributing factor for the increase of
 $Re_{cr2D}$
with decreasing
 $G^{\ast }$
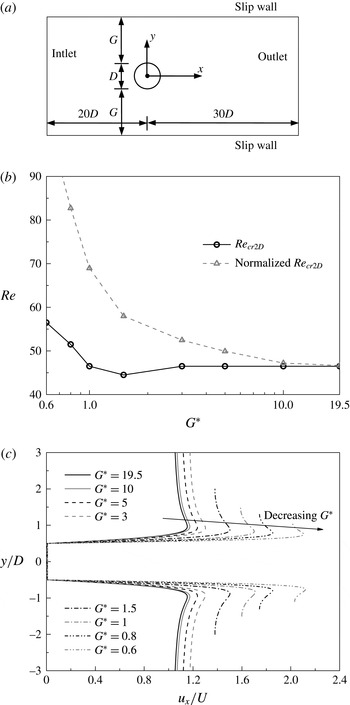
. This is evidenced with separate 2D DNS of flow past a circular cylinder confined by two parallel slip walls (i.e. with symmetry boundary conditions) as shown by the schematic model in figure 13(a). The gap ratio is still defined as
 $G^{\ast }=G/D$
for consistency. In the case of flow past a circular cylinder confined by two parallel slip walls, the flow rate through the gaps increases monotonically with decreasing
 $G^{\ast }$
due to blockage, the vorticity on the slip walls is zero (i.e. without the influence of shear layers on the plane walls), and the mean flow field is always symmetrical about the wake centreline (i.e. the front stagnation point and the recirculation zone are not shifted upward or downward). This allows the influence of the wall confinement on vortex shedding to be isolated from other contributing factors.
The variation of
 $Re_{cr2D}$
with
 $G^{\ast }$
for the case of two parallel slip walls is shown in figure 13(b). A local minimum of
 $Re_{cr2D}$
is observed at
 $G^{\ast }=1.5$
(figure 13
b), at which point the influence of the increase in the flow rate around the cylinder dominates the effect of wall confinement. With a further decrease of the gap ratio, although the flow rate around the cylinder continues to increase in this case, the wall confinement also becomes much stronger and results in an increase in
 $Re_{cr2D}$
(figure 13
b).
In order to remove the blockage effect on the variation of
 $Re_{cr2D}$
with
 $G^{\ast }$
, the
 $Re_{cr2D}$
value for each
 $G^{\ast }$
is normalized by considering the maximum streamwise velocity at
 $x=0$
(in the gap region). Figure 13(c) shows the streamwise velocity profiles along the
 $y$
-direction at
 $x=0$
for various
 $G^{\ast }$
at
 $Re$
just below the respective
 $Re_{cr2D}$
. It is seen that due to the blockage effect the maximum streamwise velocity at
 $x=0$
increases with decreasing
 $G^{\ast }$
. The normalized
 $Re_{cr2D}$
is calculated as:
 $$\begin{eqnarray}Re_{cr2D}^{\prime }=Re_{cr2D}\frac{\text{maximum streamwise velocity of this case}}{\text{maximum streamwise velocity of the case with}~G^{\ast }=19.5}.\end{eqnarray}$$
In other words, the Reynolds number is now defined based on the maximum streamwise velocity at
 $x=0$
rather than the free-stream velocity. As shown in figure 13(b), the normalized
 $Re_{cr2D}$
increases monotonically with decreasing
 $G^{\ast }$
, which suggests that without the blockage effect the wall confinement gradually stabilizes the wake flow with decrease of
 $G^{\ast }$
.
It is also noted that Juniper (Reference Juniper2006), Biancofiore, Gallaire & Pasquetti (Reference Biancofiore, Gallaire and Pasquetti2011) and Biancofiore & Gallaire (Reference Biancofiore and Gallaire2012) reported a destabilization due to a moderate confinement for a confined synthetic wake where a uniform flow with a smaller streamwise velocity
 $U_{1}$
is sandwiched between two identical uniform flows with a larger streamwise velocity
 $U_{2}$
(with two parallel slip walls as the outer boundaries). The destabilization for a moderate confinement in the above scenario is represented by the onset of flow instability at a relatively small negative velocity ratio, where the velocity ratio is defined as
 $\unicode[STIX]{x1D6EC}=(U_{1}-U_{2})/(U_{1}+U_{2})$
. However, for the bluff body flow scenario shown in figure 13(a),
 $\unicode[STIX]{x1D6EC}$
is always close to
 $-1$
since
 $U_{1}$
in the immediate near wake is of the order of
 $0.01U$
. Hence based on the stability diagram in Biancofiore et al. (Reference Biancofiore, Gallaire and Pasquetti2011) it is likely that for
 $\unicode[STIX]{x1D6EC}=-1$
the flow would stay in the unstable regime as long as the confinement is weaker than a critical point. This is consistent with the variation trend of the normalized
 $Re_{cr2D}$
with
 $G^{\ast }$
shown in figure 13(b).
5 3D results at
$G^{\ast }=0.2$

According to the linear stability analysis results of flow past a circular cylinder close to a moving wall by Rao et al. (Reference Rao, Thompson, Leweke and Hourigan2013b
), there exists a discontinuity in the relationship between
 $Re_{cr3D}$
and
 $G^{\ast }$
at
 $G^{\ast }=0.22$
–0.3 (figure 3).
For
 $G^{\ast }\geqslant 0.3$
, the flow undergoes a transition sequence of ‘2D steady
 $\rightarrow$
2D unsteady
 $\rightarrow$
3D unsteady’ (Rao et al.
Reference Rao, Thompson, Leweke and Hourigan2013b
), in line with the transition sequence observed for an isolated cylinder (Williamson Reference Williamson1996). Our 3D DNS study found that the ‘3D unsteady’ stage further consists of a transition sequence of ‘Mode A
 $\rightarrow$
Mode B’ which is similar to the 3D wake transition for an isolated cylinder reported by Williamson (Reference Williamson1996). However, an interesting phenomenon is that a local minimum of the
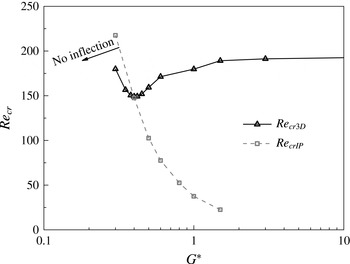
 $Re_{cr3D}$
value is observed at
 $G^{\ast }=0.4$
(figure 14). Since the variation of
 $Re_{cr3D}$
is a result of the decrease of
 $G^{\ast }$
, the sudden increase of
 $Re_{cr3D}$
as
 $G^{\ast }$
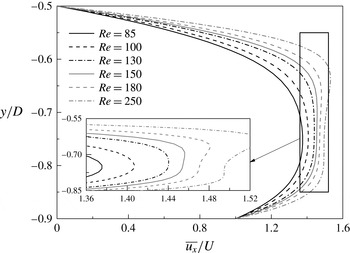
decreases from 0.4 to 0.3 (figure 14) is possibly related to the variation of the gap flow characteristics. Figure 15 shows some mean streamwise velocity profiles of the gap flow at
 $x=0$
(referred to as the
 $\overline{u_{x,x=0}}$
profile) for different
 $Re$
with
 $G^{\ast }=0.4$
. For
 $Re\geqslant 150$
, two local peaks as well as two inflection points are observed in each
 $\overline{u_{x,x=0}}$
profile. For
 $Re\leqslant 145$
, however, a single peak is observed in each
 $\overline{u_{x,x=0}}$
profile and there are no inflection points. The critical
 $Re$
for the emergence of inflection points in the
 $\overline{u_{x,x=0}}$
profile (
 $Re_{crIP}$
) for each
 $G^{\ast }$
(e.g.
 $Re_{crIP}=145$
–150 for
 $G^{\ast }=0.4$
) is shown in figure 14. It is seen in figure 14 that the
 $Re_{crIP}$
value increases monotonically with decrease of
 $G^{\ast }$
. The
 $Re_{crIP}$
and
 $Re_{cr3D}$
curves intersect at approximately
 $G^{\ast }=0.4$
at which point a local minimum of the
 $Re_{cr3D}$
takes place. To the left of the
 $Re_{crIP}$
curve, there are no inflection points in the
 $\overline{u_{x,x=0}}$
profiles, and an increase in
 $Re_{cr3D}$
is observed. According to Rayleigh’s condition, (for an inviscid fluid) ‘the occurrence of an inflection point in the basic velocity profile is a necessary condition for instability’ (see Drazin Reference Drazin2002), and it was suggested in Drazin (Reference Drazin2002) that ‘to each unstable three-dimensional mode there corresponds a more unstable two-dimensional one’. Hence for the present case, the absence of inflection points in the
 $\overline{u_{x,x=0}}$
profile may result in a more stabilized gap flow, and a stabilized 2D flow may also contribute to the suppression of a 3D instability, leading to an increase in
 $Re_{cr3D}$
for
 $G^{\ast }<0.4$
.
Variations of the
 $Re_{cr3D}$
and
 $Re_{crIP}$
values with
 $G^{\ast }$
.

Mean streamwise velocity profiles of the gap flow at
 $x=0$
for different
 $Re$
with
 $G^{\ast }=0.4$
.

Time histories of the spanwise velocity sampled at
 $(x/D,y/D,z/D)=(3.0,0.5,6.0)$
for flow past a circular cylinder close to a moving wall with
 $G^{\ast }=0.2$
.

Time histories of the integrated spanwise kinetic energy within
 $x/D=0{-}5$
for (a)
 $G^{\ast }=0.2$
, and (b)
 $G^{\ast }=0.1$
.

For
 $G^{\ast }\leqslant 0.22$
, the
 $Re_{cr3D}$
appears to be lower than the
 $Re_{cr2D}$
(through 2D calculations), and the flow undergoes a different transition sequence of ‘2D steady
 $\rightarrow$
3D steady
 $\rightarrow$
3D unsteady’ (Stewart et al.
Reference Stewart, Thompson, Leweke and Hourigan2010; Rao et al.
Reference Rao, Thompson, Leweke and Hourigan2013b
). In the present study, 3D DNS is performed at
 $G^{\ast }=0.2$
to examine the wake transition and wake structures in detail. The simulations are performed for
 $Re$
up to 200, covering the above transition sequence.
5.1 Wake transition
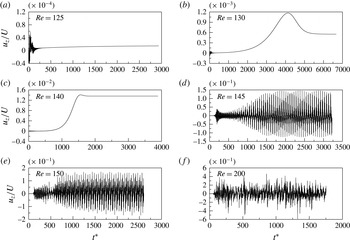
Figure 16 shows the time histories of the spanwise velocity at a sampling point of
 $(x/D,y/D,z/D)=(3.0,0.5,6.0)$
for
 $G^{\ast }=0.2$
. After an initial transient fluctuation period, the time history of the spanwise velocity displays an exponential decay trend for
 $Re=125$
and an exponential growth trend for
 $Re=130$
–140. Through analysing the exponential growth/decay rates of the spanwise velocity of the steady flow, in a similar way as illustrated in § 3 for the unsteady flow, the
 $Re_{cr3D}$
is found at 126.78, which is very close to the value of 127.20 obtained by Rao et al. (Reference Rao, Thompson, Leweke and Hourigan2013b
) through stability analysis. At
 $Re_{cr3D}=126.78$
, the flow undergoes a transition from the 2D steady state to the 3D steady state. In the 3D steady regime of
 $126.78\leqslant Re\leqslant 140$
, the fully developed flow field does not vary in time. For example, the sampled spanwise velocity shown in figure 16(b,c) reaches to a constant non-zero value after the flow is fully developed. As
 $Re$
increases from 140 to 145, irregular fluctuations are observed for the time history of the spanwise velocity (figure 16
d), which marks another wake transition from the 3D steady state to the 3D unsteady state. The critical
 $Re$
for this transition is coincidently close to the
 $Re_{cr2D}$
(
 $=\,143.5$
(
 $\pm 0.5$
)) obtained through 2D DNS.
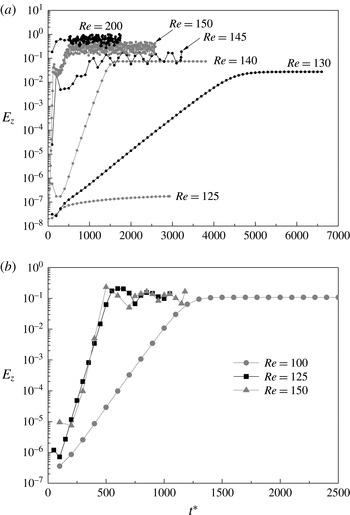
Figure 17(a) shows the time histories of the spanwise kinetic energy
 $E_{z}$
integrated over the near-wake region of
 $x/D=0$
–5 for
 $G^{\ast }=0.2$
, where
 $E_{z}$
is defined as:
 $$\begin{eqnarray}E_{z}=\frac{1}{2}\int _{V}\left(\frac{u_{z}}{U}\right)^{2}\text{d}V,\end{eqnarray}$$
where
 $V$
is the volume of the flow field of interest. As the flow undergoes a transition from 2D steady to 3D steady at
 $Re$
from 125 to 130, a sharp increase of
 $E_{z}$
of approximately five orders of magnitude is observed. Beyond that, the increase of
 $E_{z}$
with
 $Re$
is a gradual process. Particularly, there is no abrupt change in the magnitude of
 $E_{z}$
at the second transition from 3D steady to 3D unsteady. However, the time history of
 $E_{z}$
is steady when the flow is in the 3D steady state, whereas small-amplitude fluctuations are observed when the flow is in the 3D unsteady state.
A few more calculations are carried out at
 $G^{\ast }=0.1$
. A 3D steady flow is observed at
 $Re=100$
while a 3D unsteady flow is observed at
 $Re=125$
and 150. Similar trends of the time histories of
 $E_{z}$
as discussed earlier on for
 $G^{\ast }=0.2$
are also observed for
 $G^{\ast }=0.1$
(figure 17
b). However, the critical
 $Re$
for the transition from 3D steady to 3D unsteady (between 100 and 125) does not match the
 $Re_{cr2D}$
(
 $=158.5$
(
 $\pm 0.5$
)) obtained from 2D DNS. This indicates that the
 $Re_{cr2D}$
predicted by 2D DNS is not reliable for the onset of unsteady flow for
 $G^{\ast }\leqslant 0.22$
, as the flow is already in a 3D state.
5.2 Wake structure and transition mechanism
Based on the speculation that the shear layers developed on the moving wall might play an important role at small gap ratios, further 3D DNS are carried out with the slip wall boundary condition (i.e. with symmetry boundary condition) at the bottom wall to eliminate the influence of the shear layers developed on the moving wall. Based on 2D DNS, the
 $Re_{cr2D}$
for flow past a circular cylinder close to a slip wall at
 $G^{\ast }=0.2$
is 128.5 (
 $\pm 0.5$
). This case is also simulated with 3D DNS at a few discrete
 $Re$
values of 120, 127, 131, 135, 140, 145, 150, 175 and 200. A 2D steady flow is observed at
 $Re\leqslant 127$
, while a 3D unsteady flow is observed at
 $Re\geqslant 135$
. However, it is found that when
 $Re$
is very close to the critical transition point (e.g. at
 $Re=131$
), it takes much longer time for the flow to reach a fully developed state. The case of
 $Re=131$
has been simulated for 2500 non-dimensional time units, yet a clear trend of the development of the time history of the spanwise velocity is still unavailable. Since the critical wake transition point for the slip wall case is not the main focus of the present study, further calculation of the
 $Re=131$
case is not attempted, and more emphasis is put on the 3D unsteady flow at
 $Re\geqslant 135$
.
For
 $Re$
in the range of 135 to 150, a subharmonic Mode C structure is observed in the fully developed flow. The Mode C instability is often observed when the
 $Z_{2}$
spatio-temporal symmetry of the wake is broken by a perturbation imposed on the bluff body (Blackburn & Sheard Reference Blackburn and Sheard2010) which can normally be a geometric configuration or a movement that is asymmetric about the wake centreline, e.g. a circular cylinder with a trip wire in the near wake (Zhang et al.
Reference Zhang, Fey, Noack, König and Eckelmann1995; Yildirim, Rindt & van Steenhoven Reference Yildirim, Rindt and van Steenhoven2013a
), a circular ring (Sheard, Thompson & Hourigan Reference Sheard, Thompson and Hourigan2003), a rotated square cylinder (Sheard, Fitzgerald & Ryan Reference Sheard, Fitzgerald and Ryan2009), two circular cylinders in staggered arrangements (Carmo et al.
Reference Carmo, Sherwin, Bearman and Willden2008), a rotating circular cylinder (Rao et al.
Reference Rao, Leontini, Thompson and Hourigan2013a
), a rotating circular cylinder near a moving wall (Rao et al.
Reference Rao, Thompson, Leweke and Hourigan2015), etc. In the present study, the slip wall close to the circular cylinder (with
 $G^{\ast }=0.2$
) serves as the perturbation to trigger the breaking of the
 $Z_{2}$
spatio-temporal symmetry of the wake and to form Mode C instability. Note that for
 $G^{\ast }\geqslant 0.3$
, the 3D flow is still triggered by Mode A instability.
The Mode C structure observed in the present study is illustrated with the fully developed flow at
 $(Re,G^{\ast })=(140,0.2)$
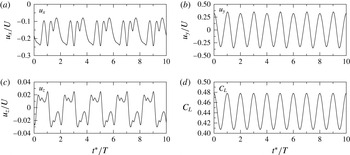
. Figure 18 shows the time histories of the flow velocity components sampled at
 $(x/D,y/D,z/D)=(3.0,0.5,6.0)$
, together with the time history of the span-averaged lift force coefficient. The non-dimensional flow time
 $t^{\ast }$
is normalized with the vortex shedding period
 $T$
(discarding the previous flow time for simplicity). It is seen that while the time history of the lift coefficient is
 $T$
-periodic, the time histories of the velocity components are
 $2T$
-periodic, which reveal the period doubling character of the subharmonic Mode C (Blackburn & Sheard Reference Blackburn and Sheard2010). In particular, a ‘high-peak-low-peak’ feature of the time history of
 $u_{y}$
for Mode C, as observed in the experimental study by Yildirim et al. (Reference Yildirim, Rindt and van Steenhoven2013a
), is also observed in figure 18(b).
Time histories of the flow velocity components sampled at
 $(x/D,y/D,z/D)=(3.0,0.5,6.0)$
and the span-averaged lift force coefficient for flow past a circular cylinder close to a slip wall at
 $(Re,G^{\ast })=(140,0.2)$
.

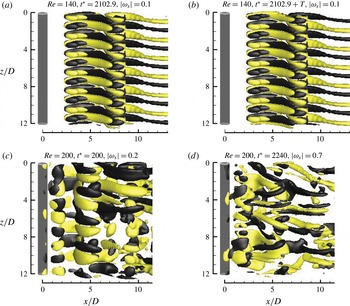
Figure 19(a,b) shows the fully developed Mode C wake structures at
 $(Re,G^{\ast })=(140,0.2)$
with
 $1T$
apart. The wake structures are captured by the iso-surfaces of streamwise vorticity
 $\unicode[STIX]{x1D714}_{x}$
, which is defined in a non-dimensional form as:
 $$\begin{eqnarray}\unicode[STIX]{x1D714}_{x}=\left(\frac{\unicode[STIX]{x2202}u_{z}}{\unicode[STIX]{x2202}y}-\frac{\unicode[STIX]{x2202}u_{y}}{\unicode[STIX]{x2202}z}\right)\frac{D}{U}.\end{eqnarray}$$
It is seen that the Mode C structure is well defined but asymmetric about the wake centreline. The streamwise vortices change sign after each shedding period (figure 19
a versus figure 19
b), and repeat themselves after two shedding periods, which confirms the
 $2T$
-periodic nature of Mode C.
Iso-surfaces of
 $\unicode[STIX]{x1D714}_{x}$
for flow past a circular cylinder close to a slip wall at
 $G^{\ast }=0.2$
. The slip wall is at the back of the structure. Dark grey and light yellow denote positive and negative values, respectively. The flow is from the left to the right past the cylinder on the left.

Along the cylinder span of
 $12D$
in length, 6 pairs of Mode C structure are observed for
 $Re=135$
–145 (e.g. figure 19
a,b) and 5 pairs of Mode C structure are observed for
 $Re=150$
. This suggests that the spanwise wavelength of Mode C (
 $\unicode[STIX]{x1D706}_{C}$
) is approximately 2.0–
 $2.4D$
for
 $Re$
in the range of 135–150, and
 $\unicode[STIX]{x1D706}_{C}$
increases slightly with increase of
 $Re$
. The
 $\unicode[STIX]{x1D706}_{C}$
values obtained in the present case are similar to those reported in the literature, e.g.
 $\unicode[STIX]{x1D706}_{C}=1.8D$
and
 $2.2D$
for flow past a circular cylinder with a trip wire in the near wake by Zhang et al. (Reference Zhang, Fey, Noack, König and Eckelmann1995) and Yildirim, Rindt & van Steenhoven (Reference Yildirim, Rindt and van Steenhoven2013b
), respectively and
 $\unicode[STIX]{x1D706}_{C}\sim 1.7D$
for flow past a circular ring (Sheard et al.
Reference Sheard, Thompson and Hourigan2003).
As
 $Re$
increases to 175 and 200, a different wake structure is observed. At the early stage of wake development, 4 pairs of Mode C structure are observed for
 $Re=175$
and 200 (e.g. figure 19
c). It should be noted that all of the Mode C structures reported in the present study have been confirmed to be
 $2T$
-periodic. However, the Mode C structure in these two cases cannot persist and will be replaced by a more chaotic structure shortly (e.g. figure 19
d).
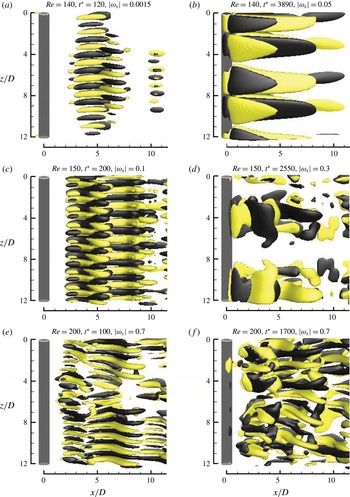
Due to the shear layer effect, the wake structure for flow past a circular cylinder close to a moving wall is different from that obtained with a slip wall. In the 3D steady regime of
 $Re=130$
and 140, the flow is initialized with a small-amplitude Mode C structure with
 $\unicode[STIX]{x1D706}_{C}=1.5D$
(e.g. figure 20
a), followed by the formation of a 3D steady structure with two pairs of ordered vortex structures along the span width (e.g. figure 20
b). This suggests that the spanwise wavelength of the 3D steady structure is approximately
 $6D$
, which is close to the value of
 $6.34D$
at
 $Re_{cr3D}$
predicted by Rao et al. (Reference Rao, Thompson, Leweke and Hourigan2013b
) through stability analysis. Further numerical simulations are carried out with reduced span lengths of 3.0 and 1.5. Since the span lengths are much shorter than the wavelength of the 3D steady structure, the flow decays to a 2D steady state after the initialization of a small-amplitude Mode C structure.
Iso-surfaces of
 $\unicode[STIX]{x1D714}_{x}$
for flow past a circular cylinder close to a moving wall at
 $G^{\ast }=0.2$
. The moving wall is at the back of the structure. Dark grey and light yellow denote positive and negative values, respectively. The flow is from the left to the right past the cylinder on the left.

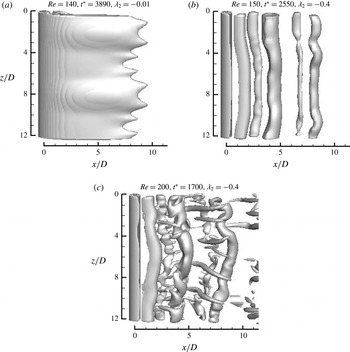
The transition mechanism for the 3D steady state of flow can be explained by comparing the wake structures obtained with the moving wall and slip wall conditions at
 $(Re,G^{\ast })=(140,0.2)$
. Under the slip wall condition, the 3D flow is triggered by Mode C instability (due to a small gap ratio) and a well-defined persistent Mode C structure is observed for the fully developed flow. This suggests that the 3D flow triggered by Mode C instability (e.g. figure 20
a) under the moving wall condition is also due to a small gap ratio. However, the Mode C structure under the moving wall condition cannot persist due to the interference of the shear layer caused by the moving wall and will evolve into a 3D steady state under a sufficiently long span length or decay to a 2D steady state when the span length is restricted.
In the 3D unsteady regime with
 $Re$
ranging from 145 to 200, the flow is also initialized with the Mode C instability (e.g. figure 20
c,e) but will evolve into other 3D flow structures. At
 $Re=145$
and 150 which are just beyond the onset of 3D unsteady state, the Mode C structure will be replaced by a pair of disordered structure after the flow is fully developed (e.g. figure 20
d). This is also due to the interference of the shear layer by the moving wall, in comparison with the persistent Mode C structure at
 $Re=145$
and 150 for the slip wall condition. Since only one pair of the vortex structure is observed in figure 20(d) within a
 $L_{z}$
of
 $12D$
, further simulation is carried out with a
 $L_{z}$
of
 $36D$
to confirm the pairing of the streamwise vortices. It is found that for
 $L_{z}=36D$
, three pairs of the vortex structure shown in figure 20(d) are regularly distributed along the cylinder span width, which suggests that the fully developed flow structure is actually in pairs, with a spanwise wavelength of approximately
 $12D$
.
As
 $Re$
increases further to 175 and 200, the Mode C structure will evolve into small-scale disordered structures for the fully developed flow (e.g. figure 20
f). This wake structure is similar to the structure observed with the slip wall condition at same
 $Re$
values (figure 19
d), since the Mode C structure under the slip wall condition also cannot persist and will become chaotic.
It is also found that when the cylinder span length is restricted to 3.0 or 1.5, the shear layer effect under the moving wall condition would not be able to generate chaotic vortex structures from Mode C for
 $Re$
in the 3D unsteady regime from 145 to 200, and the Mode C structure can persist in the fully developed flow.
Figure 21 shows the vortex cores captured by the second negative eigenvalue
 $\unicode[STIX]{x1D706}_{2}$
of the tensor
 $\unicode[STIX]{x1D733}^{2}+\unicode[STIX]{x1D734}^{2}$
, where
 $\unicode[STIX]{x1D733}$
and
 $\unicode[STIX]{x1D734}$
are the symmetric and antisymmetric parts of the velocity gradient tensor, respectively (Jeong & Hussain Reference Jeong and Hussain1995). In the 3D steady regime, the iso-surfaces of
 $\unicode[STIX]{x1D706}_{2}$
shown in figure 21(a) do not vary with time. In the 3D unsteady regime, primary vortex cores are alternately shed from the upper and lower sides of the cylinder and propagating downstream (figure 21
b,c), which suggests that the onset of unsteady flow is due to the emergence of vortex shedding. It is seen that the primary vortex cores are not in parallel with the cylinder span. At
 $Re=200$
, small-scale streamwise vortex cores are also observed (figure 21
c), which is consistent with the stronger streamwise vorticity as shown in figure 20(f).
Iso-surfaces of
 $\unicode[STIX]{x1D706}_{2}$
for flow past a circular cylinder close to a moving wall at
 $G^{\ast }=0.2$
. The moving wall is at the back of the structure. The flow is from the left to the right past the cylinder on the left.

6 Conclusions
This paper presents 2D and 3D DNS of flow past a circular cylinder near a moving wall. The simulations are carried out in a parameter space spanning a non-dimensional gap ratio (
 $G^{\ast }=G/D$
) between 0.1 and 19.5 and Reynolds number (
 $Re$
) up to 300.
Due to blockage effects, the total flow rate around the cylinder increases as
 $G^{\ast }$
decreases from 19.5 to 1.0–0.8, and decreases as
 $G^{\ast }$
decreases further. However, the gap flow ratio (the ratio between the total gap flow rate and the total free-stream flow rate below the cylinder centreline) decreases monotonically with decrease of
 $G^{\ast }$
, which results in a downward movement of the front stagnation point and an upward shift of the recirculation zone behind the cylinder. The variation of the Strouhal number with
 $Re$
and
 $G^{\ast }$
is closely related to the variation of the mean flow rate around the cylinder, while the variation of the mean lift force coefficient is closely related to the variation of the gap flow ratio.
The monotonic increase of the critical
 $Re$
for 2D instability (
 $Re_{cr2D}$
) as
 $G^{\ast }$
is reduced from 3.0 is influenced by variations in the mean flow rate around the cylinder, the confinement of the near-wake flow by the plane wall, and the characteristics of the shear layer formed above the moving wall directly below the cylinder. The first factor destabilizes the wake flow at a moderate
 $G^{\ast }$
while the latter two factors stabilize the wake flow with decreasing
 $G^{\ast }$
.
In terms of 3D instability, the flow transition sequence of ‘2D steady
 $\rightarrow$
3D steady
 $\rightarrow$
3D unsteady’ taking place at small gap ratios is analysed at
 $G^{\ast }=0.2$
. It is found that the 3D steady and 3D unsteady flows are triggered by Mode C instability, where Mode C instability is triggered by the breaking of the
 $Z_{2}$
spatio-temporal symmetry of the wake due to a small gap ratio. However, the Mode C structure is not sustained due to interference from the shear layer caused by the moving wall, leading to the evolution of other 3D structures. In the 3D steady regime of
 $126.78\leqslant Re\leqslant 140$
, the flow will evolve into an ordered 3D steady state with a specific spanwise wavelength. In the 3D unsteady regime of
 $Re\geqslant 145$
, alternate vortex shedding and disordered transient structures are observed.
Acknowledgements
This work was supported by resources provided by the Pawsey Supercomputing Centre with funding from the Australian Government and the Government of Western Australia. The first author would like to acknowledge the support from the Australian Government and The University of Western Australia by providing IPRS and APA scholarships for a doctoral degree, as well as the Australia–China Natural Gas Technology Postgraduate Research Scholarships from the Australian and Western Australian Governments, the North West Shelf Joint Venture Partners, and the Western Australian Energy Research Alliance. The fourth author would like to acknowledge the support from the Australian Research Council through Discovery Early Career Research Award (DE150100428).