Introduction
Recent observations have shown that Mars likely once had abundant liquid water (e.g. Carr Reference Carr1996; Bibring et al. Reference Bibring, Langevin, Mustard, Poulet, Arvidson, Gendrin, Gondet, Mangold, Pinet, Forget, Berthe, Bibring, Gendrin, Gomez, Gondet, Jouglet, Poulet, Soufflot, Vincendon and Neukum2006; Vaniman et al. Reference Vaniman, Bish, Ming, Bristow, Morris, Blake, Chipera, Morrison, Treiman, Rampe, Rice, Achilles, Grotzinger, McLennan, Williams, Bell, Newsom, Downs, Maurice, Sarrazin, Yen, Morookian, Farmer, Stack, Milliken, Ehlmann, Sumner, Berger, Crisp, Hurowitz, Anderson, Des Marais, Stolper, Edgett, Gupta and Spanovich2014; Grotzinger et al. Reference Grotzinger, Gupta, Malin, Rubin, Schieber, Siebach, Sumner, Stack, Vasavada, Arvidson, Calef, Edgar, Fischer, Grant, Griffes, Kah, Lamb, Lewis, Mangold, Minitti, Palucis, Rice, Williams, Yingst, Blake, Blaney, Conrad, Crisp, Dietrich, Dromart, Edgett, Ewing, Gellert, Hurowitz, Kocurek, Mahaffy, McBride, McLennan, Mischna, Ming, Milliken, Newsom, Oehler, Parker, Vaniman, Wiens and Wilson2015), widely considered to be a critical prerequisite for life. The amount of liquid water that was present on Mars, and how long it was present, is not yet clear, however. Clues to the characteristics and longevity of ancient aquatic environments on Mars may lie in aqueous alteration products, including the poorly crystalline, nano-crystalline, or X-ray amorphous soil components (referred to here as ‘amorphous’ for simplicity) that have been detected widely on Mars from orbit (e.g. Singer Reference Singer1985; Milliken et al. Reference Milliken, Swayze, Arvidson, Bishop, Clark, Ehlmann, Green, Grotzinger, Morris, Murchie, Mustard and Weitz2008; Rampe et al. Reference Rampe, Kraft, Sharp, Golden, Ming and Christensen2012; Weitz et al. Reference Weitz, Bishop, Baker and Berman2014) and in situ by the Pathfinder, Spirit, and Curiosity rovers (e.g. Morris et al. Reference Morris, Golden, Bell, Shelfer, Scheinost, Hinman, Furniss, Mertzman, Bishop, Ming, Allen and Britt2000; Squyres et al. Reference Squyres, Arvidson, Ruff, Gellert, Morris, Ming, Crumpler, Farmer, Des Marais, Yen, McLennan, Calvin, Bell, Clark, Wang, McCoy, Schmidt and de Souza2008; Bish et al. Reference Bish, Blake, Vaniman, Chipera, Morris, Ming, Treiman, Sarrazin, Morrison, Downs, Achilles, Yen, Bristow, Crisp, Morookian, Farmer, Rampe, Stolper and Spanovich2013). Amorphous materials containing structural or adsorbed water may be the source of globally distributed hydrogen observed on Mars (Meslin et al. Reference Meslin, Gasnault, Forni, Schroder, Cousin, Berger, Clegg, Lasue, Maurice, Sautter, Le Mouelic, Wiens, Fabre, Goetz, Bish, Mangold, Ehlmann, Lanza, Harri, Anderson, Rampe, McConnochie, Pinet, Blaney, Leveille, Archer, Barraclough, Bender, Blake, Blank, Bridges, Clark, DeFlores, Delapp, Dromart, Dyar, Fisk, Gondet, Grotzinger, Herkenhoff, Johnson, Lacour, Langevin, Leshin, Lewin, Madsen, Melikechi, Mezzacappa, Mischna, Moores, Newsom, Ollila, Perez, Renno, Sirven, Tokar, de la Torre, d'Uston, Vaniman and Yingst2013). One such material, allophane (approximately Al2O3·(SiO2)1.3–2·(H2O)2.5–3), has been detected from orbit across many regions of Mars (Rampe et al. Reference Rampe, Kraft, Sharp, Golden, Ming, Christensen and Ruf2011, Reference Rampe, Kraft, Sharp, Golden, Ming and Christensen2012; Bishop and Rampe Reference Bishop and Rampe2016), and has been proposed as a possible component of the amorphous material at Gale crater, the landing site of the Mars Science Laboratory rover, Curiosity (Bish et al. Reference Bish, Blake, Vaniman, Chipera, Morris, Ming, Treiman, Sarrazin, Morrison, Downs, Achilles, Yen, Bristow, Crisp, Morookian, Farmer, Rampe, Stolper and Spanovich2013; Dehouck et al. Reference Dehouck, McLennan, Meslin and Cousin2014).
Allophane is a poorly ordered aluminosilicate that forms on Earth from the weathering of volcanic rocks and ash in moist, temperate climates (e.g. Wada Reference Wada1989; Parfitt Reference Parfitt1990; Gustafsson et al. Reference Gustafsson, Karltun and Bhattacharya1998). Allophane has short-range atomic order and forms aggregates of hollow, porous nano-scale spherules ~ 50 Å in diameter (Abidin et al. Reference Abidin, Matsue and Henmi2004), giving it a large adsorption capacity and a large surface area (Ohashi et al. Reference Ohashi, Wada, Suzuki, Maeda and Tomura2002; Iyoda et al. Reference Iyoda, Hayashi, Arakawa, John, Okamoto, Hayashi and Yuan2012). Allophanes can have a range of Al:Si ratios, and at Al:Si ratios below ~ 2:1, the ‘excess’ Si is polymerized in the interior of the allophane nano-spherules (Childs et al. Reference Childs, Parfitt and Newman1990; Parfitt Reference Parfitt1990). In Fe-rich soils, Fe3+ can substitute isomorphically for some or most of the Al, producing Fe-substituted allophane (e.g. Kitagawa Reference Kitagawa1973) or a related mineral, hisingerite (approximately Fe3+2Si2O5(OH)4·H2O, Henmi et al. Reference Henmi, Wells, Childs and Parfitt1980). Like allophane, hisingerite is poorly ordered and tends to form aggregates of hollow, porous nano-spherules in soils (Ingles and Willoughby Reference Ingles and Willoughby1967), although the nano-spherules are much larger (~ 200 Å in diameter as per Shayan Reference Shayan1984).
Measurements from the Chemistry and Mineralogy (CheMin) instrument aboard Curiosity indicate that amorphous material is present in abundances from ~ 15–70 wt.% in all samples measured to date (e.g. Bish et al. Reference Bish, Blake, Vaniman, Chipera, Morris, Ming, Treiman, Sarrazin, Morrison, Downs, Achilles, Yen, Bristow, Crisp, Morookian, Farmer, Rampe, Stolper and Spanovich2013; Blake et al. Reference Blake, Morris, Kocurek, Morrison, Downs, Bish, Ming, Edgett, Rubin, Goetz, Madsen, Sullivan, Gellert, Campbell, Treiman, McLennan, Yen, Grotzinger, Vaniman, Chipera, Achilles, Rampe, Sumner, Meslin, Maurice, Forni, Gasnault, Fisk, Schmidt, Mahaffy, Leshin, Glavin, Steele, Freissinet, Navarro-Gonzalez, Yingst, Kah, Bridges, Lewis, Bristow, Farmer, Crisp, Stolper, Marais and Sarrazin2013; Dehouck et al. Reference Dehouck, McLennan, Meslin and Cousin2014; Vaniman et al. Reference Vaniman, Bish, Ming, Bristow, Morris, Blake, Chipera, Morrison, Treiman, Rampe, Rice, Achilles, Grotzinger, McLennan, Williams, Bell, Newsom, Downs, Maurice, Sarrazin, Yen, Morookian, Farmer, Stack, Milliken, Ehlmann, Sumner, Berger, Crisp, Hurowitz, Anderson, Des Marais, Stolper, Edgett, Gupta and Spanovich2014; Treiman et al. Reference Treiman, Bish, Vaniman, Chipera, Blake, Ming, Morris, Bristow, Morrison, Baker, Rampe, Downs, Filiberto, Glazner, Gellert, Thompson, Schmidt, Le Deit, Wiens and Yen2016; Rampe et al. Reference Rampe, Ming, Blake, Bristow, Chipera, Grotzinger, Morris, Morrison, Vaniman, Yen, Achilles, Craig, Des Marais, Downs, Farmer, Fendrich, Gellert, Hazen, Kah and Thompson2017; Sutter et al. Reference Sutter, McAdam, Mahaffy, Ming, Edgett, Rampe, Eigenbrode, Franz, Freissinet, Grotzinger, Steele, House, Archer, Malespin, Navarro-González, Stern, Bell, Calef, Gellert and Yen2017). The broad hump in the CheMin X-ray diffraction (XRD) patterns of these samples, which was assigned to amorphous material, has been fit by a combination of allophane, ferrihydrite, and/or rhyolitic and basaltic glass for samples of modern aeolian sediment (e.g. the Rocknest aeolian bedform; Bish et al. Reference Bish, Blake, Vaniman, Chipera, Morris, Ming, Treiman, Sarrazin, Morrison, Downs, Achilles, Yen, Bristow, Crisp, Morookian, Farmer, Rampe, Stolper and Spanovich2013; Achilles et al. Reference Achilles, Downs, Ming, Rampe, Morris, Treiman, Morrison, Blake, Vaniman, Ewing, Chipera, Yen, Bristow, Ehlmann, Gellert, Hazen, Fendrich, Craig, Grotzinger and Morookian2017) and ancient sandstone and mudstone (e.g. the Cumberland, John Klein, and Windjana drill sites; Vaniman et al. Reference Vaniman, Bish, Ming, Bristow, Morris, Blake, Chipera, Morrison, Treiman, Rampe, Rice, Achilles, Grotzinger, McLennan, Williams, Bell, Newsom, Downs, Maurice, Sarrazin, Yen, Morookian, Farmer, Stack, Milliken, Ehlmann, Sumner, Berger, Crisp, Hurowitz, Anderson, Des Marais, Stolper, Edgett, Gupta and Spanovich2014; Treiman et al. Reference Treiman, Bish, Vaniman, Chipera, Blake, Ming, Morris, Bristow, Morrison, Baker, Rampe, Downs, Filiberto, Glazner, Gellert, Thompson, Schmidt, Le Deit, Wiens and Yen2016; Rampe et al. Reference Rampe, Ming, Blake, Bristow, Chipera, Grotzinger, Morris, Morrison, Vaniman, Yen, Achilles, Craig, Des Marais, Downs, Farmer, Fendrich, Gellert, Hazen, Kah and Thompson2017). Plausible chemical composition of the amorphous component for inactive aeolian sediment (i.e. soil) was estimated by subtracting the calculated composition of the crystalline component (determined from CheMin data) from the bulk sample composition obtained from Curiosity’s Alpha Particle X-Ray Spectrometer (APXS) (Bish et al. Reference Bish, Blake, Vaniman, Chipera, Morris, Ming, Treiman, Sarrazin, Morrison, Downs, Achilles, Yen, Bristow, Crisp, Morookian, Farmer, Rampe, Stolper and Spanovich2013; Dehouck et al. Reference Dehouck, McLennan, Meslin and Cousin2014; Vaniman et al. Reference Vaniman, Bish, Ming, Bristow, Morris, Blake, Chipera, Morrison, Treiman, Rampe, Rice, Achilles, Grotzinger, McLennan, Williams, Bell, Newsom, Downs, Maurice, Sarrazin, Yen, Morookian, Farmer, Stack, Milliken, Ehlmann, Sumner, Berger, Crisp, Hurowitz, Anderson, Des Marais, Stolper, Edgett, Gupta and Spanovich2014). Based on the Fe-rich nature of the material, hisingerite may be present instead of or in addition to allophane (Bish et al. Reference Bish, Blake, Vaniman, Chipera, Morris, Ming, Treiman, Sarrazin, Morrison, Downs, Achilles, Yen, Bristow, Crisp, Morookian, Farmer, Rampe, Stolper and Spanovich2013; Dehouck et al. Reference Dehouck, McLennan, Meslin and Cousin2014).
Weathering of basaltic materials on Mars could have produced amorphous silica and Al-rich clay minerals if the water:rock ratio was high (e.g. Catalano Reference Catalano2013). Amorphous silica and Al-rich clay minerals on Mars may represent the final stages of an alteration sequence in which allophane is an intermediate product. Although much research has been done on the structure of allophane (e.g. Childs et al. Reference Childs, Parfitt and Newman1990; Ohashi et al. Reference Ohashi, Wada, Suzuki, Maeda and Tomura2002; Montarges-Pelletier et al. Reference Montarges-Pelletier, Bogenez, Pelletier, Razafitianamaharavo, Ghanbaja, Lartiges and Michot2005; Iyoda et al. Reference Iyoda, Hayashi, Arakawa, John, Okamoto, Hayashi and Yuan2012; Bishop et al. Reference Bishop, Rampe, Bish, Abidin, Baker, Matsue and Henmi2013), few data exist on its alteration mechanisms, including dissolution kinetics (Abidin et al. Reference Abidin, Matsue and Henmi2004), and to the present authors’ knowledge no dissolution rates have been measured for Fe-rich allophane.
The objectives of this study were, therefore, to determine the rates and conditions under which analogs for the martian amorphous soil component persist, dissolve, and form secondary alteration phases. To those ends, the study intended to synthesize Fe-free allophane, Fe-poor allophane, and Fe-rich allophane, and to perform batch dissolution experiments of these phases in acidic, near-neutral, and alkaline conditions; and to characterize the altered materials. The desired outcome was that the results could then help to place constraints on the characteristics and longevity of liquid water that was present in allophane-bearing regions on Mars after the formation of these amorphous materials and help to search for direct evidence of past aqueous alteration in returned martian samples.
Materials and Methods
Synthesis Procedures
Fe-free allophane, Fe-poor allophane, and Fe-rich allophane were synthesized following the methods of Baker and Strawn (Reference Baker and Strawn2012, Reference Baker and Strawn2014) and Baker et al. (Reference Baker, Nickerson and Strawn2014). Plastic labware was used for all steps of the synthesis in order to avoid silica contamination from glass.
Syntheses were carried out using AlCl3·6H2O (reagent grade, Alfa Aesar, Haverkill, Massachusetts, USA), FeCl3·6H2O (ACS grade, Mallinkcrodt, Staines-upon-Thames, UK), and tetraethyl orthosilicate (TEOS) (≥ 98% purity, Acros Organics, Fair Lawn, New Jersey, USA). Solutions of 0.1 M AlCl3 and FeCl3 were mixed, and TEOS was added. While stirring, a solution of 1 M NaOH (reagent grade, VWR Chemicals BDH, Poole, UK) was added to the solution with a variable-speed Just Infusion syringe pump (Model NE-300, New Era Pump Systems Inc., East Farmingdale, New York, USA) at a rate of 25 mL h–1 in order to hydrolyze TEOS and allow Si to bond with Al and Fe. The NaOH solution was added until a molar ratio of OH/(Al + Fe) = 3:1 was achieved in order to maximize allophane production and minimize the production of other phases, such as imogolite (Denaix Reference Denaix1993). The recipes used for synthesis of Fe-free allophane, Fe-poor allophane, and Fe-rich allophane, along with the Al:Fe:Si molar ratio, Brunauer-Emmett Teller (BET) specific surface area (SSA), and average particle size of each unaltered material, are summarized in Table 1. The precursor materials were stirred for one additional hour after NaOH addition to ensure thorough mixing, and then incubated without stirring at room temperature overnight to stabilize the suspension through an initial stage of colloid formation and proton release (Denaix Reference Denaix1993; Montarges-Pelletier et al. Reference Montarges-Pelletier, Bogenez, Pelletier, Razafitianamaharavo, Ghanbaja, Lartiges and Michot2005). The precursors were then heated in an oven at 95ºC for 7 days to promote colloid growth and maturation. The samples were removed from the oven, cooled on the lab bench to room temperature, and washed with 18.2 MΩ cm deionized water until the conductivity of the supernatant was < 20 μS to remove excess ions and alcohol from TEOS. The washed products were frozen in a –20ºC freezer for at least 24 h, and then freeze-dried to create the final solid product. Samples were sieved to < 355 μm prior to use in dissolution experiments.
Synthesis recipes, Al:Fe:Si molar ratios, BET SSA, and particle sizes for Fe-free allophane, Fe-poor allophane, and Fe-rich allophane. NaOH was used to hydrolyze TEOS to allow Si to bind with Al and Fe

*Synthesis ratios. The compositions of the final solids measured via total digestion were slightly more Al-rich than the synthesis ratios (Table 6)
Characterization of Unaltered Material
The synthesized Fe-free allophane, Fe-poor allophane, and Fe-rich allophane were characterized by Fourier-transform infrared photoacoustic spectroscopy (FTIR-PAS), X-ray diffraction (XRD), evolved gas analysis (EGA), scanning electron microscopy/energy dispersive X-ray spectroscopy (SEM/EDS), field-emission SEM (FE-SEM), field-emission scanning transmission electron microscopy (FE-STEM), BET SSA analysis, particle-size analysis, and total chemistry by total digestion.
FTIR-PAS.
FTIR-PAS analyses were carried out on a Varian FTS 7000 FTIR spectrometer with a photoacoustic detector (Varian Inc., Palo Alto, Calicfornia, USA) in the Inorganic Materials & Nanomaterials lab at the University of Nevada, Las Vegas, USA (UNLV). The use of photoacoustic techniques allowed samples to be analyzed with minimal preparation and was non-destructive to the sample. Absorption spectra were obtained on loosely packed powdered samples. For all runs, the scanning speed was 2.5 kHz, with 64 scans collected at a resolution of 4 cm–1 over the range 4000–400 cm–1 (2.5–25 μm). For each sample, the sample chamber with the sample was run through an open helium purge for 10 min, followed by a closed helium purge for another 10 min in order to minimize contamination from atmospheric gases. Carbon black was used to obtain a background spectrum for each run, and this background spectrum was used as a correction for all sample spectra in order to remove absorptions due to CO2 and other atmospheric gases.
XRD.
XRD patterns for unreacted Fe-free allophane, Fe-poor allophane, and Fe-rich allophane were obtained using a PANalytical X’Pert Pro MPD 3040 instrument (Malvern Panalytical Ltd., Malvern, UK) with a traditional spinner stage at NASA Johnson Space Center. CoKα radiation was used for all samples for comparison to CheMin XRD data. The scans were conducted at 45 kV/40 mA, from 2 to 80°2θ with a step size of 0.02º2θ, 100 s per step. Before analysis, samples were crushed gently in an agate mortar and pestle to break up aggregates and sieved to < 75 μm. Silicon zero-background slides in aluminum sample holders were used for all samples.
EGA.
Evolved gas analysis was conducted on Fe-free allophane, Fe-poor allophane, and Fe-rich allophane in order to compare these synthetic materials with those measured in Gale crater by the Sample Analysis at Mars (SAM) instrument on the Curiosity rover. EGA was conducted under conditions similar to those utilized by SAM (i.e. ramp rate, pressure, and carrier gas). The analyses were conducted in a Setaram LabSys Evo thermal gravimeter/differential scanning calorimeter (TG/DSC) furnace (Setaram Inc., Caluire, France) coupled to a Pfeiffer ThermoStar GSD 320 quadrupole mass spectrometer (Pfeiffer Vacuum, Aßlar, Germany) at NASA Johnson Space Center. The temperature range was from 30 to 1000ºC with a ramp rate of 35ºC min–1. The carrier gas was helium, with a flow rate of 10 mL min–1, and the pressure was 30 mbar. Approximately 10 mg of sample was used for each run, and samples were run in duplicate.
Microscopy.
Freeze-dried aggregates of unaltered Fe-free allophane, Fe-poor allophane, and Fe-rich allophane were placed on carbon tape atop aluminum sample plugs and carbon coated for analysis using a Denton Vacuum DV-502A carbon coater (Denton Vacuum LLC, Moorestown, New Jersey, USA). SEM and EDS analyses were carried out on a JEOL scanning electron microscope model JSM-5600 (JEOL Ltd., Akishima, Tokyo, Japan) with a magnification range of 35 × to 100,000 × (1 μm resolution) with an Oxford ISIS EDS system (Oxford Instruments, Abingdon, UK) in the Electron Microanalysis and Imaging Laboratory (EMiL) at UNLV.
In order to reach sufficient magnifications to distinguish the nano-spherules characteristic of allophane, samples were examined using a JEOL JSM-6700F field-emission SEM (JEOL Ltd., Akishima, Tokyo, Japan) with a magnification range of 500 to 430,000 × (5 μm–10 nm resolution) in the EMiL at UNLV. Sample preparation was the same as for SEM/EDS analyses. A standard voltage of 15 kV was used, with a working distance of 8.4 ± 0.1 mm. Fe-free allophane was examined in secondary electron mode to investigate topography of particles, whereas Fe-poor and Fe-rich allophane were examined in backscatter mode to investigate potential chemical variations within and between particles.
Transmission electron microscopy was carried out using a JEOL JEM-2500SE analytical field-emission scanning transmission electron microscope (FE-STEM) (JEOL Ltd., Akishima, Tokyo, Japan) with up to 1,000,000 × magnification (1.5 nm resolution) at NASA Johnson Space Center. Both conventional and STEM bright-field imaging were used in order to identify major morphological features of the grains, such as nano-spherules. Assessment of features on the crystal-structure scale, including those indicative of short- or long-range atomic order, was achieved using high-resolution lattice fringe imaging (HRTEM). Freeze-dried samples were crushed gently in an agate mortar and pestle to break up aggregates, suspended in ethanol, and droplet-deposited on amorphous holey-carbon films supported on 200 mesh transmission electron microscope (TEM) grids (Electron Microscopy Sciences, Hatfield, Pennsylvania, USA). The major-element composition of grains was assessed by EDS.
BET surface area and particle-size analysis.
Approximately 400 mg each of unreacted, unground synthetic Fe-free allophane, Fe-poor allophane, and Fe-rich allophane, sieved to the < 355 µm size fraction used in the dissolution experiments, were prepared for determination of BET SSA and particle-size analysis. The BET SSA values were used to normalize the calculated dissolution rates to surface area and allow comparison of calculated rates to the literature. BET SSA was determined using a Micromeritics TriStar II 3020 surface area and porosity instrument (Micromeritics Instrument Corporation, Norcross, Georgia, USA) at NASA Johnson Space Center. N2 was used as the analysis adsorbate. Samples were degassed at 250°C under vacuum overnight to remove adsorbed water, which can interfere with accurate BET results by occupying adsorption sites and preventing the analysis adsorbate from adsorbing. This temperature was chosen because it exceeds the temperature of water release for allophane (100–150°C, Bish and Duffy Reference Bish, Duffy, Stucki and Bish1990; Rampe et al. Reference Rampe, Morris, Archer, Agresti and Ming2016) but is well below the temperature at which allophane begins to transform to mullite (900–950°C, Parfitt Reference Parfitt1990). Particle-size analysis was conducted on a Microtrac Bluewave S4640 particle size analyzer (MicrotracBEL, Osaka, Japan) at NASA Johnson Space Center. Samples were dispersed in ethanol and sonicated prior to analysis. All analyses were run in duplicate to allow estimates of uncertainty.
Total chemistry.
Digestions were performed following a modification of the method of Potts et al. (Reference Potts, Webb and Watson1984) in order to quantify changes in chemical composition due to alteration. For each sample, ~ 0.1 g of material was mixed in a 1:5 mass ratio with lithium tetraborate (≥ 98%, Acros Organics, Fair Lawn, New Jersey, USA). The dry mixture was heated at 975°C in a graphite crucible for 20 min, and then allowed to cool to room temperature. The melt bead was removed from the crucible, mixed with 100 mL of 1 M HNO3 (Mallinkcrodt, Staines-upon-Thames, UK) and stirred for 1 h on low heat (~ 40°C). Another 100 mL of 1 M HNO3 was added after 1 h, and the suspension was stirred for an additional 1 h on low heat until the melt bead dissolved fully. The solution was stirred at room temperature overnight to ensure complete dissolution of silica species. After the overnight stirring step, an aliquot of the solution was filtered to 0.2 μm and sent to UNLV for Al-Si-Fe measurements using an iCAP Qc Inductively Coupled Plasma Mass Spectrometer (ICP-MS) (Thermo Scientific, Waltham, Massachusetts, USA). Graphite residues were observed on the filters due to graphite coatings on the original melt beads, but no other residues (i.e. incompletely dissolved sample) were observed on the filters. Filtered sample solutions were diluted by a factor of 100 for Si and Fe measurements, and by a factor of 1000 for Al measurements. Synthetic multi-element standard solutions were made from HPS™ single-element standard solutions (High Purity Standards, North Charleston, South Carolina, USA) and were used to construct standard calibration curves. The peaks of 27Al, 28Si, 29Si, and 57Fe were monitored under kinetic energy discrimination (KED) mode with collision cell gas to remove molecular interferences. The blank correction was typically < 15% for Si, < 6% for Fe, and < 1% for Al. The sensitivity drift within each analytical sequence was < 15%, and it was corrected by using an external drift monitor (e.g. DeFelice et al. Reference DeFelice, Mallick, Saal and Huang2019). Each solution was measured twice in two analytical sequences. These two measurements agreed within ± 3%, and their averages were reported.
Dissolution Experiments and Solution Chemistry Analysis
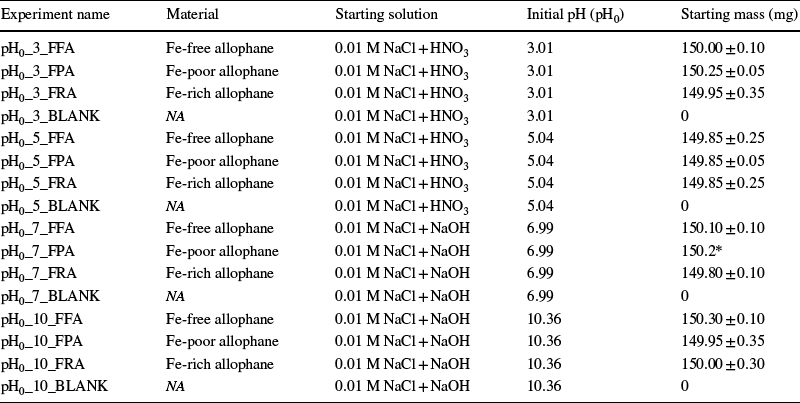
Experiments were prepared by adding 150.0 ± 0.4 mg of sample (Fe-free allophane, Fe-poor allophane, or Fe-rich allophane, sieved to < 355 μm) to acid-washed 250 mL polypropylene bottles containing 180 mL of 0.01 M NaCl solution (made with reagent-grade NaCl, VWR Chemicals BDH, Poole, UK) adjusted to pH 3, 5, 7, or 10.4. The bottles were shaken in a shaker water bath at 25.0 ± 0.1ºC at 50 rpm. The pH was adjusted with high-purity concentrated HNO3 or NaOH. Experiments were performed in batch to examine changes in the solid material under steady-state conditions, such as formation of incipient phyllosilicates, probably relevant to low water:rock (W/R) ratio isochemical reactions that may have occurred on Mars. The pH was not buffered due to the potential for changes in reaction rate and mechanism caused by the presence of buffers in solution (e.g. Dove and Crerar Reference Dove and Crerar1990; Wogelius and Walther Reference Wogelius and Walther1991; Stillings and Brantley Reference Stillings and Brantley1995). However, 0.01 M NaCl solution was used instead of deionized water to reduce drastic changes in ionic strength due to dissolution, which can significantly affect the dissolution rates of high-silica materials compared to dissolution in pure water (Dove and Nix Reference Dove and Nix1997; Icenhower and Dove Reference Icenhower and Dove2000). Each experiment was run in duplicate with one blank under each pH condition. Blanks consisted of 0.01 M NaCl solution with no added allophane, with the same amount of HNO3 or NaOH added as in the experiments. Solution aliquots (10 mL each) were taken periodically based on expected dissolution rates of similar materials (e.g. Liang and Readey Reference Liang and Readey1987; Icenhower and Dove Reference Icenhower and Dove2000; Huertas et al. Reference Huertas, Caballero, Jiménez de Cisneros, Huertas and Linares2001; Gislason and Oelkers Reference Gislason and Oelkers2003; Abidin et al. Reference Abidin, Matsue and Henmi2004; Rozalen et al. Reference Rozalen, Huertas, Brady, Cama, GarcíaPalma and Linares2008; Gainey et al. Reference Gainey, Hausrath, Hurowitz and Milliken2014; Steiner et al. Reference Steiner, Hausrath, Elwood-Madden, Tschauner, Ehlmann, Olsen, Gainey and Smith2016) and preliminary experiments. The resulting change in water:sample ratio was corrected when calculating the elemental release rate (see the Calculations section below). The first 8 mL of each sample aliquot was filtered through a 0.2 µm filter and acidified with 1% v/v high purity HNO3 (67–70%, VWR Chemicals BDH, Poole, UK). The pH of the solution was measured from the remaining 2 mL of unfiltered sample aliquot. Dissolution experiments are summarized in Table 2, and the full experimental conditions for each experiment, including initial and final pH and total reaction time, are given in the Supplementary Material (Data Sheets S1–S38). Experiments are referred to by the starting pH (pH0) and material: Fe-free allophane (FFA), Fe-poor allophane (FPA), or Fe-rich allophane (FRA). For example, a dissolution experiment with Fe-free allophane and an initial pH of 3 would be referred to as ‘pH0_3_FFA’.
Table of dissolution experiments

NA: none added
*Duplicate experiment excluded because of low mass (73.7 mg), high standard error, and poor R2 value (Data Sheet S18)
Elemental analyses for dissolved Fe, Al, and Si were conducted via flame atomic absorption (AA) spectroscopy on a Thermo Scientific iCE 3000 Series AA Spectrometer (Thermo Scientific, Waltham, Massachusetts, USA) at UNLV. Dissolved Fe was measured using an air-acetylene flame and had a practical quantitation limit of 0.2 mg L–1. The practical quantitation limit is defined as the concentration at which the instrument response is roughly 10 times greater than the standard deviation of the calibration (Gibbons et al. Reference Gibbons, Grams, Jarke and Stoub1991). Dissolved Al and Si were measured using an air-acetylene-nitrous oxide flame and had practical quantitation limits of 1.0 mg L–1 and 0.2 mg L–1, respectively. Fe samples were treated with CaCO3 (ACS grade, RICCA Chemical Company, Arlington, Texas, USA) to reduce interference, and Al samples were treated with KCl (molecular biology grade, EMD Millipore, Burlington, Massachusetts, USA) to control ionization, following the methods of Eaton et al. (Reference Eaton, Clesceri, Rice, Greenberg and Franson2005), and 18.2 MΩ cm deionized water was used as an instrument blank.
Calculations
Dissolution rates were determined from moles of Si released into solution with time. The Si concentration measured in solution was corrected for volume removed during sampling to obtain moles of Si released using the equation:

where m t and m (t–1) are the moles of Si released at times t and t–1, c t and c (t–1) are the corresponding concentrations (mol L–1), and V (t–1) is the volume of solution (L) remaining at time t–1 (Welch and Ulmann Reference Welch and Ullman2000). Dissolution of all materials showed an initial linear rapid Si release phase, followed by a slower phase that approached steady conditions (Fig. 1). This approach to steady conditions was expected in batch (closed-system) conditions either due to equal rates of silica dissolution from one phase and silica precipitation to another phase, or due to true chemical equilibrium with respect to some silica-containing phase. The initial linear part of the curve was determined by fitting a preliminary regression line through the Si release data for the first 7 h of the experiment (generally equivalent to the first 3–4 points), and the last data point that was within two standard deviations (2σ) of this line was considered the final point of the linear part of the curve. This approach is similar to the method used by Abidin et al. (Reference Abidin, Matsue and Henmi2004) to determine the point at which allophane dissolution transitions from an initial, rapid rate to a slower rate approaching steady-state. The section of the Si-release curve between zero and the first time point was not included in these calculations, as it may represent release of Si due to rapid dissolution of fine particles (e.g. Nagy et al. Reference Nagy, Blum and Lasaga1991), and would therefore not be representative of the dissolution rate of the bulk material. When the first point had a greater silica concentration than the second point (both replicates of pH0_5_FRA, one replicate each of pH0_5_FFA and pH0_5_FPA), the first point was not included in the regression, as this was interpreted as inadvertent sampling of solid material. The initial linear part of the Si-release curve, determined as described above, was then fit with a linear regression, where the slope of the line was the silica release rate in mol s–1. The dissolution rate was calculated using the following equation:

Representative solution-chemistry data for a dissolution experiment. a Typical shape of the Si, Al, and Fe release curves for Fe-free allophane, Fe-poor allophane, and Fe-rich allophane dissolution (note the difference in scale between Si and Al released versus Fe released). b The linear portion of the silica release curve as exemplified by a pH0_3_FRA experiment. The linear portion of the silica release curve was fit with a linear regression (equation and R2 value shown). Error bars are the standard error of the AA measurement, and are smaller than the points for the first three points. In general, Fe-rich allophane reached higher final Si, Al, and Fe concentrations than Fe-free allophane or Fe-poor allophane (Figs S9–S14). No Al or Fe release was observed in experiments at pH0 5, 7, or 10. Fe release was only observed in Fe-rich allophane experiments at pH0 3. All data for all experiments are given in the Supplementary Material (Data Sheets S1–S38)

where r diss is the dissolution rate (mol m–2 s–1), Δm/Δt is the silica-release rate (mol s–1), A is the average initial BET SSA of the material (m2 g–1), and M is the total mass of material in the reactor (g) (Table 3). One of the duplicate experiments of pH0_7_FPA was excluded from the rate calculations due to anomalous experimental conditions (see Data Sheet S18, Supplementary Material). Although BET surface area is not a perfect measurement of reactive surface area (e.g. Velbel Reference Velbel1993; Gautier et al. Reference Gautier, Oelkers and Schott2001; Sanders et al. Reference Sanders, Washton and Mueller2012), it allows comparisons of these surface area-normalized dissolution rates to surface area-normalized measurements in the literature. The average pH of the linear section of the dissolution curve was considered to be the pH of the experiment, as the dissolution rate is also determined over the same section (see Solution Chemistry and Section S10, Supplementary Material).
pH at the first time point (t i ) and at the final time point (t f ) of the data used to calculate the dissolution rates, the dissolution rates (r diss), and their 1σ standard deviations (Std err). The ‘-1′ or ‘2′ suffix indicates duplicate experiments. Averages of the data are plotted in Fig. 7 with rate laws calculated as described in the text. Cells in italics were omitted from the rate-law calculation due to anomalous experimental conditions (see Supplementary Material Data Sheet S18). All solution compositions for each experiment at each time point are given in Supplementary Material (Data Sheets S1–S38)

a r diss and standard error have units of mol m –2 s –1
Rate laws were determined by plotting the log of the dissolution rates from Eq. 2 against the pH of the experiment, and then fitting the points with a linear regression. The resulting rate law was of the form:

where k diss is the dissolution rate constant, and n is the reaction order with respect to H+.
In order to provide a comparison to studies of other rapidly dissolving phases (e.g. Elwood-Madden et al. Reference Elwood-Madden, Madden, Rimstidt, Zahrai, Kendall and Miller2012; Miller et al. Reference Miller, Elwood-Madden, Phillips-Lander, Pritchett and Elwood-Madden2016), particle lifetimes of Fe-free allophane, Fe-poor allophane, and Fe-rich allophane were calculated by the shrinking sphere model (Lasaga Reference Lasaga1984):

where t is the particle lifetime (s), d is the particle diameter (m), r diss is the dissolution rate (mol m–2 s–1) from Eq. 3, and V m is the molar volume (m3 mol–1). The molar volume of all allophane samples was assumed to be ~ 101 cm3 mol–1 based on density values from Wada (Reference Wada1989) and calculated molecular mass because significant volume change is not expected due to Fe-substitution in allophanes (Baker et al. Reference Baker, Nickerson and Strawn2014). The particle lifetime was calculated for a particle 1 μm in diameter to facilitate comparison with similar studies (e.g. Elwood-Madden et al. Reference Elwood-Madden, Madden, Rimstidt, Zahrai, Kendall and Miller2012; Miller et al. Reference Miller, Elwood-Madden, Phillips-Lander, Pritchett and Elwood-Madden2016), and for the measured particle sizes of allophane aggregates in the present study (given in Table 1). This calculation is presented as a first-order estimate of allophane particle lifetimes because allophane does not typically form solid, spherical particles in nature.
Characterization of Reacted Materials
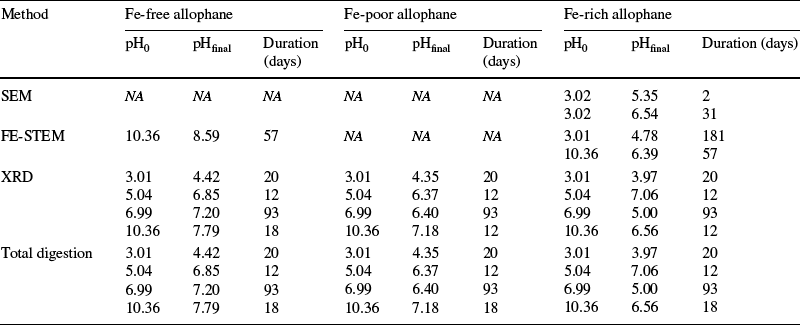
Following dissolution experiments, the solution was decanted from the dissolution vessels and the solid material was centrifuged at 15,557 × g for 5 min, washed twice with deionized water to remove excess NaCl, and then frozen for at least 24 h before freeze-drying for analysis by SEM, FE-STEM, XRD, and total digestion. The same sample-preparation techniques and the same analytical conditions were used for altered material as for the unreacted material. A summary of characterizations is given in Table 4.
Summary of characterizations of altered synthetic materials

NA = No analysis performed. The various durations for experiments with different pH0 values allowed all experiments to reach steady-state regardless of dissolution rate
Results
Characterization of Unreacted Materials
FTIR-PAS.
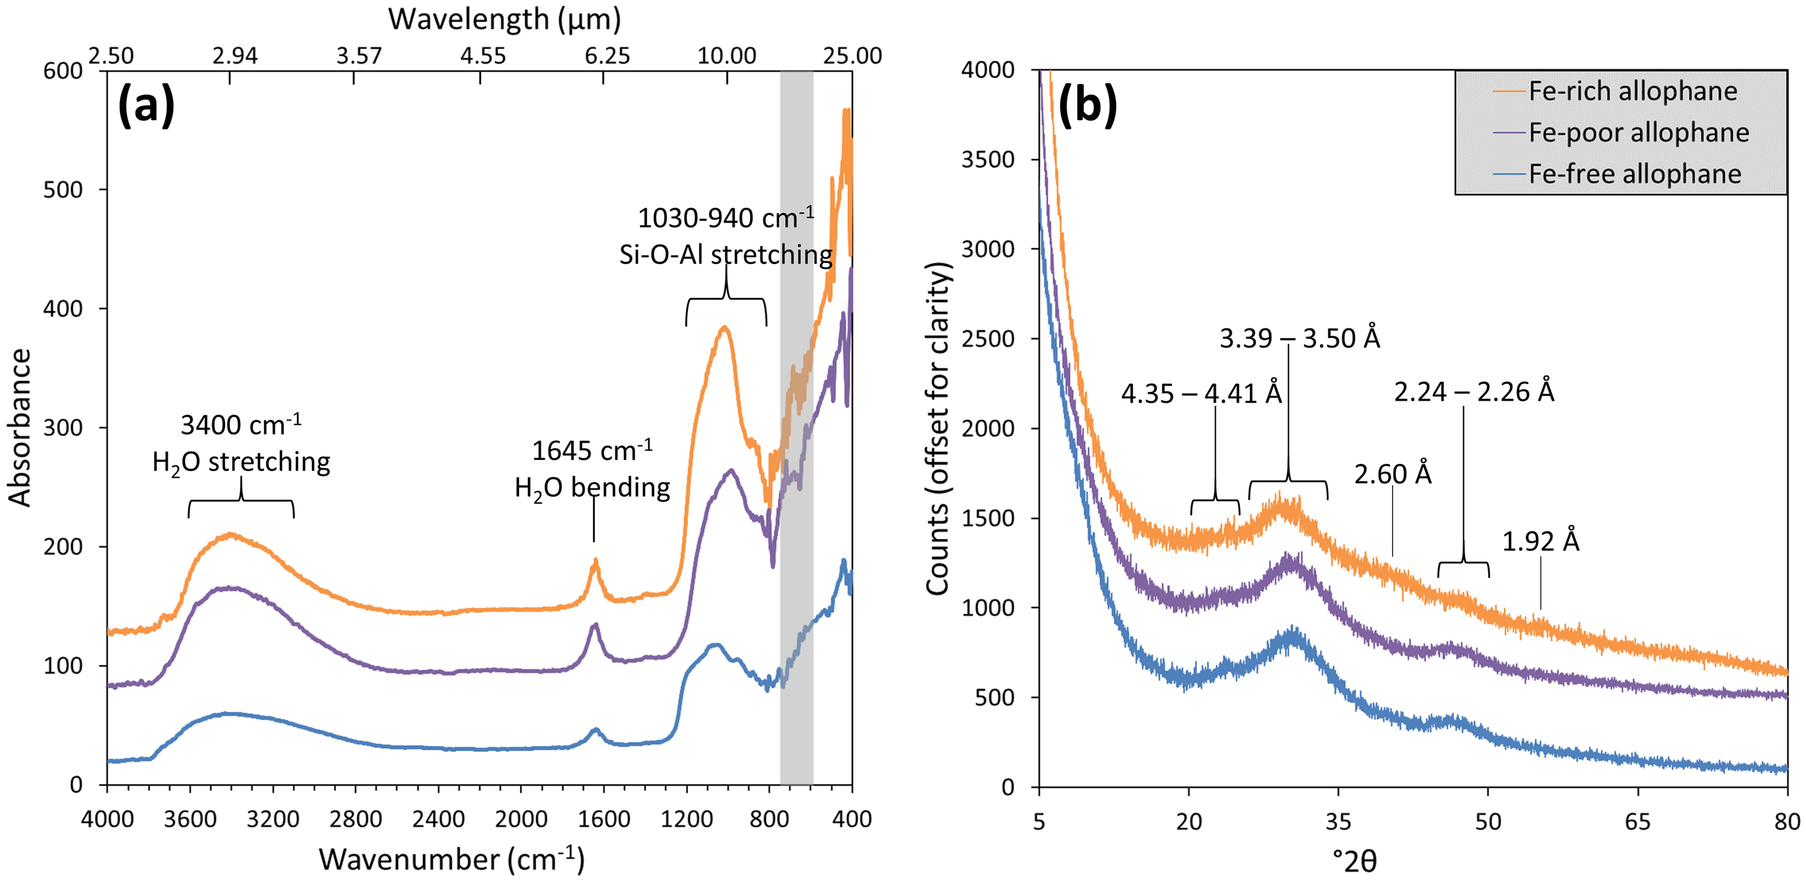
Infrared absorbance spectra for Fe-free allophane, Fe-poor allophane, and Fe-rich allophane (Fig. 2a) were similar to each other and consistent with previously published results (e.g. Wada, Reference Wada1989; Montarges-Pelletier et al. Reference Montarges-Pelletier, Bogenez, Pelletier, Razafitianamaharavo, Ghanbaja, Lartiges and Michot2005; Rampe et al. Reference Rampe, Kraft, Sharp, Golden, Ming and Christensen2012; Bishop et al. Reference Bishop, Rampe, Bish, Abidin, Baker, Matsue and Henmi2013; Milliken and Bish Reference Milliken and Bish2014). All samples had absorption bands at 3400, 1645, 1030, and 940 cm–1, and a weak band near 620 cm–1, and varied from the literature values by < 50 cm–1 (Supplementary Material, Fig. S1). A full description of absorption bands and their assignments is presented in the Supplementary Material.
a FTIR-PAS absorption spectra of synthetic Fe-free allophane, Fe-poor allophane, and Fe-rich allophane. All samples had absorption bands at 3400, 1645, 1030, and 940 cm–1 (labeled), and a weak band near 620 cm–1 (shaded rectangular area), in agreement with literature values for allophane and hisingerite. The spectra are offset for clarity. b XRD patterns of unreacted synthetic Fe-rich allophane, Fe-poor allophane, and Fe-free allophane. In the Fe-rich allophane sample, a broad peak, indicative of nano-crystalline structure, is visible at ~ 3.50 Å (29.6°2θ), with minor broad peaks at 2.60, 2.24, and 1.92 Å (40.2, 47.1, and 55.5°2θ, respectively). In the Fe-poor allophane sample, broad peaks occur at 4.41, 3.42, and 2.26 Å (23.4, 30.3, and 46.6°2θ). In the Fe-free allophane sample, broad peaks occur at 4.35, 3.39, and 2.25 Å (23.7, 30.6, and 46.8°2θ). All samples show elevated background at low angle indicative of small particle sizes. CoKα radiation was used for all patterns

XRD.
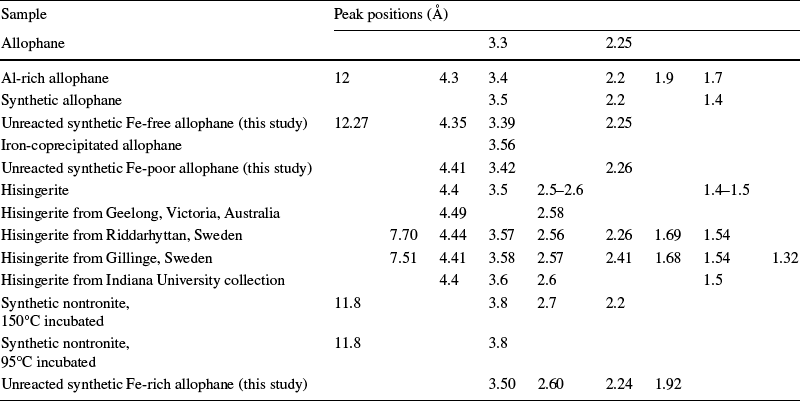
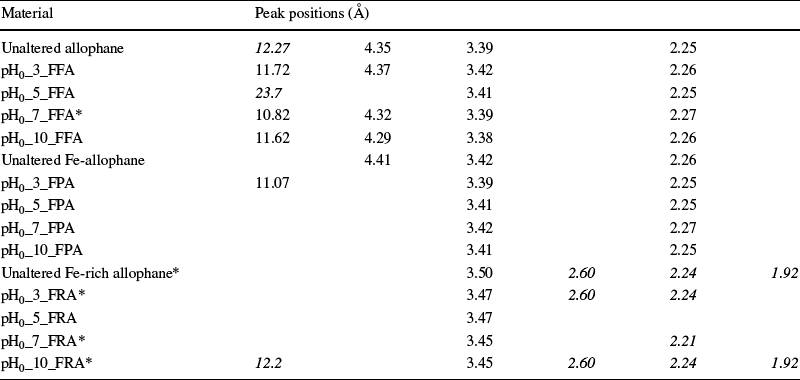
Unreacted Fe-free allophane, Fe-poor allophane, and Fe-rich allophane had similar diffraction patterns with elevated low-angle background and broad peaks (Fig. 2b, Fig. S2), indicating an abundance of small particles and nano-crystalline structure, respectively (van der Gaast and Vaars Reference Van der Gaast and Vaars1981). These synthetic materials have XRD patterns consistent with previous measurements of allophane and Fe-substituted allophane. The peak positions obtained by XRD for unreacted, synthesized, Fe-free allophane, Fe-poor allophane, and Fe-rich allophane are presented in Table 5 along with literature values for natural and synthetic allophane samples and natural hisingerite samples. Mustoe (Reference Mustoe1996) presented a similar summary of the d spacings of various natural hisingerite samples from many locations, indicating variations in d spacings of up to 0.3 Å, as well as variability in the number of observed peaks. Values for hisingerite are included as a proxy for Fe-rich allophane, as little literature exists on Fe-rich allophane (Ossaka et al. Reference Ossaka, Iwai, Kasai, Shirai and Hamada1971; Farmer Reference Farmer1997; Baker and Strawn Reference Baker and Strawn2014).
A summary of the peak positions observed in various natural and synthetic allophane and hisingerite samples

Table 8 gives peak positions for all materials, unreacted and reacted, examined in the present study. Data for allophane from Wada and Yoshinaga (Reference Wada and Yoshinaga1969); data for Al-rich allophane from Parfitt (Reference Parfitt2009); data for synthetic allophane from Rampe et al. (Reference Rampe, Kraft, Sharp, Golden, Ming and Christensen2012); data for iron-coprecipitated allophane from Ossaka et al. (Reference Ossaka, Iwai, Kasai, Shirai and Hamada1971); data for hisingerite from Henmi et al. (Reference Henmi, Wells, Childs and Parfitt1980); data for hisingerite from Geelong, Victoria, Australia from Shayan et al. (Reference Shayan, Sanders and Lancucki1988); data for hisingerite from Riddarhyttan, Sweden, and Gillinge, Sweden from Eggleton and Tilley (Reference Eggleton and Tilley1998); data for hisingerite from Indiana University collection from Milliken and Bish (Reference Milliken and Bish2014); data for synthetic nontronites incubated at 150°C and 95°C from Baker and Strawn (Reference Baker and Strawn2014)
EGA.
Fe-free allophane, Fe-poor allophane, and Fe-rich allophane exhibited a sharp H2O release centered at ~ 130°C, probably due to release of adsorbed H2O (Fig. S3), followed by a broader release from ~ 130–400 °C which may be due to release of structural H2O, consistent with previous laboratory measurements of water release from allophane (e.g. Bish and Duffy Reference Bish, Duffy, Stucki and Bish1990). Release of O2 occurred concurrently with H2O release in all samples (Figs S3–S4), indicating that the O2 production resulted from fragmentation of H2O during ionization in the mass spectrometer. Overall, these observations are consistent with previous EGA measurements for allophane (e.g. Bish and Duffy Reference Bish, Duffy, Stucki and Bish1990; Rampe et al. Reference Rampe, Morris, Archer, Agresti and Ming2016). Differential scanning calorimetry (DSC) performed concurrently with EGA agreed well with differential thermal analysis (DTA) of Fe-substituted allophanes by Ossaka et al. (Reference Ossaka, Iwai, Kasai, Shirai and Hamada1971), with a peak at 960 ± 10°C for Fe-free allophane that broadened and shifted to lower temperature with increasing Fe content (924 ± 1°C for Fe-poor allophane and 791 ± 1°C for Fe-rich allophane; Fig. S5).
Microscopy.
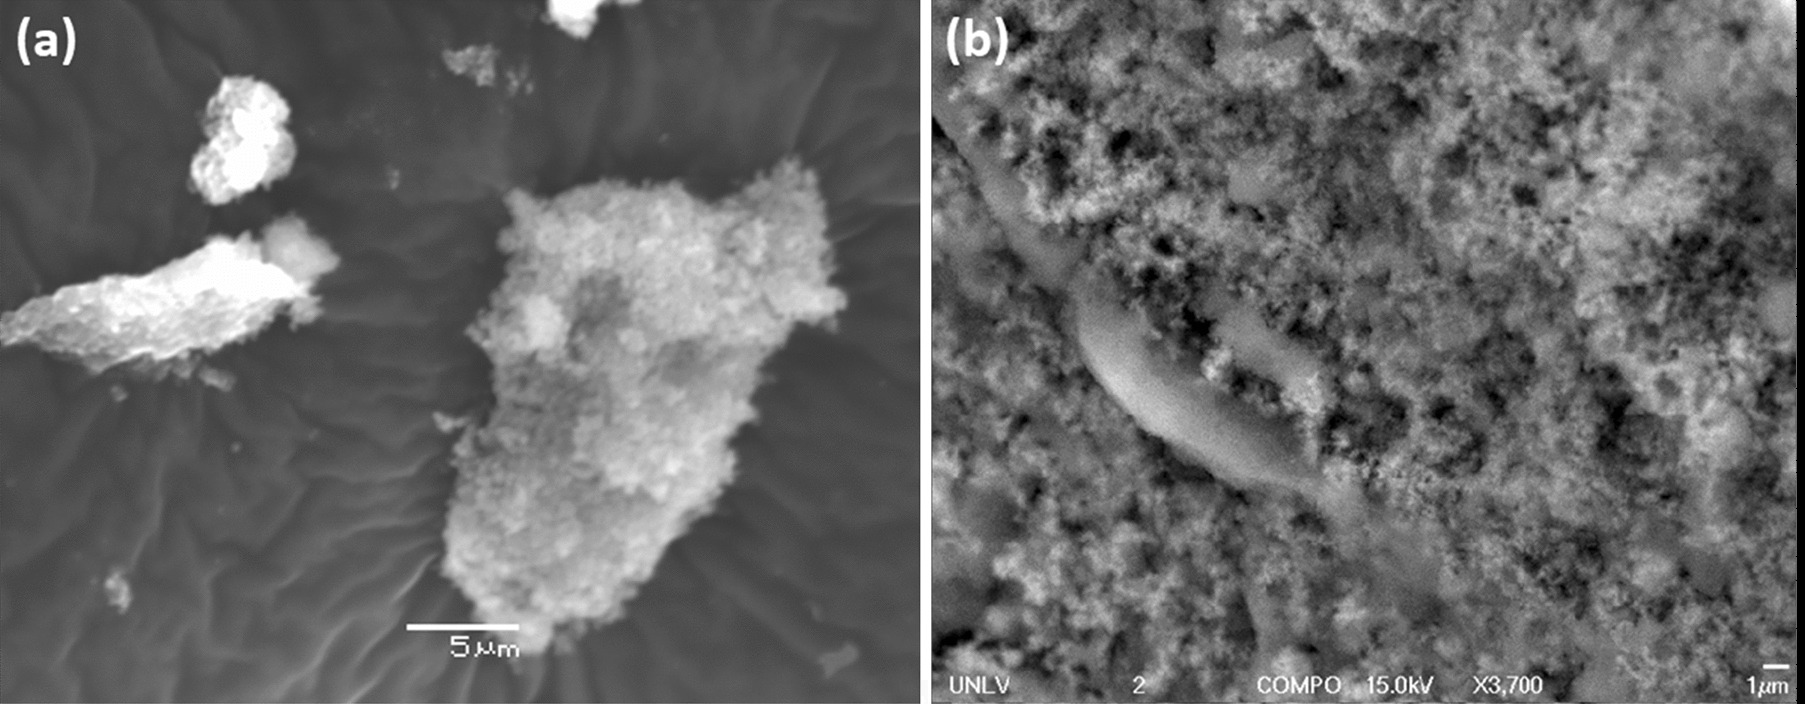
In general, unreacted samples examined by SEM consisted of large, smooth grains ~ 300–600 µm across coated with much smaller (~ 10–50 µm) flakes of ‘fluffy’ material (Figs 3a and S6). Semi-quantitative EDS analyses, conducted concurrently with SEM investigations, yielded mainly Al, Si, and Fe compositions consistent with synthesis ratios, and no major compositional differences were observed between the larger, smooth grains and the smaller, ‘fluffy’ material (Table S1). FE-SEM analyses of unreacted material also showed that all samples contained small, ‘fluffy’ aggregates (e.g. Figs 3b and S7) as well as large chunks of material that are probably aggregates formed during centrifugation due to the rapid rotation speed (15,557 × g) required to pull fine particles out of suspension. Chloride was detected in a few samples, probably the result of incomplete washing, but was not prevalent (Table S1).
Synthetic Fe-rich allophane imaged by a SEM and b FE-SEM. Nano-spherules are distinguishable in the ‘fluffy’ texture of the aggregate. Similar textures were observed in Fe-free allophane and Fe-poor allophane samples (Figs S6–S7). The long, apparently smooth object in b is a ridge of ‘fluffy’ material that is out of focus

Particles with nano-spherule structures, indicative of allophane, were observed in the FE-STEM subsamples of the unreacted synthetic materials (Fig. 4). Nano-spherules have previously been observed in samples of natural allophane (e.g. Wada Reference Wada1989; Iyoda et al. Reference Iyoda, Hayashi, Arakawa, John, Okamoto, Hayashi and Yuan2012) and natural hisingerite (e.g. Eggleton and Tilley Reference Eggleton and Tilley1998). The majority of Fe-rich allophane material was structurally disordered (i.e. amorphous) based on HRTEM images analyzed by Fourier-transform image processing (Fig. 4b). Some synthetic Fe-rich allophane particles exhibited poorly developed lattice fringes in localized regions (e.g. Fig. 4c), indicative of mid- to long-range order. Synthetic Fe-free allophane showed no lattice fringes, however, even when exposed to the electron beam for several minutes (Fig. 4e–f). Two different textures were also observed in the Fe-free allophane sample; one ‘rugged’ and one ‘blobby’ (e.g. Figure 4d). A similar textural dichotomy has previously been observed in hisingerite-like, poorly crystalline Si-Fe materials (e.g. Decarreau et al. Reference Decarreau, Bonnin, Badaut-Trauth, Couty and Kaiser1987). Based on observations of a similar texture in the altered Fe-free allophane, the ‘blobby’ texture is probably more hydrated than the ‘rugged’ texture. Only the ‘rugged’ texture was observed in the Fe-rich allophane. These morphologies are consistent with those presented by Wada (Reference Wada1989) for natural allophane and by Eggleton and Tilley (Reference Eggleton and Tilley1998) for natural hisingerite.
FE-STEM images of: a–c synthetic Fe-rich allophane and d–f Fe-free allophane. a Agglomerate of synthetic Fe-rich allophane. b Diffraction pattern from an agglomerate of unaltered synthetic Fe-rich allophane, obtained during TEM investigations. Diffuse rings are visible, indicating a nanocrystalline structure. Diffractograms were not obtained for synthetic Fe-free allophane due to its lack of lattice fringes, indicating no long-range order. c A very high-magnification view of synthetic Fe-rich allophane. Lattice fringes (arrows) indicate some crystalline structure. d An agglomerate of synthetic Fe-free allophane. Nano-spherule-like structures are visible along the edges of the agglomerate. Both the ‘rugged’ (black arrow) and ‘blobby’ (white arrow) textures are visible. e A closer view of d, showcasing the ‘rugged’ nano-spherule structures. f Very high magnification of synthetic Fe-free allophane. Note the lack of lattice fringes, indicating no long-range crystal structure

BET Surface Area and Particle-size Analysis.
The average BET SSA and particle sizes for unaltered Fe-free allophane, Fe-poor allophane, and Fe-rich allophane are given in Table 1. The average BET SSA for each material was used to normalize the initial dissolution rates to surface area. The BET surface area is not a perfect measurement of reactive surface area, however (Gautier et al. Reference Gautier, Oelkers and Schott2001; Velbel Reference Velbel1993), especially in the case of materials with large internal surface areas, such as allophane. Additionally, due to the tendency for allophane to form large aggregates consisting of hollow, porous nano-spheres (e.g. Figure 3; Abidin et al. Reference Abidin, Matsue and Henmi2004), the particle sizes reported here represent the mean sizes of aggregate “grains” of each material, which help to explain the apparent discrepancy between large particle sizes and large surface areas. The complete results of particle-size analyses and BET SSA analyses are given in Table S2.
Total digestions.
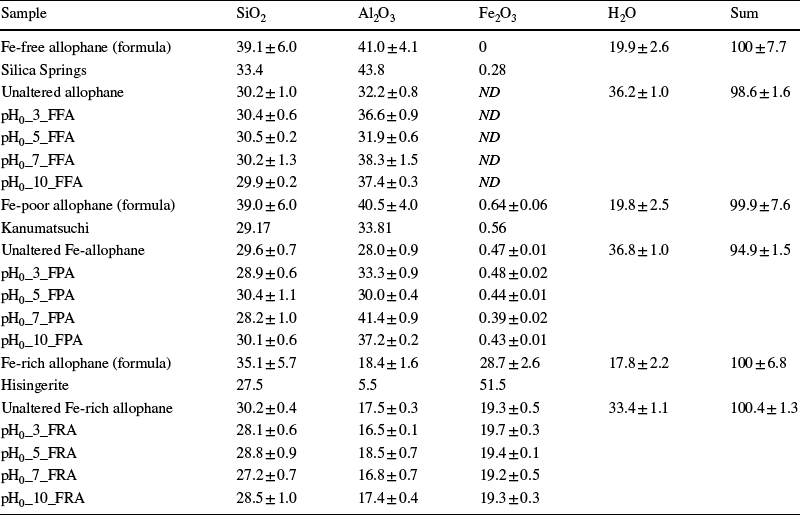
Comparison of digestion data with predicted compositions of the unaltered materials from the formulae indicated additional water present in the synthesized phases, either structural or adsorbed, as well as the phases potentially being enriched in Al (Table 6). The compositions of synthetic Fe-free allophane and Fe-poor allophane are similar to some natural samples, and synthetic Fe-rich allophane is similar to certain synthetic hisingerites used in other studies (e.g. Baker and Strawn Reference Baker and Strawn2014), although it is more Al-rich than most natural hisingerite samples and the Mars amorphous component, and more Fe-rich than most natural allophane samples (Tables 4, S3−S6).
Compositions in wt.% oxide of unaltered and altered Fe-free allophane, Fe-poor allophane, and Fe-rich allophane determined by ICP-MS analysis of total digestion products (for SiO2, Al2O3, and Fe2O3) and thermal gravimetric analysis (TGA; for H2O) compared with samples from the literature and the approximate values expected from the chemical formulae

Error in the ‘formula’ phases was determined by comparing variable Si, Al, Fe, and H2O contents in endmember compositions. Error in the analyzed samples represents the standard deviation between two runs of each sample. TGA was not conducted on altered samples because insufficient sample mass was available for analysis. Comparisons of the composition of each unaltered synthetic material with multiple samples from the literature are given in Tables S3–S5
ND = not detected
Data for Silica Springs from Theng et al. (Reference Theng, Russell, Churchman and Parfitt1982); data for Kanumatsuchi from Kitagawa (Reference Kitagawa1974); data for hisingerite from Hisinger (Reference Hisinger1828)
Dissolution Experiments
Solution chemistry.
For all experiments, an initial rapid linear change in pH occurred (Fig. 5), which then leveled off to a steady pH value (pHsteady), corresponding to a stage in which a lack of change in solution chemistry was observed (Fig. S8, Data Sheets S1–S38). The average pH of the linear release stage was calculated and used as the pH of the experiment for calculation of the rate constant (see the Calculations section). The initial and final pH data for the linear release stage of dissolution are summarized in Table 3.
Observed change in solution pH with time over the range used to calculate dissolution rates for experiments with a pH0 3, b pH0 5, c pH0 7, and d pH0 10. Points are the average pH value between two duplicates. Solution pH was measured over the course of the entire experiments (see Fig. S8). Balanced chemical equations (see Supplementary Material, Section S8) explain the observed pH changes

The production or consumption of H+ during dissolution of Fe-free allophane, Fe-poor allophane, and Fe-rich allophane can explain the observed pH trends, as well as the potential for formation of secondary phases. For example, the dissolution of Fe-free allophane at pH0 3 is described by the reaction:

where H+ ions are consumed, driving the increase in pH with time observed in the pH0_3_FFA experiment. At pH0 10, the dissolution of Fe-free allophane is described by the reaction:

where H+ ions are produced, driving the decrease in pH with time observed in the pH0_10_FFA experiment. The relationship between predicted production and consumption of H+ ions and observed changes in pH in these experiments was consistent across the range of pH conditions studied (Supplementary Material, Section S8). Although dissolution was not stoichiometric, the general trends described by the equations held true; namely, that the predicted production and uptake of H+ ions during Fe-rich allophane dissolution was less than that predicted during Fe-free allophane and Fe-poor allophane dissolution. The scatter in the experimental rate data was probably due to the small dependence of silica release rate on pH and possibly also due to pH change during the experiments (Figs 5 and S8).
Fe remained below the practical quantitation limit of the atomic absorption spectrometer (< 0.2 mg L–1) throughout the duration of the experiment in all experiments except pH0_3_FRA. Iron concentration in solution in the pH0_3_FRA experiment first increased rapidly, then decreased more slowly (Figs 1a, S9). Likewise, Al was only above the practical quantitation limit (1.0 mg L–1) in the pH0 3 experiments, probably because these were the only experiments where the pH remained below ~ 5 for the duration of the experiment, and Al precipitation is expected near or above pH ~ 5. Al concentration in the pH0 3 experiments first rose rapidly, and then leveled off or decreased slowly as the pH approached pHsteady, similar to the behavior of Fe in these solutions (Figs 1a, S10).
For all experiments, Si concentrations were above the practical quantitation limit (0.2 mg L–1) at all time points (Figs 1a, S11–S14), and changes in Si concentrations were similar to trends in pH. Initially, dissolved Si concentrations increased linearly (e.g. Figure 1b), and then leveled off gradually to steady concentrations of ~ 0.2–0.5 mM within 18 days.
Dissolution of Fe-free allophane, Fe-poor allophane, and Fe-rich allophane was non-stoichiometric at pH0 3. During the pH0_3_FRA experiment, Fe release was always below the ~ 0.5:1 stoichiometric formula Fe/Si ratio, while Al release was initially greater than the ~ 0.5:1 stoichiometric formula Al/Si ratio, and then decreased with time to approximately stoichiometric formula values (Fig. 6). The pH0_3_FFA and pH0_3_FPA experiments also showed Al/Si ratios in solution that were initially above stoichiometric formula values and then decreased to below the ~ 1:1 stoichiometric formula value (Fig. 6). Determination of whether dissolution at pH0 5, 7, and 10 was stoichiometric was not possible because dissolved Fe and Al remained below the practical quantitation limit of the AA spectrometer throughout these experiments; low concentrations in solution could have been due to precipitation of secondary phases or adsorption of Fe3+ and Al3+ onto surfaces. Solution chemistry for each time point for each experiment is reported in the Supplementary Material (Section S10).
a Al/Si ratio and b Fe/Si ratio measured from solution in pH0 3 experiments versus time. Points where Fe, Al, or Si were below detection are not plotted. The formula ratios of the unaltered Fe-free allophane (FFA), Fe-poor allophane (FPA), and Fe-rich allophane (FRA) are indicated by FFA Initial, FPA Initial, and FRA Initial, respectively. In panel b, the Fe/Si synthesis ratio of the unaltered Fe-rich allophane is 0.5, well above any of the measured ratios in the solutions studied

Rate law.
Surface area-normalized dissolution rate laws (r diss, Eq. 3) were logr diss = –10.65–0.15 × pH for Fe-free allophane, logr diss = –10.35–0.22 × pH for Fe-poor allophane, and logr diss = –11.46–0.042 × pH for Fe-rich allophane. Rate laws for each material were plotted along with the measured rate for each experiment (Fig. 7). The pH dependence for all materials was low; for Fe-free allophane, n = 0.146 ± 0.026; for Fe-poor allophane, n = 0.222 ± 0.040; and for Fe-rich allophane, n = 0.042 ± 0.016, where the error is the 1σ standard deviation of n. The pH dependence of Fe-free allophane and Fe-poor allophane dissolution were almost the same within uncertainty, which is not surprising given the structural and compositional similarity of these phases.
Average of the dissolution rates (points) and rate laws calculated as described in the text (lines) for Fe-free allophane, Fe-poor allophane, and Fe-rich allophane at pH0 values of 3, 5, 7, and 10. Error bars represent the 1σ standard deviation between duplicate experiments. Overall, the pH-dependence of dissolution was low. All experimental data are given in the Supplementary Material

The pH dependence of Fe-rich allophane dissolution was lower than that of the Fe-free allophane and Fe-poor allophane. Similar trends in the pH-dependence of dissolution are observed for Al-rich montmorillonite (e.g. Huertas et al. Reference Huertas, Caballero, Jiménez de Cisneros, Huertas and Linares2001; Rozalen et al. Reference Rozalen, Huertas, Brady, Cama, GarcíaPalma and Linares2008) and Fe3+-rich nontronite (e.g. Gainey et al. Reference Gainey, Hausrath, Hurowitz and Milliken2014), and amorphous Al- and Fe3+-phosphates (Tu et al. Reference Tu, Hausrath, Tschauner, Iota and Egeland2014), with the Fe-rich material showing a lower pH dependence than the Al-rich material in both cases. Although the water exchange rate around Fe has been shown to be more rapid than that around Al (e.g. Helm and Merbach Reference Helm and Merbach2005; Miller et al. Reference Miller, Elwood-Madden, Phillips-Lander, Pritchett and Elwood-Madden2016), the first hydrolysis constant for Fe3+ is much larger than that of Al3+ (Lamb and Jacques Reference Lamb and Jacques1938; Frink and Peech Reference Frink and Peech1963), which may result in the rapid formation of Fe hydroxides (e.g. Hsu Reference Hsu1976). Additionally, precipitation of Fe-oxide or oxyhydroxide coatings on material surfaces may protect those surfaces from the surrounding solution and, therefore, slow dissolution of Fe-rich materials compared to Al-rich materials under acidic conditions.
Particle lifetimes.
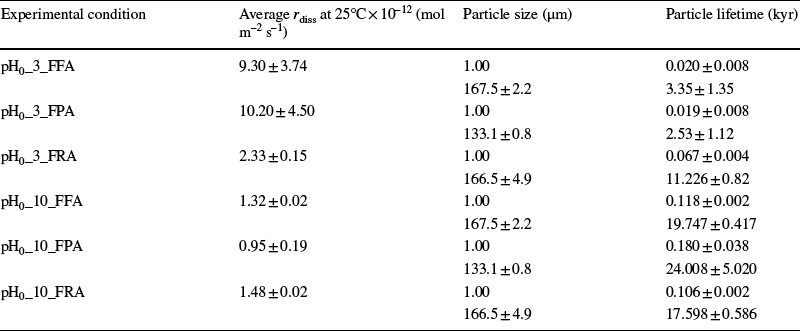
Particle lifetimes for Fe-free allophane, Fe-poor allophane, and Fe-rich allophane are given in Table 7. Particle lifetimes were calculated both for a 1 μm particle for comparison to literature on other rapidly dissolving phases (e.g. Elwood-Madden et al. Reference Elwood-Madden, Madden, Rimstidt, Zahrai, Kendall and Miller2012; Miller et al. Reference Miller, Elwood-Madden, Phillips-Lander, Pritchett and Elwood-Madden2016) and using the measured particle size of each unaltered material (Table 1). Particle lifetimes are 0.02–0.18 kyr for a 1 μm particle, and 2.5–24.0 kyr for the measured particle sizes. Field dissolution rates of silicate minerals are generally ~ 2 orders of magnitude slower than laboratory dissolution rates (e.g. Velbel Reference Velbel1993; Zhu et al. Reference Zhu, Liu, Zhang, Wang, Scheafer, Lu, Zhang, Georg, Yuan and Rimstidt2016), giving a final estimate of between 1.9 and 6.7 kyr for the lifetime of a 1 μm allophane particle in moderately acidic waters, and between 10.6 and 18.0 kyr in moderately alkaline waters, consistent with other estimates of the lifetime of martian waters based on the dissolution of rapidly dissolving phases (e.g. Elwood-Madden et al. Reference Elwood-Madden, Madden and Rimstidt2009). Using the measured particle sizes, these estimates extend to 0.3–2.4 Myr. Lower temperatures, higher salinities (> ~ 0.05 M), and the presence of liquid water intermittently, rather than persistently, would also extend these lifetimes.
Particle lifetimes for Fe-free allophane, Fe-poor allophane, and Fe-rich allophane calculated with Eq. 4

The molar volume of all allophanes was assumed to be 1.01 × 10 –4 m2 mol –1. Error (where given) represents the 1σ standard deviation between duplicates
Calculated peak positions for unreacted Fe-free allophane, Fe-poor allophane, and Fe-rich allophane, and for the altered materials from experiments with pH0 values of 3, 5, 7, and 10. Numbers in italics are from minor peaks

*Quartz contamination from grinding in agate mortar and pestle was observed in the form of a small, sharp peak at 3.34 Å. Contamination was more common in Fe-rich samples because the Fe-rich allophane was harder than the other allophanes and required more rigorous grinding
An important caveat to these lifetimes is that allophane does not generally form solid spherical particles; rather, it forms loose aggregates that span tens of microns, each made up of hollow, porous nano-spheres ~ 5–50 nm in diameter (Figs 3 and S6–S7), which may not dissolve according to the shrinking sphere model. Although natural allophane is present in soils up to ~ 2 kyr old in tropical climates (Bleeker and Parfitt Reference Bleeker and Parfitt1974) and in soils > 30 kyr old in more temperate zones (Nagasawa Reference Nagasawa, Sudo and Shimoda1978), allophane in these soils may exist as an intermediate material, being simultaneously formed and transformed to more ordered phases or dissolved, potentially in different zones of the soil. Regions where allophane is present would then represent an environment where the accumulation rate of allophane is equal to or greater than the rate at which allophane is transformed or dissolved, and not necessarily regions where allophane particle lifetimes are tens of thousands of years.
Characterization of Reacted Materials
XRD.
Samples of Fe-free allophane, Fe-poor allophane, and Fe-rich allophane from each experiment were examined with XRD to investigate the possible formation of secondary phases. No well crystallized products, such as gibbsite or hematite, were present above the detection limit of the instrument (~ 1 wt.%); however, a broad, low-angle peak developed as a result of alteration in Fe-free allophane reacted at pH0 3, 7, and 10; in Fe-poor allophane reacted at pH0 3; and in Fe-rich allophane reacted at pH0 10 (Figs 8 and S15). This broad peak occurs near 11–12 Å, larger than the typical (001) d spacing for kaolinite (~ 7.2 Å, Goodyear and Duffin Reference Goodyear and Duffin1961) and smaller than that of type examples of hydrated smectites (13.5–15 Å, Moore and Reynolds Reference Moore and Reynolds1997), although similar to the (001) peak observed by Pickering (Reference Pickering2014) in the partially hydrated SWy-2 Na-montmorillonite (11.8 Å) and certain other samples of montmorillonite (e.g. Kloprogge et al. Reference Kloprogge, Evans, Hickey and Frost2002, with d spacings of 11.5–15.0 Å). The 11–12 Å peak could alternately be due to the collapse of a smectite-like phase due to exposure to vacuum during freeze-drying (e.g. Frushour and Bish Reference Frushour and Bish2017). Therefore, this broad peak may represent the early development of a clay mineral, as also seen in the HRTEM results. The observed peak positions for all reacted and unreacted materials are given in Table 8.
XRD patterns of unreacted Fe-free allophane and Fe-free allophane reacted at pH0 3 (pH0_3_FFA), demonstrating the development of a possible phyllosilicate-like precursor phase (arrow) with a peak centered around 12.3 Å. A similar, but less pronounced, feature was observed in Fe-free allophane samples reacted at pH0 7 and 10, in Fe-poor allophane reacted at pH0 3, and in Fe-rich allophane reacted at pH0 10. XRD patterns of all unreacted and reacted materials were collected (see Fig. S15). CoKα radiation was used for all patterns

Microscopy.
Analyses by SEM of pH0_3_FRA (pHsteady ~ 4) reacted for two days and for one month revealed that the grain texture tended to become more porous with increasing dissolution time, and that the grains themselves tended to become smaller (Figs S16–S17), possibly indicating the presence of less ordered material that dissolves more rapidly than the surrounding material, causing disaggregation. Analyses of reacted materials by SEM are summarized in Table S1.
After a 2-month reaction time, pH0_10_FRA showed the formation of small (~ 2 µm) linear features within the larger Fe-rich allophane aggregates (Figs 9a and S18) in HRTEM analysis (analyses of reacted materials by HRTEM are summarized in Table S7). These features were interpreted as the rolled or curled edges of silicate sheets, possibly due to the incipient conversion to phyllosilicate. Similar features have been observed in synthetic hisingerite-like Si-Fe precipitates, and were also interpreted as the edges of phyllosilicate layers (Decarreau et al. Reference Decarreau, Bonnin, Badaut-Trauth, Couty and Kaiser1987). Overall, the material was still poorly crystalline, and the linear features did not demonstrate a greater degree of crystallinity than the surrounding masses, as demonstrated by their lack of lattice fringes. The linear features were also observed in pH0_3_FRA reacted for 6 months, although they were much less prevalent (Fig. S19). In contrast, no linear features were observed in unaltered Fe-rich allophane.
FE-STEM images of a synthetic Fe-rich allophane and b synthetic Fe-free allophane, each reacted at pHsteady values of ~ 8 (pH0 10) for 57 days. Edge-curl features were much less prevalent in the Fe-free allophane sample than in the Fe-rich allophane (see Fig. S20 for an example of an edge-curl feature in the Fe-free allophane). a Arrows indicate linear features that may represent the curled edges of incipient phyllosilicate-like sheets. b The ‘blobby’ morphology is visible on the left (black arrow), while the ‘rugged’ morphology is on the right (white arrow)

Only a few of these linear “edge-curl” features were observed in pH0_10_FFA reacted for 2 months (Fig. S20). Fe-free allophane also maintained the morphological dichotomy between a ‘rugged’ texture and a ‘blobby’ texture (Fig. 9b) seen in the unreacted material. The ‘blobby’ texture was rapidly destroyed by the high-energy STEM beam, while the ‘rugged’ texture was more robust, suggesting a higher degree of hydration in the ‘blobby’ material (Fig. S21; Decarreau et al. Reference Decarreau, Bonnin, Badaut-Trauth, Couty and Kaiser1987). This extreme beam sensitivity was only observed directly in the altered Fe-free allophane but may also be true of the unaltered Fe-free allophane. No ‘blobby’ material was observed in the altered or unaltered Fe-rich allophane samples.
Total digestion.
Changes in bulk chemistry due to dissolution are given in Table 6. Total digestions showed that SiO2 was released preferentially from some samples (e.g. pH0_7_FPA), while others (e.g. pH0_7_FFA) maintained relatively stable SiO2 content. The amount of SiO2 released during dissolution of Fe-rich allophane correlated well with the change in bulk SiO2 content measured by total digestion (Fig. S22). Neither Fe-poor allophane nor Fe-rich allophane showed detectable differences in Fe2O3 between experimental conditions and the unreacted samples. The observed enrichment in Al2O3 in some samples (e.g. pH0_10_FFA) was due to a net loss of SiO2 from the samples. This was corroborated by the pH0_7_FPA experiment, where the greatest net loss of SiO2 (~ 1 wt.% versus the unreacted sample) was accompanied by the greatest enrichment in Al2O3 (~ 12 wt.% versus the unreacted sample). No correlation between SiO2 loss and Al2O3 enrichment or loss was observed in the Fe-rich allophane samples.
DISCUSSION.
Comparison of Synthetic and Martian Amorphous Materials
Comparison of synthetic materials with phases found on the martian surface is necessary to ensure that they are appropriate functional analogs. These synthetic analogs can help elucidate properties of the amorphous component in martian rocks and soils that cannot be examined with current remote instrumentation, such as dissolution kinetics, micro-morphology, and formation of secondary phases.
The XRD patterns of synthesized Fe-free allophane, Fe-poor allophane, and Fe-rich allophane all have broad peaks centered around 28º2θ CoKα (3.39–3.5 Å, Fig. 2b, Tables 5 and 8), similar to the amorphous humps in the CheMin patterns of samples from Gale crater (Fig. 10), including the Rocknest ‘soil’ sample and the Cumberland, John Klein, and Windjana rock samples (Bish et al. Reference Bish, Blake, Vaniman, Chipera, Morris, Ming, Treiman, Sarrazin, Morrison, Downs, Achilles, Yen, Bristow, Crisp, Morookian, Farmer, Rampe, Stolper and Spanovich2013; Achilles et al. Reference Achilles, Downs, Ming, Rampe, Morris, Treiman, Morrison, Blake, Vaniman, Ewing, Chipera, Yen, Bristow, Ehlmann, Gellert, Hazen, Fendrich, Craig, Grotzinger and Morookian2017). Mass-balance calculations (e.g. Dehouck et al. Reference Dehouck, McLennan, Meslin and Cousin2014; Vaniman et al. Reference Vaniman, Bish, Ming, Bristow, Morris, Blake, Chipera, Morrison, Treiman, Rampe, Rice, Achilles, Grotzinger, McLennan, Williams, Bell, Newsom, Downs, Maurice, Sarrazin, Yen, Morookian, Farmer, Stack, Milliken, Ehlmann, Sumner, Berger, Crisp, Hurowitz, Anderson, Des Marais, Stolper, Edgett, Gupta and Spanovich2014; Morrison et al. Reference Morrison, Downs, Blake, Vaniman, Ming, Hazen, Treiman, Achilles, Yen, Morris, Rampe, Bristow, Chipera, Sarrazin, Gellert, Fendrich, Morookian, Farmer, Des Marais and Craig2018; Achilles et al. Reference Achilles, Downs, Ming, Rampe, Morris, Treiman, Morrison, Blake, Vaniman, Ewing, Chipera, Yen, Bristow, Ehlmann, Gellert, Hazen, Fendrich, Craig, Grotzinger and Morookian2017; Rampe et al. Reference Rampe, Lapotre, Bristow, Arvidson, Morris, Achilles, Weitz, Blake, Ming, Morrison, Vaniman, Chipera, Downs, Grotzinger, Hazen, Peretyazhko, Sutter, Tu, Yen and Treiman2018) provided a range of possible compositions for the martian amorphous component, bearing in mind that the compositions may be slightly skewed by the presence of crystalline phases in abundances below the CheMin detection limit (e.g. Smith et al. Reference Smith, Rampe, Horgan and Dehouck2018; Rampe et al. Reference Rampe, Blake, Bristow, Ming, Vaniman, Morris, Achilles, Chipera, Morrison, Tu, Yen, Castle, Downs, Downs, Grotzinger, Hazen, Treiman, Peretyazhko, Des Marais, Walroth, Craig, Crisp, Lafuente, Morookian, Sarrazin, Thorpe, Bridges, Edgar, Fedo, Freissinet, Gellert, Mahaffy, Newsom, Johnson, Kah, Siebach, Schieber, Sun, Vasavada, Wellington and Wiens2020; Table S6). The Al contents of the synthesized Fe-free allophane, Fe-poor allophane, and Fe-rich allophane are much greater than that of the martian amorphous component (Table S6), which may be due to the presence of other high-silica and high-Fe phases, such as high-silica glasses (e.g. 72.5 wt.% SiO2, 9.36 wt.% Al2O3, 0.95 wt.% FeO; Beard et al. Reference Beard, Downes and Chaussidon2015) and/or opaline silica, Fe oxides, and Fe sulfates in the martian samples (Achilles et al. Reference Achilles, Downs, Ming, Rampe, Morris, Treiman, Morrison, Blake, Vaniman, Ewing, Chipera, Yen, Bristow, Ehlmann, Gellert, Hazen, Fendrich, Craig, Grotzinger and Morookian2017; Rampe et al. Reference Rampe, Ming, Blake, Bristow, Chipera, Grotzinger, Morris, Morrison, Vaniman, Yen, Achilles, Craig, Des Marais, Downs, Farmer, Fendrich, Gellert, Hazen, Kah and Thompson2017). Alternatively, Al-rich amorphous materials, such as allophane, may simply not be present in the Mars amorphous material. The large Fe and Si contents of the martian material indicate that hisingerite (~ 33.5 wt.% Fe, ~ 16.8 wt.% Si; Henmi et al. Reference Henmi, Wells, Childs and Parfitt1980) or a co-occurrence of ferrihydrite and amorphous silica are plausible component phases (Dehouck et al. Reference Dehouck, McLennan, Sklute and Darby Dyar2017).
Comparison of the XRD patterns of synthetic Fe-free allophane, Fe-poor allophane, and Fe-rich allophane with a 2-line ferrihydrite from the FULLPAT library and the CheMin XRD pattern from the Rocknest soil sample. Panel a shows the full patterns, and panel b is zoomed in to better demonstrate the concordance between amorphous materials from the present study and the amorphous humps in the Rocknest pattern. CoKα radiation was used for all patterns

The EGA data of the synthetic samples used in this study (Figs S3–S4) were dominated by water release at ~ 130–400ºC. The SAM data from the Rocknest, Cumberland, John Klein, and Windjana samples in Gale crater showed H2O release primarily between 100–450ºC, probably including releases from hydrated sulfates and clay minerals (Leshin et al. Reference Leshin, Mahaffy, Webster, Cabane, Coll, Conrad, Archer, Atreya, Brunner, Buch, Eigenbrode, Flesch, Franz, Freissinet, Glavin, McAdam, Miller, Ming, Morris, Navarro-Gonzalez, Niles, Owen, Pepin, Squyres, Steele, Stern, Summons, Sumner, Sutter, Szopa, Teinturier, Trainer, Wray and Grotzinger2013; Sutter et al. Reference Sutter, McAdam, Mahaffy, Ming, Edgett, Rampe, Eigenbrode, Franz, Freissinet, Grotzinger, Steele, House, Archer, Malespin, Navarro-González, Stern, Bell, Calef, Gellert and Yen2017). The study by Sutter et al. (Reference Sutter, McAdam, Mahaffy, Ming, Edgett, Rampe, Eigenbrode, Franz, Freissinet, Grotzinger, Steele, House, Archer, Malespin, Navarro-González, Stern, Bell, Calef, Gellert and Yen2017) predicted adsorbed water release, perhaps due to allophane and other amorphous phases, below ~ 200ºC, and that by Leshin et al. (Reference Leshin, Mahaffy, Webster, Cabane, Coll, Conrad, Archer, Atreya, Brunner, Buch, Eigenbrode, Flesch, Franz, Freissinet, Glavin, McAdam, Miller, Ming, Morris, Navarro-Gonzalez, Niles, Owen, Pepin, Squyres, Steele, Stern, Summons, Sumner, Sutter, Szopa, Teinturier, Trainer, Wray and Grotzinger2013) attributed water release from martian samples at ~ 110ºC to allophane. These values (≤ 200ºC and ~ 110ºC) are consistent with the measured release at ~ 130–400ºC from the samples examined in the present study. Although only a small fraction of the water release from samples at Gale crater is attributed to amorphous materials, measurements from these synthetic allophanes agree well with that fraction.
Based on current data and the results of XRD, total chemistry, and EGA analyses, therefore, synthetic Fe-free allophane, Fe-poor allophane, and Fe-rich allophane are appropriate analogs for at least portions of the amorphous component in modern martian soils and ancient sedimentary rocks and can be used to help understand better these amorphous materials.
Dissolution Rates and Rate Laws
The dissolution rates measured for Fe-free allophane, Fe-poor allophane, and Fe-rich allophane are within 10% of each other (Fig. 7) and are approximately an order of magnitude faster than dissolution rates of crystalline clay minerals of similar compositions, such as nontronite (Gainey et al. Reference Gainey, Hausrath, Hurowitz and Milliken2014; Steiner et al. Reference Steiner, Hausrath, Elwood-Madden, Tschauner, Ehlmann, Olsen, Gainey and Smith2016) and montmorillonite (e.g. Huertas et al. Reference Huertas, Caballero, Jiménez de Cisneros, Huertas and Linares2001; Rozalen et al. Reference Rozalen, Huertas, Brady, Cama, GarcíaPalma and Linares2008) (Fig. 11). This trend is consistent with trends observed for other amorphous or poorly crystalline materials; amorphous Al and Fe phosphates dissolve more rapidly than crystalline Al and Fe phosphates (Huffman Reference Huffman1960; Tu et al. Reference Tu, Hausrath, Tschauner, Iota and Egeland2014), and amorphous silica dissolves more rapidly than quartz (Liang and Readey Reference Liang and Readey1987). The surface area-normalized dissolution rates measured for Fe-free allophane, Fe-poor allophane, and Fe-rich allophane, however, are similar to those measured for goethite at pH ~ 3 (Cheah et al. Reference Cheah, Kraemer, Cervini-Silva and Sposito2003), amorphous silica at pH ~ 3 (Icenhower and Dove Reference Icenhower and Dove2000), and alunite at pH ~ 3–5 (Miller et al. Reference Miller, Elwood-Madden, Phillips-Lander, Pritchett and Elwood-Madden2016) at the same pH values, and are slower than the surface area-normalized dissolution rates measured for basaltic glass (Gislason and Oelkers Reference Gislason and Oelkers2003) and jarosite (Elwood-Madden et al. Reference Elwood-Madden, Madden, Rimstidt, Zahrai, Kendall and Miller2012) across the pH range (Fig. 11a). Based on the surface area-normalized dissolution rates, interactions between liquid water and poorly crystalline silicate phases, such as allophane and hisingerite, release cations and silica into solution more rapidly than well crystalline silicate phases with similar compositions (especially when polymerized Si is present in the interior of the allophane or hisingerite nano-spherules), but at rates similar to or slightly slower than well crystalline Fe/Al-sulfates and Fe-oxides and amorphous silica. The samples used in the present study, however, have very large BET surface areas (380–510 m2 g–1, Table 1) and BET surface area is not a perfect proxy for reactive surface area (e.g. Gautier et al. Reference Gautier, Oelkers and Schott2001). For example, in both martian and terrestrial environments, mineral dissolution is probably affected by the surface area accessible to water, which may be affected by the size of allophane aggregates (Karube et al. Reference Karube, Nakaishi, Sugimoto and Fujihira1996) or armoring of allophane surfaces by secondary precipitates. To account for the very large specific surface areas of these materials, the measured dissolution rates were also normalized to the mass of material in the reactor (Fig. 11b). The mass-normalized dissolution rates of these synthetic materials are faster than those of montmorillonite, nontronite, goethite, and basaltic glass, and are similar to those of amorphous silica, alunite, and jarosite.
Comparison of the log of: a the surface area-normalized and b mass-normalized dissolution rates of the synthetic Fe-free allophane, Fe-poor allophane, and Fe-rich allophane at 25°C (points) with rate laws for montmorillonite (Rozalen et al. Reference Rozalen, Huertas, Brady, Cama, GarcíaPalma and Linares2008), nontronite (Gainey et al. Reference Gainey, Hausrath, Hurowitz and Milliken2014), natural allophane (Abidin et al. Reference Abidin, Matsue and Henmi2004), basaltic glass (Gislason and Oelkers Reference Gislason and Oelkers2003), goethite (Cheah et al. Reference Cheah, Kraemer, Cervini-Silva and Sposito2003), K-jarosite (Elwood-Madden et al. Reference Elwood-Madden, Madden, Rimstidt, Zahrai, Kendall and Miller2012), alunite (Miller et al. Reference Miller, Elwood-Madden, Phillips-Lander, Pritchett and Elwood-Madden2016), and amorphous silica* (Rimstidt and Barnes Reference Rimstidt and Barnes1980) (lines) *modified to reflect elevated dissolution rates in 0.01 M NaCl as per Icenhower and Dove (Reference Icenhower and Dove2000) in order to make a more direct comparison with the conditions of these dissolution experiments. Slower dissolution rates of allophane relative to glass and jarosite in panel a may be impacted by the very large surface areas of Fe-free allophane (BET SSA ≈ 386 m2 g–1), Fe-poor allophane (BET SSA ≈ 350 m2 g–1), and Fe-rich allophane (BET SSA ≈ 507 m2 g–1), as evidenced by the mass-normalized rates shown in panel b. Error bars are smaller than the points

A low pH dependence was observed for dissolution of all materials in the initial pH range from 3 to 10 (Fe-free allophane, n = 0.145 ± 0.028, Fe-poor allophane, n = 0.222 ± 0.040, and Fe-rich allophane, n = 0.042 ± 0.016). These dependences are much lower than for other silicates with similar compositions; e.g. for montmorillonite, n = 0.34, and nontronite, n = 0.297, under acidic conditions (Huertas et al. Reference Huertas, Caballero, Jiménez de Cisneros, Huertas and Linares2001; Gainey et al. Reference Gainey, Hausrath, Hurowitz and Milliken2014). Based on dissolution experiments with naturally occurring allophane, conducted by Abidin et al. (Reference Abidin, Matsue and Henmi2004), the pH dependence of allophane dissolution probably increases dramatically above pH ~ 10, similar to the trend observed in the pH dependence of kaolinite dissolution (n OH– = 0.472, Palandri and Kharaka Reference Palandri and Kharaka2004 and references therein). In both materials, this is probably due to the increased solubility of silica and aluminum at high pH.
The dissolution behavior of Fe-free allophane, Fe-poor allophane, and Fe-rich allophane — similar dissolution rates, with low reaction orders with respect to pH — may be explained by the structures of allophane and hisingerite. Allophane consists of hollow, porous nano-spherules ~ 5 nm (50 Å) in diameter, formed from a rolled silica sheet surrounded by a gibbsite sheet (Iyoda et al. Reference Iyoda, Hayashi, Arakawa, John, Okamoto, Hayashi and Yuan2012; Wada Reference Wada1989). Additional polymerized Si is contained in the interior of the nano-spherules when the Al:Si ratio is < ~ 2:1 (Jeute et al. Reference Jeute, Baker, Bishop, Abidin and Rampe2021; Childs et al. Reference Childs, Parfitt and Newman1990; Parfitt Reference Parfitt1990). Although gibbsite dissolution has a large reaction order with respect to pH (n = 0.992) (Palandri and Kharaka Reference Palandri and Kharaka2004), dissolution of pure silica phases, such as amorphous silica, does not depend on pH (e.g. Palandri and Kharaka Reference Palandri and Kharaka2004). Dissolution rates based on Si release rates would be expected to be relatively insensitive to pH because the interior polymerized Si can enter solution through the nano-spherule pores regardless of the rate at which the gibbsite layer is dissolved. In the high-acidity experiments (pH0 3), an initial preferential leaching of Al was observed, consistent with the rapid dissolution of an Al-rich layer, and little variation in dissolution rate based on silica release rate was observed across the range of pH conditions, consistent with the mostly independent dissolution of interior silica.
A similar layered nano-spherule structure was observed in hisingerite (Shayan Reference Shayan1984; Eggleton and Tilley Reference Eggleton and Tilley1998) and may also exist in Fe-rich allophane. The hisingerite layers occur in multiple concentric sheets, however, similar to the structure of true phyllosilicates, and form nano-spherules up to 200 Å in diameter (Shayan Reference Shayan1984). These multiple concentric layers may reduce the dissolution rate under acidic conditions by protecting the interior of the spherules from protons in solution. Precipitation of Fe-oxide phases on the surface of hisingerite particles might also inhibit further dissolution by blocking pores or access to surface sites. The dissolution reactions of these synthetic allophanes (e.g. Eq. 5, Section S8) also help explain the lower pH dependence of Fe-rich allophane than the Fe-free and Fe-poor allophanes by demonstrating the reduced consumption/production of H+ by Fe-rich allophane versus Fe-free allophane and Fe-poor allophane.
Release of Fe and Al from synthetic materials in this study was approximately equal to or below stoichiometric values with respect to Si (Fig. 6), with all Fe:Si and Al:Si ratios below stoichiometric values when pHsteady was reached. This non-stoichiometric dissolution indicates that the altered material is probably more Al- and Fe-rich than the starting material, as supported by chemical composition of the reacted samples (Table 8). Aluminum (and Fe if present) is first leached rapidly from the gibbsite sheet in the nano-spherules (Data Sheets S29–S38), and then may be reprecipitated or adsorbed, as indicated by the decrease in solution concentrations of Al and Fe with time.
Secondary Phases and Altered Material
Allophane and hisingerite are considered generally to occur as intermediates in the formation of more stable phases, such as kaolinite and nontronite (Wada Reference Wada1989). Generally, during the weathering process, silica and aluminum or iron can combine to form allophane and/or hisingerite, which are then converted to imogolite or halloysite, and then to more mature layer silicates (Wada Reference Wada1989). Despite the studies examining these large-scale transitions, however, little work has been done to examine the incipient weathering of poorly crystalline phases such as allophane and hisingerite (e.g. Farmer et al. Reference Farmer, Krishnamurti and Huang1991; Farmer Reference Farmer1997). The current study showed that under alkaline conditions, layered, phyllosilicate-like precursor materials formed rapidly (on the order of a few months) from Fe-free and Fe-rich allophane under laboratory conditions, in agreement with previous work by Farmer et al. (Reference Farmer, Krishnamurti and Huang1991) and Farmer (Reference Farmer1997), which examined weathering of hisingerite under high temperatures and in calcareous conditions at both high and low temperatures.
FE-STEM analyses of pH0_10_FRA reacted for 2 months (pHsteady ~ 8) showed linear ‘edge-curl’ features that were not present in the unreacted materials (Figs 4a, 4c, 9a, S18). At low pH, fewer of these linear features were observed (Fig. S19). This observation supports the XRD data that indicated incipient phyllosilicate formation from Fe-rich allophane is less favorable at low pH than at alkaline pH.
As described above, Fe-free allophane and Fe-poor allophane show fewer phyllosilicate-like ‘edge-curl’ features than Fe-rich allophane when reacted under alkaline pH conditions for 2 months (Figs S20–S21). The Fe-rich allophane may behave differently from the Fe-poor and Fe-free allophanes because of reprecipitation or reduced dissolution of the Fe-containing material, as evidenced by the decrease in Fe concentration in solution with time (see Figs 1, 6, S9). Reprecipitated Fe-containing material, in combination with the silica-rich solution generated during alteration at alkaline pH, may create a favorable environment for incipient phyllosilicate characteristics to develop, similar to the formation of framework layers containing silica and divalent/trivalent cations during the synthesis of nontronite and saponite by the sol–gel method (e.g. Harder Reference Harder1976, Reference Harder1978; Baldermann et al. Reference Baldermann, Dohrmann, Kaufhold, Nickel, Letofsky-Papst and Dietzel2014; Gainey et al. Reference Gainey, Hausrath, Adcock, Tschauner, Hurowitz, Ehlmann, Xiao and Bartlett2017) and the formation of some seafloor nontronites (Sun et al. Reference Sun, Zhou, Glasby, Yang, Yin, Li and Chen2011). Because the Fe-free and Fe-poor allophane lack significant Fe, they may be less likely to develop phyllosilicate precursor phases when exposed to alkaline Si-containing solutions.
The bulk chemistry of unreacted and reacted samples (Table 6) shows that some reacted samples underwent a net loss of Si versus the unreacted sample, while others did not. A net loss of Si was observed in Fe-rich allophane samples across the range of pH conditions studied here, although no clear correlation was found between net Si loss and the pH of the experiment. A net loss of Si was also observed in the pH0_7_FPA experiment. No appreciable differences in Si content were observed between any of the Fe-free allophane samples. This observation indicates that the Si that dissolved from all of the Fe-free allophane experiments and all but one of the Fe-poor allophane experiments either: (1) reprecipitated before the end of the experiment (but was not detectable via XRD or microscopy); or (2) did not dissolve in sufficient quantity to produce a detectable change in Si content of the final reacted material. Similarly, for the Fe-rich allophane experiments (and pH0_7_FPA), Si may have dissolved in sufficient quantities to detectably affect the composition of the remaining solids, and not reprecipitated in sufficient quantities to erase the signature of its dissolution. The amount of Si released into solution during dissolution experiments and the amount of Si remaining in each sample was plotted to illustrate this relationship (Fig. S22).
Implications of Experiments for Mars
The dissolution experiments with Fe-free and Fe-bearing allophane demonstrated rapid initial dissolution and enrichment of Al and Fe across the range of pH conditions. Si in the interiors of Fe-free allophane, Fe-poor allophane, and Fe-rich allophane nano-spherules is accessed through pores in the nano-spherule walls, dissolves rapidly with little dependence on pH, and tends to remain in solution. Aluminum and Fe from the nano-spherule walls may re-precipitate rapidly, readsorb, or not enter solution at all. FE-STEM analyses of reacted materials showed diagnostic linear features (e.g. Fig. 9a) that were not seen in unreacted material, which were more prevalent at alkaline pH than at acidic pH. In the event that samples containing hisingerite or allophane are returned from Mars, similar features that indicate brief interaction with past liquid water (on the order of months to years) may be detectable. The rapid alteration of poorly crystalline silicate materials could be a useful tool for examining very short-lived episodes of water–rock interaction; on timescales where more crystalline silicate materials would show little to no chemical, mineralogical, or structural change due to interaction with water, poorly crystalline silicate materials may be altered significantly. Evidence for limited water–rock interactions captured by poorly crystalline silicate materials in returned martian samples may not capture in situ processes, however. Martian samples will be sealed in collection tubes and left on the surface for years before return to Earth. Hydrated materials may dehydrate diurnally or seasonally (e.g. Vaniman et al. Reference Vaniman, Martínez, Rampe, Bristow, Blake, Yen, Ming, Rapin, Meslin, Morookian, Downs, Chipera, Morris, Morrison, Treiman, Achilles, Robertson, Grotzinger, Hazen, Wiens and Sumner2018), potentially allowing water vapor to condense on particles in the sample tubes. The rapid dissolution rates of Fe-free allophane, Fe-poor allophane, and Fe-rich allophane suggest that these materials may be altered if sufficient water is present during such a scenario and, therefore, samples should be returned rapidly to limit alteration within sample tubes.
The continued presence of allophanic materials in returned samples from Mars could indicate that interactions of liquid water with the amorphous component were limited, consistent with other observations of mineral assemblages in Gale crater (e.g. the co-occurrence of jarosite and fluorapatite, as discussed by Rampe et al. Reference Rampe, Ming, Blake, Bristow, Chipera, Grotzinger, Morris, Morrison, Vaniman, Yen, Achilles, Craig, Des Marais, Downs, Farmer, Fendrich, Gellert, Hazen, Kah and Thompson2017). Although the dissolution rates of all three synthetic materials were fastest at pH0 3, and slower at more alkaline pH conditions, the range between the fastest and slowest dissolution rates spans less than an order of magnitude. Therefore, allophane or hisingerite on Mars would have dissolved or altered to more crystalline phases rapidly if abundant liquid water was present, regardless of the water’s pH, although field dissolution rates are expected to be ~ 2 orders of magnitude slower than the dissolution rates measured in laboratory experiments (e.g. Velbel Reference Velbel1993; Zhu et al. Reference Zhu, Liu, Zhang, Wang, Scheafer, Lu, Zhang, Georg, Yuan and Rimstidt2016). The temperatures on Mars, when liquid water was present, were also probably much lower than 25°C, which would further slow dissolution and extend the lifetimes of allophane or hisingerite. Waters with low salt concentrations, such as those that might be found in the “dilute lake waters” that may have filled Gale crater (Rampe et al. Reference Rampe, Ming, Blake, Bristow, Chipera, Grotzinger, Morris, Morrison, Vaniman, Yen, Achilles, Craig, Des Marais, Downs, Farmer, Fendrich, Gellert, Hazen, Kah and Thompson2017), can enhance significantly dissolution of Si-rich phases such as quartz and amorphous silica, however (e.g. Dove and Nix Reference Dove and Nix1997; Icenhower and Dove Reference Icenhower and Dove2000). Higher concentrations of salts tend to slow dissolution rates across a range of minerals, with dissolution rates slowing in proportion to decreasing water activity (Pritchett et al. Reference Pritchett, Madden and Madden2012; Olsen et al. Reference Olsen, Hausrath and Rimstidt2015; Steiner et al. Reference Steiner, Hausrath, Elwood-Madden, Tschauner, Ehlmann, Olsen, Gainey and Smith2016), and high ionic strength brines, such as those proposed by Tosca et al. (Reference Tosca, Knoll and McLennan2008) as the global norm throughout most of martian history, could result in significantly reduced dissolution rates and even further extend the lifetimes of rapidly dissolving phases.
Amorphous materials have been found in all samples examined to date in Gale crater, with the relative proportion of amorphous material increasing from ~ 20 wt.% at the base of Mt. Sharp to > 50 wt.% in formations farther up-section (e.g. Frydenvang et al. Reference Frydenvang, Gasada, Hurowitz, Grotzinger, Wiens, Newsom, Edgett, Watkins, Bridges, Maurice, Risk, Johnson, Rapin, Stein, Clegg, Schwenzer, Bedford, Edwards, Mangold and Vasavada2017; Rampe et al. Reference Rampe, Ming, Blake, Bristow, Chipera, Grotzinger, Morris, Morrison, Vaniman, Yen, Achilles, Craig, Des Marais, Downs, Farmer, Fendrich, Gellert, Hazen, Kah and Thompson2017; Yen et al. Reference Yen, Ming, Vaniman, Gellert, Blake, Morris, Morrison, Bristow, Chipera, Edgett, Treiman, Clark, Downs, Farmer, Grotzinger, Rampe, Schmidt, Sutter and Thompson2017). The amorphous material in the Pahrump Hills member becomes increasingly silicic as the amount present in samples increases, although this may be due to a more silicic source rock (Morris et al. Reference Morris, Vaniman, Blake, Gellert, Chipera, Rampe, Ming, Morrison, Downs, Treiman, Yen, Grotzinger, Achilles, Bristow, Crisp, Des Marais, Farmer, Fendrich, Frydenvang and Schwenzer2016; Rampe et al. Reference Rampe, Ming, Blake, Bristow, Chipera, Grotzinger, Morris, Morrison, Vaniman, Yen, Achilles, Craig, Des Marais, Downs, Farmer, Fendrich, Gellert, Hazen, Kah and Thompson2017). Likewise, the amount of smectite decreases along the traverse up-section into Pahrump Hills until smectite abundance falls below CheMin’s detection limit, while phases produced by acidic alteration (e.g. jarosite) are sandwiched between the silica-rich and smectite-rich members (Morrison et al. Reference Morrison, Downs, Blake, Vaniman, Ming, Hazen, Treiman, Achilles, Yen, Morris, Rampe, Bristow, Chipera, Sarrazin, Gellert, Fendrich, Morookian, Farmer, Des Marais and Craig2018). Little olivine is observed in the rock samples from Gale crater, but olivine is present in greater proportions in the aeolian samples, which are considered to be representative of the bulk Mars crust (e.g. Bish et al. Reference Bish, Blake, Vaniman, Chipera, Morris, Ming, Treiman, Sarrazin, Morrison, Downs, Achilles, Yen, Bristow, Crisp, Morookian, Farmer, Rampe, Stolper and Spanovich2013; Blake et al. Reference Blake, Morris, Kocurek, Morrison, Downs, Bish, Ming, Edgett, Rubin, Goetz, Madsen, Sullivan, Gellert, Campbell, Treiman, McLennan, Yen, Grotzinger, Vaniman, Chipera, Achilles, Rampe, Sumner, Meslin, Maurice, Forni, Gasnault, Fisk, Schmidt, Mahaffy, Leshin, Glavin, Steele, Freissinet, Navarro-Gonzalez, Yingst, Kah, Bridges, Lewis, Bristow, Farmer, Crisp, Stolper, Marais and Sarrazin2013; Meslin et al. Reference Meslin, Gasnault, Forni, Schroder, Cousin, Berger, Clegg, Lasue, Maurice, Sautter, Le Mouelic, Wiens, Fabre, Goetz, Bish, Mangold, Ehlmann, Lanza, Harri, Anderson, Rampe, McConnochie, Pinet, Blaney, Leveille, Archer, Barraclough, Bender, Blake, Blank, Bridges, Clark, DeFlores, Delapp, Dromart, Dyar, Fisk, Gondet, Grotzinger, Herkenhoff, Johnson, Lacour, Langevin, Leshin, Lewin, Madsen, Melikechi, Mezzacappa, Mischna, Moores, Newsom, Ollila, Perez, Renno, Sirven, Tokar, de la Torre, d'Uston, Vaniman and Yingst2013; Morrison et al. Reference Morrison, Downs, Blake, Vaniman, Ming, Hazen, Treiman, Achilles, Yen, Morris, Rampe, Bristow, Chipera, Sarrazin, Gellert, Fendrich, Morookian, Farmer, Des Marais and Craig2018). Taken together, these lines of evidence indicate that the rocks in Gale crater have undergone significant in situ chemical alteration (e.g. Yen et al. Reference Yen, Ming, Vaniman, Gellert, Blake, Morris, Morrison, Bristow, Chipera, Edgett, Treiman, Clark, Downs, Farmer, Grotzinger, Rampe, Schmidt, Sutter and Thompson2017; Hausrath et al. Reference Hausrath, Ming, Peretyazhko and Rampe2018; Morrison et al. Reference Morrison, Downs, Blake, Vaniman, Ming, Hazen, Treiman, Achilles, Yen, Morris, Rampe, Bristow, Chipera, Sarrazin, Gellert, Fendrich, Morookian, Farmer, Des Marais and Craig2018), although the presence of a non-equilibrium mineral assemblage, including jarosite, fluorapatite, and perhaps allophane or hisingerite, indicates that aqueous alteration was either time-limited or occurred in multiple stages, with the later stages being both briefer and more acidic than those that preceded them (e.g. Rampe et al. Reference Rampe, Ming, Blake, Bristow, Chipera, Grotzinger, Morris, Morrison, Vaniman, Yen, Achilles, Craig, Des Marais, Downs, Farmer, Fendrich, Gellert, Hazen, Kah and Thompson2017; Yen et al. Reference Yen, Ming, Vaniman, Gellert, Blake, Morris, Morrison, Bristow, Chipera, Edgett, Treiman, Clark, Downs, Farmer, Grotzinger, Rampe, Schmidt, Sutter and Thompson2017; Hausrath et al. Reference Hausrath, Ming, Peretyazhko and Rampe2018).
Based on the proposed chemical composition of the amorphous material and the presence of Fe-rich clay minerals in the stratigraphically lowest mudstones of Gale crater (Cumberland and John Klein), the amorphous material observed in these samples may contain a significant hisingerite component (Dehouck et al. Reference Dehouck, McLennan, Sklute and Darby Dyar2017). This hisingerite could represent an intermediate between primary olivine/pyroxene and the smectite clay minerals. These mudstones are the most likely of the samples from Gale crater that have been examined so far to contain hisingerite due to their Fe- and Si-rich compositions, high proportions of clay minerals, and limited interaction with acidic waters (Dehouck et al. Reference Dehouck, McLennan, Meslin and Cousin2014). At the top of the Pahrump Hills member, where the amorphous component is predominantly amorphous silica, no smectites are detected, indicating that either: (1) both the smectites and their precursor phases (i.e. hisingerite) have been dissolved; or (2) no smectites or precursor phases ever formed there. The presence of acid-alteration products and multiple cation deficiencies in these locations point to extensive leaching by acidic groundwater. Acidic groundwaters would be expected to dissolve rapidly any hisingerite that was present in these rocks, producing abundant amorphous silica as a leachate, and the subsequent dissolution of this silica may have been less rapid. A more silicic sediment source may be responsible for the observed silica enrichment in Pahrump Hills (Morris et al. Reference Morris, Vaniman, Blake, Gellert, Chipera, Rampe, Ming, Morrison, Downs, Treiman, Yen, Grotzinger, Achilles, Bristow, Crisp, Des Marais, Farmer, Fendrich, Frydenvang and Schwenzer2016; Rampe et al. Reference Rampe, Ming, Blake, Bristow, Chipera, Grotzinger, Morris, Morrison, Vaniman, Yen, Achilles, Craig, Des Marais, Downs, Farmer, Fendrich, Gellert, Hazen, Kah and Thompson2017), however, with acid alteration playing a more minor role, possibly during late-stage diagenesis.
Conclusions
Dissolution experiments with synthetic Fe-free allophane, Fe-poor allophane, and Fe-rich allophane in the range of initial pH0 3–10 indicate rapid initial dissolution, approximately an order of magnitude faster than that of well crystalline clay minerals of similar composition. The dissolution rates based on Si release of all three materials showed little pH dependence across the experimental pH range. For Fe-free allophane, logr diss = –10.65–0.15 × pH; for Fe-poor allophane, logr diss = –10.35–0.22 × pH; and for Fe-rich allophane, logr diss = –11.46–0.042 × pH at 25°C, where r diss has the units of mol m–2 s–1. Experimental results indicate that poorly crystalline allophane-like materials in Gale crater would have dissolved rapidly when exposed to liquid water regardless of the water’s pH. The detection of poorly crystalline materials in Gale crater suggests that interaction of liquid water with these materials was limited after the X-ray amorphous materials formed. In the case of more prolonged interactions, the materials would be expected to have either dissolved completely or altered to form more stable phases. Dissolution in Gale crater would probably have proceeded significantly more slowly than in the experiments of the present study, with particle lifetimes on the order of tens of thousands to hundreds of thousands of years, due to the lower temperature and greater salinity expected in the ancient waters of Mars, as well as generally slower dissolution rates in the field than in the laboratory.
Analyses with FE-STEM of reacted Fe-free and Fe-rich allophane revealed structural changes, including the formation of layered phyllosilicate-like structures within poorly crystalline agglomerates, after only a few months of reaction time. Such structural changes may be a useful tool for interpreting the weathering history of returned martian samples that have had limited interactions with liquid water.
Examination of Fe-free allophane, Fe-poor allophane, and Fe-rich allophane may be critical to understanding the characteristics of short-lived martian waters. These phases may provide insight into the duration of short-lived liquid water in Gale crater by allowing examination of aqueous alteration features at a finer timescale than that provided by well crystalline, aqueously altered minerals. With continued investigation and characterization, the properties of the Mars amorphous component could be used to constrain and elucidate the characteristics of the most recent waters on Mars.
Supplementary Information
The online version contains supplementary material available at https://doi.org/10.1007/s42860-021-00124-x.
Acknowledgments
The authors acknowledge the following people for their contributions to this research: Brad Sutter, Lisa Danielson, Joanna Hogancamp, Toluwalope Bamisile, Chris Adcock, Seth Gainey, Peter Sbraccia, Arlaine Sanchez, Ngoc Luu, Dave Hatchett, Minghua Ren, Michael Strange, and Richard Panduro-Allanson. They also thank Editor-in-Chief Professor Joseph W. Stucki, the associate editors of Clays and Clay Minerals, and journal reviewers for their insightful comments on this manuscript. This work was supported by the NASA Mars Data Analysis Program (grant #80NSSC17K0581), the University of Nevada, Las Vegas Faculty Opportunity Award, the University of Nevada, Las Vegas Doctoral Award, the Geological Society of America Graduate Research Grant, the University of Nevada, Las Vegas Graduate and Professional Student Association research and travel grants, and the Southwest Travel Award.
Funding
See Acknowledgments Section.
Declarations
Conflict of Interest
S. J. Ralston conducted this research while employed as a graduate student at the University of Nevada, Las Vegas and was employed by Jacobs (www.jacobs.com) prior to manuscript submission (multiple affiliation). Elisabeth Hausrath, Oliver Tschauner, Elizabeth Rampe, Tanya Peretyazhko, Roy Christoffersen, Christopher DeFelice, and Hyejeong Lee declare that they have no conflicts to report.