Whey is a by-product of modern cheese and yoghurt production, which cannot simply be disposed of due to presence of valuable ingredients and detrimental impact on the environment. Whey is a mixture of mainly water, lactose, minerals and proteins consisting nearly 50% of nutrients present in raw milk (Vasiljevic & Jelen, Reference Vasiljevic and Jelen1999). Whey is classified as sweet and acid depending on the manufacturing process. Sweet whey can be easily processed into whey protein concentrate (WPC) powders by simply spray drying concentrated liquid sweet whey after removing lactose by a crystallisation step. WPC powders are currently used as an ingredient in many food and pharmaceutical products (Chandrapala et al. Reference Chandrapala, Duke, Gray, Zisu, Weeks, Palmer and Vasiljevic2015a). However, this approach has not been efficient in production of acid whey powders. At present, owing to the increased demands for healthier products such as Greek yoghourts and fresh cheeses, the dairy industry is facing a problem with large volumes of acid whey. The main compositional differences between sweet and acid whey are in terms of lactic acid and calcium concentrations (de Wit, Reference de Wit2001; Panesar et al. Reference Panesar, Kennedy, Gandhi and Bunko2007) which in turn may hinder lactose crystallisation and prevent creating proper conditions for spray drying of acid whey.
The successful production of whey powders from the liquid whey streams is linked to the extent and efficiency of the lactose crystallisation step prior to spray drying (Gernigon et al. Reference Gernigon, Baillon, Espitalier, Le Floch-Fouere, Schuck and Jeantet2013). Crystallisation of lactose is affected by several factors such as presence of impurities, degree of supersaturation, solution temperature, viscosity, concentration of lactose, presence of proteins and pH (Herrington, Reference Herrington1934a, Reference Herringtonb; Bhargava & Jelen, Reference Bhargava and Jelen1996; Mimouni et al. Reference Mimouni, Schuck and Bouhallab2005; Ganzle et al. Reference Ganzle, Haase and Jelen2008). Among these factors, presence of impurities has been identified as one of the main hindrance of lactose crystallisation (Herrington, Reference Herrington1934b). Minerals as impurities in lactose solutions would govern lactose crystallisation in a direction that was dependent on the concentration and the type of the salt present (Jelen & Coulter, Reference Jelen and Coulter1973). For example, impurity levels greater than 10% with CaCl2 retarded the crystal growth rate of lactose as opposed to NaH2PO4 in deproteinated whey increasing the growth rate by 30%. A change in solubility of lactose was assumed to be the cause of different crystallisation patterns in presence of mineral impurities (Mullin, Reference Mullin, Jancic and de Jong1979).
The presence of lactic acid directly affects the behaviour of lactose, where high concentration of lactic acid (1% w/w) usually observed in acid whey hinder the removal of water from lactose by inducing a formation of a strong hydration layer around lactose molecules and thereby inhibiting the overall crystallisation (Wijayasinghe et al. Reference Wijayasinghe, Vasiljevic and Chandrapala2015), which was observed previously although the mechanism(s) were not proposed (Jelen & Coulter, Reference Jelen and Coulter1973; Ganzle et al. Reference Ganzle, Haase and Jelen2008). Moreover, a systematic study is missing in regards to combined effects of lactic acid and calcium on the lactose crystallisation kinetics. A greater understanding of lactose crystallisation kinetics in the presence of various compounds may assist in enabling efficient extraction of lactose from the acid whey waste stream and thus improve its valorisation.
Hence, the present study aimed at establishing the behaviour of lactose in presence of different concentrations of lactic acid and/or Ca using model lactose systems with an overall goal of postulating a mechanism for lactose crystallisation in acid whey. Different concentrations of lactic acid and Ca were selected based on the current knowledge of the dairy systems under investigation – lactic acid of 1% (w/w) and Ca of 0·12 and 0·072% (w/w) imitated the amounts usually determined in acid whey (Gosta, Reference Gosta1995), and acid whey retentates obtained by nanofiltration (Nguyen et al. Reference Nguyen, Reynolds and Vigneswaran2003; Chandrapala et al. Reference Chandrapala, Duke, Gray, Weeks, Palmer and Vasiljevic2015b), respectively. A model lactose system resembling the sweet whey waste stream (0·05% w/w lactic acid and 0·035% w/w Ca) was also included in the design for comparison (de Wit, Reference de Wit2001).
Materials and methods
Materials
A commercial food grade lactose powder was obtained from Murray Goulburn Co-operative Co. Ltd (Brunswick, Australia). Analytical grade lactic acid (98% w/w) and calcium chloride were obtained from Sigma-Aldrich Pvt. Ltd. (Castle Hill, NSW, Australia). Milli-Q water was used at all times for the preparation of solutions.
Preparation of model solutions
A 5% (w/w) lactose solution was prepared by dissolving 5 g of lactose powder in 95 g of Milli-Q water at room temperature. Similarly, a 24% (w/w) CaCl2 stock solution was prepared by dissolving 24 g of CaCl2 in 76 g of Milli-Q water. The model solutions with varying lactic acid and Ca concentrations were prepared by mixing appropriate amounts of stock CaCl2 and/or lactic acid with 5 g of lactose and making it up to 100 g of solution. The solutions were stirred using a magnetic stirrer for about 30 min until clear solutions were obtained. All solutions were filtered using 0·45 µm Whatman filter papers to remove any undissolved particles (Wijayasinghe et al. Reference Wijayasinghe, Vasiljevic and Chandrapala2015).
Concentration
All model solutions containing lactose, lactic acid, and Ca were concentrated using a rotary evaporator (EYELA, Tokyo. Rikakikai Co. Ltd. Japan). Temperature of the rotary evaporator water bath was adjusted to 55 °C to imitate the industrial conditions. The model solutions were concentrated to a final total solid content of 50% (w/w), which was confirmed by refractometry measurements (Brix value) using a laboratory refractometer (Atago abbe, Tokyo, Japan). No visual crystallisation was observed during the concentration process.
Freeze-drying
A portion of the concentrated samples was freeze-dried (Dynavac FD 300 freezedryer; Dynavac Engineering Pty, Australia) for 72 h and the residual water was removed by keeping a portion of the freeze-dried samples (~8 mg) in vacuum desiccators over P2O5 at room temperature for 5 d. The water activity was measured after 5 d and was resulted as 0·01 ± 0·005 %. All samples were frozen at – 20 °C for 24 h prior freeze drying.
Differential scanning calorimetry (DSC)
A part of the remaining portion of the concentrated model solutions was transferred into pre-weighed DSC aluminium pans (40 µl; ME-26763, Schwerzenbach, Switzerland) having sample weights of ~2-5 mg. The pans were hermitically sealed and immediately transferred into the DSC instrument (DSC 1 STARe System, Gas controller – GC 200, Mettler Toledo Schwerzenbach, Switzerland). All samples were scanned with a starting temperature of 50 °C and end temperature of 180 °C at a heating rate of 5 °C/min and the purging rate of nitrogen gas was set to 50 ml/min. An empty pan was used as a reference. Calibration of the DSC was conducted using indium (melting point, 156·6 °C and ∆H m, 28·45 J/g). Phase transition temperatures (onset, mid-point/peak and end-set) and enthalpies (area under the curves) were analysed using STARe thermal analysis software, 12·1 (Mettler Toledo).
Freeze-dried samples were also subjected to the same programme with slight modifications, in which samples were scanned to 125 °C at a heating rate of 10 °C/min, then cooled at 5 °C/min to 25 °C, followed by a second heating scan at 10 °C/min to 200 °C (Wijayasinghe et al. Reference Wijayasinghe, Vasiljevic and Chandrapala2015). The scans were normalised by the system according to the sample mass and the integrated peak energies were used to compare the degree of crystallinity.
Fourier transform infrared spectroscopy (FTIR)
The FTIR spectra of the model solutions were obtained in the range of 4000–600 cm−1 immediately after achieving the concentration of 50% (w/w) using PerkinElmer frontier FTIR spectrometer (PerkinElmer, MA, USA) with the combined software of IR Solution (Shimadzu Corp.), Version 1.40. Sample spectra were collected in the absorbance mode after background subtraction. Each spectrum was a result of an average of 16 scans recorded at 4 cm−1 resolution.
Statistical analysis
All experiments were arranged in a randomised split plot block design, in which a treatment (presence of impurities) was the main factor and the replication served as blocks. The whole design was replicated with a subsequent subsampling resulting in at least 4 independent observations (n ≥ 4). The least square difference (lsd) was used to differentiate the means with the pre-set probability at P < 0·05.
Results and discussion
Water – lactose interaction in the presence of lactic acid and calcium
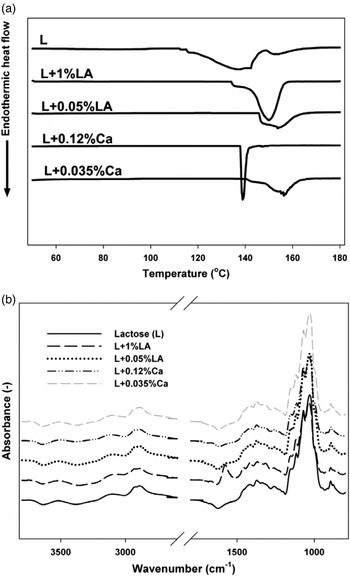
The present study hypothesises that the presence of lactic acid and Ca may influence the behaviour and molecular mobility of water molecules around lactose. Therefore, the effect of lactic acid and/or Ca presence on the behaviour of water molecules around lactose was examined using DSC (Figs. 1a & 2a). The DSC analysis revealed an endothermic peak around 140–150 °C, which could be attributed to removal of water molecules from the lactose solutions (Yazdanpanah & Langrish, Reference Yazdanpanah and Langrish2011). The recorded average onset, end-set and peak temperatures were unaffected (P > 0·05) by the presence of different concentrations of lactic acid and/or Ca. In contrast, the water evaporation enthalpies increased in the presence of lactic acid and/or Ca irrespective of their concentration in comparison to pure lactose (Table 1).
(a) Dynamic DSC curves and (b) FTIR spectra for lactose model solutions with the presence of lactic acid (LA) (1% or 0·05% w/w) or Ca (0·12% or 0·035% w/w), pure lactose (L) served as a control.

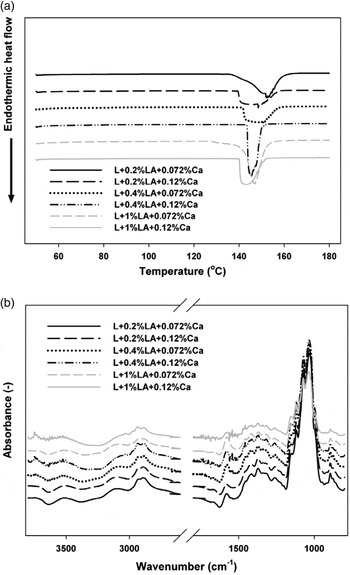
(a) Dynamic DSC curves and (b) FTIR spectra of model lactose solutions with the presence of lactic acid (LA) (0·05, 0·2 or 1% w/w) and Ca (0·035. 0·072 or 0·12% w/w)

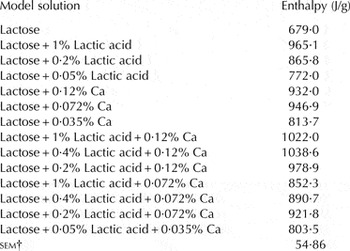
Enthalpy of water evaporation of lactose solutions as a function of varying concentrations of lactic acid and Ca

Values are means of at least 4 independent observations (n ≥ 4)
† sem denotes pooled standard error of the mean
The energy required to evaporate water from the pure lactose solution was ~679 J/g, while it increased by about 30%, resulting as ~965 J/g in the presence of 1% (w/w) lactic acid. Lactic acid is a highly hydrophilic compound and appears to strongly interact with water molecules, which leads to formation of a strong hydration layer consisting lactic acid and H3O+ ions around lactose molecules via exceptionally strong H bonds (Wijayasinghe et al. Reference Wijayasinghe, Vasiljevic and Chandrapala2015). This was further confirmed by FTIR. Figure 1b shows the FTIR spectra of lactose as influenced by varying lactic acid concentration. Two protruding peaks initiating around 1022 and 1065 cm−1 were observed, which are associated with OH groups of lactose, C-C stretching vibrations and C-O stretching of glucose molecule of lactose (Sedlarik et al. Reference Sedlarik, Sáha, Kuritka, Emri and Sáha2006; Solis-Oba et al. Reference Solis-Oba, Teniza-Garcia, Rojas-Lopez, Delgado-Macuil, Diaz-Reyes and Ruiz2011). Presence of 1% (w/w) lactic acid drastically reduced the intensity of these peaks (Fig. 1b). This reduction is the result of the restricted movement of the lactose molecules due to formation of a strong hydration layer around them.
Reducing the concentration of lactic acid from 1% (w/w) to 0·05% (w/w) has led to a gradual decrease in water evaporation enthalpy (Table 1). For instance, presence of 0·05% (w/w) lactic acid resulted in an evaporation enthalpy of ~772 J/g, which was only by about 13·5% greater than that of the pure lactose (Table 1). The diminished strength of the hydration layer, consisting H3O+ and lactic acid, minimised formation of lactic acid-water complexes and enhanced attraction between individual lactose molecules and thus consequently improved water mobility, which all may have sequentially resulted in reduced enthalpy required for removal of water. Similarly, reduction of lactic acid concentration to 0·05% (w/w) resulted in similar FTIR peak intensities (1022 & 1065 cm−1) as for pure lactose indicative of a weaker hydration layer which allows for free movement of the lactose molecules.
Apart from lactic acid, Ca has also been considered a key compound influencing the phase behaviour of lactose (Mimouni et al. Reference Mimouni, Bouhallab, Famelart, Naegele and Schuck2007). The formation of filamentous structures corresponding to calcium lactate crystals was found to be responsible for thickening behaviour of acid whey and was depended on the concentrations of calcium (Mimouni et al. Reference Mimouni, Bouhallab, Famelart, Naegele and Schuck2007). Presence of 0·12% and 0·072% (w/w) Ca increased the enthalpy of water evaporation significantly (P < 0·05) in comparison to pure lactose (Table 1). This effect may likely be caused by the ability of ionic Ca2+ to organise the structure of water (Bhargava & Jelen, Reference Bhargava and Jelen1996). Ca2+ is a divalent ion with a strong electric field which acts as a water structure promoter (Von Hippel & Schleich, Reference Von Hippel and Schleich1969). These structural changes of water molecules can directly affect the solubility of lactose and thereby, the supersaturation of the lactose solution which is one of the leading factors governing the lactose crystallisation (Mullin, Reference Mullin, Jancic and de Jong1979). Furthermore, Ca2+ ions strongly interact with four to six layers of water molecules through dipole-ion interactions (Reid & Fennema, Reference Reid, Fennema, Damodaran, Parkin and Fennema2008). Hence, the water molecules may be densely packed within these hydration layers in comparison to water molecules in the pure lactose solution leading to restricted mobilities (Reid & Fennema, Reference Reid, Fennema, Damodaran, Parkin and Fennema2008). Concurrently, calcium-lactose complexes (Herrington, Reference Herrington1934b; Charley & Saltman, Reference Charley and Saltman1963) are formed via hydroxyl groups of lactose molecules binding with the water molecules present in the hydration layer of Ca (Cook & Bugg, Reference Cook and Bugg1973). Individual lactose molecules may be surrounded by a strong hydration layer creating a shielding effect and hindering water removal of water. This also prevents the orderly arrangement of lactose molecules and crystal nucleation which was further confirmed by declining enthalpy of evaporation with the reduction of Ca concentration (813·7 J/g). Similarly, the intensity of the two prominent FTIR peaks, originating around 1022 and 1065 cm−1, were observed for lactose solutions containing Ca (Fig. 1b) appeared inversely dependent on the Ca concentration.
Lactose in sweet whey can be crystallised without much difficulty, while lactose present in concentrated acid whey remains in its amorphous form. The main compositional difference between sweet and acid whey is in the levels of lactic acid and Ca. Therefore combined effects of these two components on the water evaporation behaviour of lactose were further examined. The results are presented in Fig. 2a, b. Several general observations can be made. Presence of both components in the lactose solution increased the water evaporation enthalpy in comparison to that of the pure lactose (Table 1). Ca concentration appeared to be a key element governing the behaviour of lactose. For example presence of 1% (w/w) lactic acid and 0·12% (w/w) Ca resulted in ~1022 J/g of enthalpy required for water removal. This enthalpy declined down to ~978 J/g (Table 1) as lactic acid concentration was lowered to 0·2% (w/w) at the same level of Ca. In contrast, maintaining lactic acid concentration at 1% (w/w) and lowering Ca concentration to 0·072% (w/w) Ca resulted in a ~17% reduction of enthalpy, down to ~852·3 J/g. Interestingly, reducing the lactic acid concentration down to 0·2% (w/w) at the same low Ca concentration (0·072% w/w) resulted an evaporation enthalpy of ~922 J/g. From these observations, it appears that role of Ca in lactose-water interactions is more prominent at high concentrations of lactic acid and it may be possible to influence lactose behaviour by adjusting Ca concentration at an appropriate lactic acid level. In order to enable proper lactose crystallisation it appears necessary to lower enthalpy of water evaporation to at least levels observed in sweet whey. For this reason, a solution containing 5% (w/w) lactose, 0·05% (w/w) lactic acid and 0·035% (w/w) Ca was prepared and assessed for its phase behaviour. The determined evaporation enthalpy was ~803 J/g which, was only about 18% higher than the pure lactose and most importantly only ~6% higher than the presence of 1% (w/w) lactic acid and 0·072% (w/w) Ca signifying the fact that removing Ca from acid whey may be more effective in improving the lactose crystallisation even with the presence of 1% w/w lactic acid, although removing lactic acid concurrently along with Ca can achieve synergistic beneficial effects towards lactose crystallisation.
Complementarily, the intensity of the FTIR peaks around 1022 and 1065 cm−1 substantially dependent on the concentrations of the components in the system. The lowest intensity was observed at the highest concentrations, 1% (w/w) lactic acid and 0·12% (w/w) Ca, indicating the strong hydration layer around lactose molecules which restricts their mobility as discussed prior. The intensity of these peaks again followed an inverse dependency – increasing with concomitant decline in the component concentrations. Therefore reducing the concentration of both components appears to be beneficial for greater mobility of lactose molecules that could potentially initiate nucleation and crystallisation.
Furthermore, the FTIR peak originating around 3100 cm−1 is assigned to the hydrogen-bonded O-H groups (Lu et al. Reference Lu, Deng, Miao and Li2003). A clear reduction in the peak intensity was observed by the presence of 1% (w/w) lactic acid regardless of the Ca concentration (Fig. 2b). This effect was thus mainly due to restrictions in molecular mobility of water molecules due to the presence of strong H bonds of the hydration layer in the presence of lactic acid. The corresponding peak disappeared completely when 1% (w/w) lactic acid was accompanying with 0·12% (w/w) Ca indicating even greater mobility restriction of water molecules. Already strong hydration layer around lactose molecules created by the presence of lactic acid is probably further strengthened due to the strong ion-dipole interactions between Ca and water molecules. Reduction of concentrations of both components gradually increased the peak intensity of the corresponding peak (Fig. 2b). This was further confirmed by FTIR spectra showing the reduced peak intensities of O-H stretching vibrations as highlighted by the reduction of the O-H stretching peak at around 3507 cm−1 (Kirk et al. Reference Kirk, Dann and Blatchford2007). Interestingly, a peak around 3747 cm−1 was observed in the presence of 1% (w/w) lactic acid and 0·12% (w/w) Ca. This peak was absent from all other samples and could likely be attributed to distortion of water molecules in the presence of high amounts of Ca and lactic acid (Sharp et al. Reference Sharp, Madam, Manas and Vanderkooi2001).
Phase behaviour of freeze-dried samples
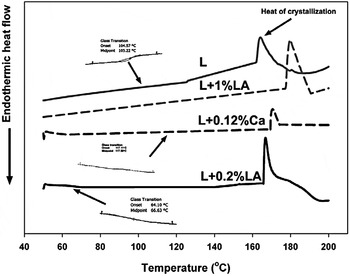
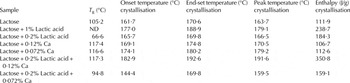
Phase changes such as glass transition (T g) and crystallisation are related to molecular mobilities within a food system (Roos & Karel, Reference Roos and Karel1990). Thus, freeze dried model solutions were analysed to establish the effects of Ca and lactic acid on the glass transition and crystallisation behaviour of lactose. Figure 3 shows a representative graph depicting crystallisation behaviour and T g of lactose in presence of lactic acid or Ca. Freeze dried pure lactose sample had a T g value of ~105 °C, similar to what has been reported previously (105·5 °C; Omar & Roos, Reference Omar and Roos2007). However, in the presence of 1% (w/w) lactic acid, a T g could not be established within the scanned temperature region, most probably due to the low T g value (−60 °C) of lactic acid (Maltini et al. Reference Maltini, Anese and Shtylla1967). However, reducing the initial lactic acid concentration to 0·2% (w/w) increased the T g value to ~66·6 °C which was consistent with Shrestha et al. (Reference Shrestha, Adhikari, Howes and Bhandari2006). Lactic acid is a highly hygroscopic compound and enhances water-lactic acid interactions in a lactose system when present in high concentrations, which thereby increases the plasticisation effect of water reducing the T g of lactose. On the other hand, presence of 0·12% (w/w) Ca increased the T g of lactose by ~12 °C, up to ~117 °C (Fig. 2), which was fairly close to a previously reported value of ~121 °C (Omar & Roos, Reference Omar and Roos2007). Reducing Ca concentration down to 0·072% (w/w) had a slight (P > 0·05) effect on T g (~116 °C). Simultaneously reducing the concentrations of both lactic acid (0·2% w/w) and Ca (0·072% w/w) resulted a T g value of ~95 °C highlighting the fact that Ca is more responsible for controlling the T g of lactose when present in combination. Resulting an in-significant T g value of 117 °C for 0·2% (w/w) lactic acid and 0·12% (w/w) Ca lactose solution as compared to 0·12% (w/w) Ca alone (117 °C) confirmed the more dominant effect of Ca towards the T g of lactose when present in combination.
Dynamic DSC curves of freeze-dried powders containing pure lactose – L, pure lactose (L) concentrated and dried in the presence of 1% (w/w) lactic acid (LA); pure lactose (L) concentrated and dried in the presence of 0·2% (w/w) lactic acid (LA); and pure lactose (L) concentrated and dried in the presence of 0·12% (w/w) Ca in the temperature region from 50 to 200 °C.

Table 2 summarises the thermal properties (crystallisation enthalpy and onset, end-set, peak temperatures) of freeze dried lactose samples with varying concentrations of Ca and/or lactic acid. The crystallisation temperature (T cr) of pure lactose was ~164 °C, which increased in the presence of high concentrations of lactic acid or Ca (Table 2) indicating a delay in crystallisation. Interestingly, manipulating concentrations of individual components produced contradicting results in terms of phase behaviour of lactose. As an example, in the presence of 0·2% (w/w) lactic acid and 0·12% (w/w) Ca lactose had a T cr value of ~192 °C, while it declined with diminishing Ca concentration (0·072%) at the same level of lactic acid giving a T cr of 160 °C. Furthermore, the crystallisation of pure lactose occurred within a temperature window of ~9 °C. In the presence of 1% (w/w) lactic acid, this window has broadened to ~12 °C while it was narrowed down to ~4 °C when the lactic acid concentration was lowered to 0·2% (w/w). In the presence of 0·12% (w/w) Ca, the crystallisation of lactose has taken place within a ~5 °C temperature window. This window was broadened for example up to ~10 °C when 0·2% (w/w) lactic acid was present at the same Ca level. This further supports observations obtained in lactose solutions, indicating the fact that these compounds likely increase the distances between lactose molecules and may delay the required orderly arrangement of lactose molecules to form the crystalline structure.
Glass transition temperature (T g), onset, end-set and peak temperatures and enthalpy of lactose crystallisation as determined in freeze dried powders obtained by concentrating and drying lactose model solutions with varying concentrations of lactic acid and Ca

ND, Not detected
High energy may require crystallising the lactose in presence of high concentrations of Ca and/or lactic acid. Hence, the observed crystallisation peaks were integrated to obtain the total area under the peak, which is defined as the crystallisation enthalpy in Table 2. Pure lactose samples of freeze dried powders had an enthalpy of ~112 J/g while the powdered samples obtained from the solution containing 1% (w/w) lactic acid required more than double amount of energy (~239 J/g) to go through this phase transition. A high crystallisation enthalpy indicates a large amorphous content (Chiou et al. Reference Chiou, Langrish and Braham2008). Reducing lactic acid concentration to 0·2% (w/w) resulted in concomitant reduction of enthalpy to ~184 J/g. Interestingly Ca alone appeared to have a very minor effect on the crystallisation enthalpy since presence of 0·12% (w/w) Ca required ~107 J/g energy for lactose crystallisation. However, presence of 0·2% (w/w) lactic acid along with 0·12% (w/w) Ca required ~351 J/g energy for lactose crystallisation which is about 3 times higher than pure lactose. This result indicated that even the presence of low concentrations of lactic acid is influential towards the crystallisation enthalpy changes with the presence of high concentrations of Ca (0·12% w/w). In contrast, decreasing the Ca concentration to 0·072% (w/w) while keeping the same lactic acid concentration (0·2% w/w), reduced the enthalpy to ~159 J/g which again highlights the interactive effects between lactic acid and Ca. This reinforces our understanding that inability to process acid whey is due to presence of both lactic acid and Ca as it prevents crystallisation of lactose where these interactive effects are solely concentration dependent.
The strength of the hydration layer, consisting H3O+ and lactic acid, formation of lactic acid-water complexes and enhanced attraction between individual lactose molecules which consequently improved water mobilities may most likely be responsible for varying lactose crystallisations with the presence of lactic acid. On the other hand, presence of ionic calcium may organise the structure of water (Bhargava & Jelen, Reference Bhargava and Jelen1996), which consequently can affect the solubility of lactose and thereby, the supersaturation of the lactose solution. Furthermore, strong interactions of Ca2+ ions-water and calcium-lactose may lead to strong hydration layers, which in-turn gives rise to different lactose crystallisation behaviours. The presence of high amounts of both lactic acid and Ca hinders further processing of acid whey mainly due to enhance lactose hydration that limits proper molecular arrangement required for crystallisation. Hence, establishing a threshold limits for lactic acid and Ca presence in acid whey appears as a necessity to propose a proper strategy for acid whey processing. The present study revealed that the presence of high concentrations of both lactic acid and Ca increases the water evaporation enthalpy and subsequently hinders the removal of water from lactose solution. Already strong hydration layer around lactose molecules created by the presence of lactic acid can probably further strengthened due to the strong ion-dipole interactions between Ca and water molecules, and thus may exhibit an interactive effect towards lactose crystallisation. Furthermore, Mimouni et al. (Reference Mimouni, Bouhallab, Famelart, Naegele and Schuck2007) stated that calcium lactate filament like particle formation is responsible for the drastic increase in flow resistance of whey concentrates. Hence, in the present study, the formation of calcium lactate can increase the viscosity of the solutions, which in turn may affect the diffusion coefficients of lactose molecules. Similarly, the presence of low concentrations of lactic acid as well as Ca may lead to the formation of a very strong hydration layer due to the highly hygroscopic ability of calcium lactate molecules. However, the presence of excess of lactic acid may prevent calcium lactate being adsorbed strongly to the lactose molecules and at the same time change the supersaturating levels, leading to a higher diffusion of lactose molecules within the system. It came into view that by manipulating Ca concentration would be possible to predict phase behaviour of lactose. Therefore, the findings of the present study suggest that a partial removal of Ca from acid whey may be a feasible strategy in improving the crystallisation behaviour of lactose and thereby enabling better processing of acid whey.
The authors gratefully acknowledge the financial and technical support from Victoria University.