I. INTRODUCTION
Nanocrystalline materials constitute a focal point of interest for fundamental scientific as well as applied research.Reference Siegel1–Reference Koch, Ovid’ko, Seal and Veprek3 Such materials may find a variety of applications in view of their properties, which are often superior to the properties of coarse-grained materials. Examples of such properties are higher strength and hardness,Reference Meyers, Mishra and Benson4, Reference Meyers, Mishra and Benson5 extreme ductility without strain hardening,Reference Lu, Sui and Lu6 hard magnetic properties,Reference Croat, Herbst, Lee and Pinkerton7 etc. Moreover, nanocrystalline materials are crucial for specific applications involving thin films and/or two- or one-dimensional nanostructures as nanoelectromechanical systems.Reference Ekinci and Roukes8
Nanocrystalline materials exhibit a relatively high driving force for grain coarsening because of the high density of grain boundaries associated with a distinct excess energy.Reference Birringer9 As a consequence, the onset of grain coarsening can occur at low homologous temperatures. Taking nanocrystalline pure metals such as Cu, Ag (as electrodeposited thin films and as compacted powder), and Pd (as compacted powder) as examples, grain coarsening can occur at homologous temperatures as low as about 0.2 and thus may even proceed at ambient temperature (“self annealing”).Reference Hansen and Pantleon10–Reference Pantleon and Somers12
For utilization in practice of the favorable properties of nanocrystalline materials, it is imperative to suppress nanograin growth to preserve the microstructure of nanocrystalline materials upon aging or exposure to a time–temperature program. As the grain-boundary velocity during grain growth is proportional to the product of grain-boundary mobility and driving force,Reference Mittemeijer13 two routes to obstruct grain growth can be followed. (i) The thermodynamic approach (see, for example, Refs. Reference Weissmuller14–Reference Koch, Scattergood, Darling and Semones16 and references therein): the driving force, which is proportional to the grain-boundary energy, can be reduced. In particular, grain-boundary segregation has been proposed as a mechanism for lowering the excess energy associated with grain boundaries. (ii) The kinetic approachReference Koch, Scattergood, Darling and Semones16–Reference Liu and Kirchheim19: the grain-boundary mobility can be reduced by porosity, solute atoms, or precipitates at the grain boundaries, which microstructural elements impose drag forces on the grain boundaries. Moreover, a reduction of grain-boundary energy by alloying, relevant specifically for the present work, can be accompanied by an increase of the activation energy for grain-boundary mobility. [The activation energy for grain-boundary mobility can be close to the activation energy for grain-boundary diffusion (but see Ref. Reference Bos, Sommer and Mittemeijer20). Grain-boundary segregation will result in an increase in the activation energy for grain-boundary diffusion, as segregated atoms likely preferentially occupy free volume in the grain boundary mediating grain-boundary diffusion.] Under many practical circumstances, both mechanisms (i) and (ii) may thus be interlinked and operate at the same time (see Refs. Reference Liu and Kirchheim19 and Reference Detor and Schuh21 and references therein). Triple junctions can impose drag forces, which can become significant in particular for very small grain sizes.Reference Shvindlerman and Gottstein18
Specifically, alloying may not only improve the stability of nanocrystalline materials but also provide a pathway for tailoring the microstructure of nanocrystalline materials during the preparation.Reference Detor and Schuh22 One system previously studied, in view of possible applications in micro- and nanoelectromechanical systems and as protective coatings, are Ni–W films prepared by electroplating (see Ref. Reference Detor and Schuh21 and references therein; see also Refs. Reference Choi, Al-Kassab, Gartner, Kreye and Kirchheim23–Reference Schuh, Nieh and Iwasaki27). Previous work revealed that the addition of W can suppress nanograin growth in a wide range of temperatures. However, electroplating, being a wet-chemical process and requiring an electrically conductive substrate, may not be the ideal deposition process for all types of applications. Alternative viable deposition routes as chemical (CVD) and physical vapour deposition (PVD) are thus desirable. In particular, sputter deposition from separate elemental Ni and W targets enables a simple variation of the layer composition; the process parameters such as sputtering rate, residual gas pressure, and substrate temperature provide means for modifying and thereby tailoring the layer microstructure.
Systematic studies of the microstructure of nanocrystalline Ni–W alloys prepared by sputter deposition upon annealing are rare.Reference Rupert, Trenkle and Schuh26, Reference Borgia, Scharowsky, Furrer, Solenthaler and Spolenak28 A thorough investigation has to take into account the solute distribution, the phase composition, the grain-size evolution and, for films attached to a substrate, also the residual stresses before and as evolving during the heat treatment. In this work, Ni–W thin films (thickness of 500 nm, composition between 0 and 22 at.% W) prepared by cosputtering from pure metal targets have been investigated employing ex situ and in situ x-ray diffraction (XRD) measurements, in the temperature range between 25 and 550 °C, and ex situ focused ion beam (FIB) and transmission electron microscopy (TEM).
II. EXPERIMENTAL PROCEDURES
A. Layer deposition and chemical analysis
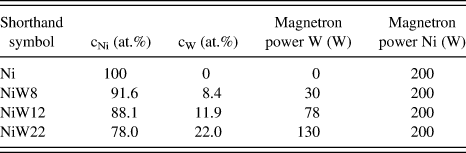
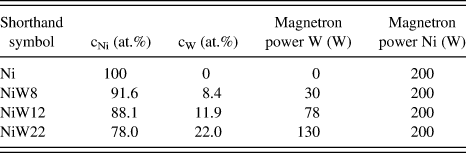
Ni–W thin films were prepared by direct-current magnetron cosputtering from pure metal targets (Ni: 99.995 at.%; W: 99.95 at.%) in an ultrahigh-vacuum deposition chamber evacuated to a base pressure of 5 × 10⁻⁹ mbar. Silicon wafers with amorphous SiO2 and Si3N4 diffusion-barrier layers (each 50-nm thick) were used as substrates. The substrates were sputter-cleaned for 1 min prior the layer deposition by Ar ion sputtering employing Ar+ ions accelerated with an applied voltage of about 100 V. The substrates were rotated during sputter cleaning and deposition around the substrate-surface normal with a few tens of revolutions per minute. An Ar pressure of 6 × 10⁻³ mbar was maintained during sputtering employing a gas-flow controller. The composition of the layers was varied by applying a constant power of 200 W to the Ni sputter target and adjusting the power applied to the W sputter target to various values: 0 W (for the deposition of a pure Ni layer), 30 W, 78 W, or 130 W. All layers prepared had a nominal thickness of 500 nm. For each composition, the deposition rate was determined by examining a thick test specimen produced with a step in height employing a stylus profilometer. The deposition rate varied between ≈0.3 nm/s for pure Ni layers and ≈0.5 nm/s for layers with a W concentration of 22 at.%. The specimen temperature was not controlled: It increased during substrate cleaning and subsequent layer deposition to about 70 °C. The chemical composition of the layers was determined by inductively coupled plasma optical emission spectroscopy (ICP-OES) after dissolving the layer in an acid mixture.
B. XRD measurements
XRD measurements were performed employing a Philips (now: Panalytical) XPert MRD Pro diffractometer (Panalytical; Almelo, The Netherlands) equipped with a Cu x-ray tube operating at 45 kV and 40 mA, an x-ray lens to produce a collimated incident beam, a parallel-plate collimator, a monochromator set to CuKα radiation in the diffracted beam, and a proportional counter. An Eulerian cradle enabled tilting the specimen by the angle ψ (i.e., the angle between the specimen-surface normal and the diffraction vector) in side-inclination mode and rotating the specimen around its surface normal by the angle φ.
For XRD pole-figure measurements, employing the 111 reflection, the Philips MRDPro diffractometer was used. The tilt angle ψ was varied between 0° and 86°, and the rotation angle φ was varied between 0° and 360°. As the texture of all specimens investigated exhibited fiber symmetry (see Sec. III.A.3), so-called pole-figure sections were constructed by summing up the intensities measured at a given value of the tilt angle ψ for all rotation angles φ.
A custom software was used to determine peak-maximum positions, full widths at half maximum, integral breadths, and integrated intensities by fitting Pearson VII functions to the measured diffraction lines.
In situ diffraction measurements were performed employing a Bruker AXS Discover TXS diffractometer (Bruker AXS; Karlsruhe, Germany) equipped with a Cu rotating anode micro-focus x-ray tube operating at 50 kV and 20 mA, a two-dimensional x-ray mirror to produce a collimated incident beam and a parallel-plate collimator in the diffracted beam.Reference Wohlschlogel, Schulli, Lantz and Welzel29 The energy window of an energy-dispersive detector (Bruker SolX) was set to detect CuKα radiation. A heating chamber (DHS 900; Anton Paar, Graz, Austria) was mounted on the Eulerian cradle for in situ measurements. The heating chamber was repeatedly evacuated and flushed with a N2-2 vol% H2 gas mixture and thereafter filled with the gas mixture at a slight overpressure to avoid oxidation. The temperature was calibrated prior to the measurements employing a reference specimen as described in Ref. Reference Wohlschlögel, Welzel, Maier and Mittemeijer30.
In situ XRD stress measurements were done on the basis of the crystallite group method, as all specimen investigated exhibited a pronounced {111} fiber texture (See Sec. III.A.3).Reference Welzel, Ligot, Lamparter, Vermeulen and Mittemeijer31 To this end, the 111 reflections were measured at two specimen-tilt angles, ψ = 0° and ψ = 70.53°, pertaining to the tilt angles for the {111} fiber-texture crystallite group. The stress (verified to be planar and rotationally symmetric) was determined from a plot of the lattice-plane spacing versus sin2ψ, and the strain-free lattice parameter was determined by interpolation at the strain-free direction sin2ψ *.Reference Welzel, Ligot, Lamparter, Vermeulen and Mittemeijer31 The single-crystal elastic constants for W were taken from Ref. Reference Gale and Totemeier32, and the single-crystal elastic constants of Ni were taken from Ref. Reference Bollenrath, Hauk and Müller33. For Ni–W layers, the atomic concentration averaged single-crystal elastic constants of Ni and W were used. The temperature was changed in steps of 25 K between ambient temperature and 550 °C, and a time for temperature equilibration of 5 min was scheduled before the stress measurement was started. The total time for one stress measurement was about 20 min; the holding time at 550 °C was 12 h. XRD stress (and line broadening; see below) measurements were performed both during heating and cooling.
For line-broadening analysis, the 111 reflections were measured at two tilt angles, ψ = 0° and ψ = 70.53°, pertaining to the tilt angles for the {111} fiber-texture crystallite group (i.e., the same datasets as used for diffraction-stress analysis were used). The line broadening was analyzed on the basis of the single-line method by attributing Lorentzian line broadening to crystallite size and Gaussian line broadening to microstrain.Reference de Keijser, Langford, Mittemeijer and Vogels34, Reference Mittemeijer and Welzel35 A correction for instrumental broadening was done on the basis of reference measurements employing a layer of LaB6 (Standard Reference Material SRM 660a; National Institute of Standard and Technology NIST, Gaithersburg, MD) using a Voigt-function approach to subtract instrumental broadening.Reference Mittemeijer and Welzel35
C. Microstructural investigations by FIB and TEM
The specimen morphology was investigated by FIBmicroscopy employing a FIB 200 workstation (FEI; Hillsboro, OR). Cross sections were cut and visualized using a focused Ga+ ion beam. A FIB workstation Nova Nanolab (FEI; Hillsboro, OR) was used for the preparation of TEM lamellae. To this end, a cross-sectional slice of the layer with a thickness of about 100 nm was cut with the help of the Ga+ ion beam and transferred to a TEM specimen holder employing a micromanipulator.
The as-deposited specimens and the annealed specimens were investigated in a Philips CM 200 transmission electron microscope (Philips, Amsterdam, Netherlands) operating with a 200 kV electron beam. For high-resolution TEM (HR-TEM) investigations a JEOL 4000FX microscope (JEOL, Tokyo, Japan), operating with a 400 kV electron beam, was used. In addition to FIB-prepared TEM lamellae, cross-sectional samples were also prepared in the following way: two pieces were cut from the layer/substrate specimen using a diamond wire saw and subsequently sandwiched (layers of both pieces facing each other) with epoxy glue. After mechanical thinning by grinding, the thin slice of material was embedded into a specially designed cylindrical polycrystalline Al2O3 tube of 3-mm diameter as a holder for the cross-sectional sample. Then the tube was cut into slices. The slices underwent mechanical grinding, dimpling from both sides, and finally ion thinning [Ar+ ions with 3.5 keV energy and 1 mA ion current in a BAL-TEC RES 010 apparatus (Bal-tec, Balzers, Liechtenstein) with liquid nitrogen cooling] for several hours to achieve electron transparency. Details of this cross-sectional specimen preparation can be found in Ref. Reference Strecker, Bäder, Kelsch, Salzberger, Sycha, Gao, Richter and van Bentem36.
III. THE AS-DEPOSITED MICROSTRUCTURE
A. Results
1. Chemical analysis
The chemical compositions of the layers as determined by ICP-OES (see. Sec. II.A) have been gathered in Table I. According to the equilibrium phase diagram, the specimens Ni, NiW8, and NiW12 (for shorthand symbols used throughout this work, see column 1 in Table I) should be single-phase substitutional solid solutions of W in Ni (abbreviated as Ni(W) in the following).Reference Nagender Naidu, Sriramamurthy and Rama Rao37 The specimen NiW22 falls in a two-phase region and thus would consist of the compound Ni4W and the compound NiW.
Chemical composition of the Ni–W layers as determined by inductively coupled plasma optical emission spectroscopy.
2. Focused ion beam microscopy
Investigation of the microstructure of the pure Ni layers by cross-sectional FIB microscopy revealed a polycrystalline microstructure consisting of globular grains with grain sizes considerably smaller than the film thickness. For all Ni–W layers, the absence of any contrast within FIB cross sections of the layers (i.e., the cross sections appear homogeneous, contrast-less grey in the FIB cross section) indicates that the typical microstructural (defect) features exhibit dimensions well below the FIB-resolution limit of about 20 nm, that is, according to the FIB analysis, the Ni–W layers are either nanocrystalline or amorphous.
3. XRD phase and texture analysis
XRD measurements with the diffraction vector oriented perpendicular to the specimen surface exhibit only two reflections, tentatively indexed as the 111 and 222 reflections of Ni (for the pure Ni specimen) or of the Ni(W) solid solution (for the Ni–W specimens). The absence of other reflections is a consequence of the occurrence of strong and sharp {111} fiber textures for both types of specimens, as confirmed by XRD pole-figure measurements employing the Ni and Ni(W) 111 reflections, respectively.
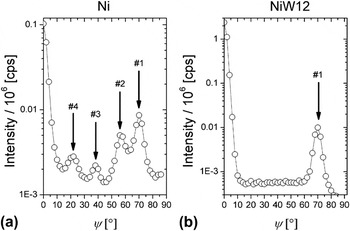
A pole-figure section for a pure Ni layer, recorded utilizing the 111 reflection, shows [see Fig. 1(a)], in addition to the intensities from the {111} fiber-texture component at ψ = 0° and ψ = 70.53° (peak marked as #1 in the figure), rather weak additional maxima at tilt angles ψ of about ψ = 22°, ψ = 40°, and ψ = 56° (peaks marked as #4, #3, and #2, respectively). Whereas the latter two (#2 and #3) result from twinning on inclined (with respect to the surface normal) (111) planes of the {111} fiber-texture component, the peak at ψ = 22° (#4) is due to multiple twinning.Reference Okolo, Lamparter, Welzel, Wagner and Mittemeijer38
Pole-figure sections for the pure Ni specimen and the NiW12 specimen, recorded utilizing the 111 reflections of Ni and the Ni(W) solid solution, respectively.

Pole figures for the Ni–W layers, recorded utilizing the Ni(W) 111 reflection, exhibit only intensities at ψ = 0° and ψ = 70.53° pertaining to the {111} fiber-texture component for all W concentrations investigated [see Fig. 1(b) for the pole-figure section of a NiW12 specimen]. The Ni–W layers thus consist of only one single fiber-texture component without twinning on the inclined (111) planes. Both the pure Ni and the Ni–W layers for all W contents exhibit a pole width of less than 4° (half width at half maximum).
4. XRD residual stress analysis; determination of strain-free lattice parameters
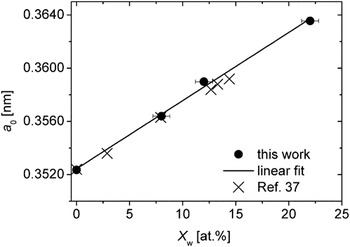
The values for the residual stress parallel to the surface of the Ni and Ni–W layers, determined as described in Sec. II.B, have been gathered in Table II. The strain-free lattice parameters a 0, obtained by interpolation at sin2ψ * (see Sec. II.B), have been plotted versus the composition (see Table I) in Fig. 2. The lattice parameter varies linearly with composition according to

The (strain-free) lattice parameter of the Ni–W solid solution as function of the W content as determined from the Ni and Ni–W layers in the course of the x-ray diffraction (XRD) residual stress analysis employing the crystallite group method (see Sec. II.B). Error bars for the strain-free lattice constant are not shown, as their size is of the order of the size of the symbols used. The data reproduced from Ref. Reference Kong, Liu, Lal and Liu39 are the results of molecular dynamics simulations.

Residual stresses of the Ni and Ni–W layers after deposition.

where a Ni is the lattice parameter of pure Ni, X w is the atomic concentration of W, and k is a constant. For the data shown in Fig. 2, k equals 5.1306 × 10⁻⁴ nm. This value of k is about equal to the value determined by fitting to lattice-parameter values calculated by molecular dynamic simulationsReference Kong, Liu, Lal and Liu39 (see Fig. 2). As the data point corresponding to the highest W concentration also falls on the straight line drawn through the experimental data in Fig. 2, it follows that W is dissolved substitutionally in Ni also for the NiW22 layer with a W concentration of 22 at.%, which exceeds very considerably the solubility limit as indicated by the equilibrium phase diagram (≈12 at.%).
5. XRD line-broadening analysis
Line-broadening analysis for the pure Ni layer, employing the Ni 111 reflections measured at ψ = 0° and ψ = 70.53° (these tilt angles pertain to the {111} fiber-texture component), indicate a globular grain morphology with a crystallite size of the order of about 35 nm. In contrast with this result, considerably different crystallite-size values were obtained for all Ni–W layers at ψ = 0° and at ψ = 70.53°: whereas the crystallite size exceeds 100 nm at ψ = 0°, the crystallite size at ψ = 70.53° is only about 25 nm. The much larger crystallite size perpendicular to the specimen surface (ψ = 0°) indicates a highly columnar microstructure consisting of needle-shaped grains.
6. Transmission electron microscopy
Cross-sectional TEM micrographs of the pure Ni layer (not shown) confirm the results obtained by XRD line-broadening analysis (see Sec. III.A.5) and FIB investigation (see Sec. III.A.2): a globular microstructure with an average crystallite size of less than 50 nm.
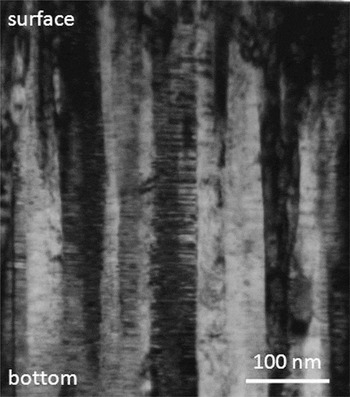
A representative cross-sectional TEM bright-field image of a NiW12 specimen is shown in Fig. 3. Also, for the Ni–W layers, the TEM analyses confirm the findings of the diffraction line-broadening analysis (see Sec. III.A.5): a highly columnar morphology consisting of needle-shaped grains oriented perpendicular to the surface (i.e., parallel to the growth direction). Whereas most of the crystallites extend throughout the entire layer thickness, the in-plane size of the crystallites is only a few tens of nanometers.
Bright-field cross-sectional transmission electron microscopy (TEM) image of a NiW12 layer showing columnar grains with a high density of planar faults perpendicular to the growth (specimen-normal) direction.

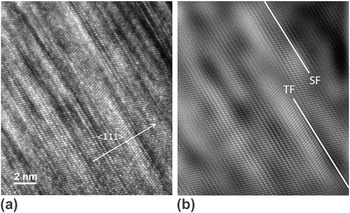
A striking feature of the TEM micrographs (diffraction-contrast images) of the Ni–W layers is the occurrence of pronounced bright/dark contrasts perpendicular to the column axis of the columnar grains. Recognizing the occurrence of the {111} fiber texture (see Sec. III.A.3), this is indicative of twinning with the twin planes oriented perpendicular to the column axis. HR-TEM investigations confirm this hypothesis: see the twin plane marked in the HR-TEM micrograph shown in Fig. 4. Moreover, (intrinsic) stacking faults can be discerned as well. As compared to a determination of the twinning density/probability, obtaining a (even semi-) quantitative value for the stacking-fault density (in the same way as for the twinning density) is not at all straightforward, as in the TEM diffraction-contrast images and in the (HR)TEM image stacking faults cannot be identified as easily as twin boundaries.
(a) Cross-sectional high-resolution TEM image of a NiW22 specimen taken in a [011] zone axis orientation. (b) Fourier-filtered image of the micrograph at the left with an indication of the location of a stacking fault (SF) and a twin fault (TF).

The above discussed findings were obtained for all W concentrations. Systematic variations of the crystallite size and the planar fault density with W concentration do not occur, apart from the planar fault density in the NiW8 solid solution being somewhat smaller.
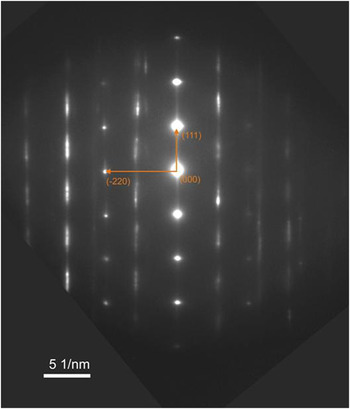
A selected-area diffraction (SAD) pattern recorded from a cross-sectional specimen of a NiW12 layer is shown in Fig. 5. Pronounced diffuse intensity distributions (“streaks”) occur in reciprocal space between diffraction spots pertaining to the Ni(W) solid solution. These “streaks” are parallel to <111 > directions, which are parallel to the specimen-surface normal in real space. This suggests that the streaking is related to the high densities of planar faults, with fault planes [(111) planes] parallel to the surface of the layers, as observed in the cross-sectional TEM images.
Selected-area diffraction (SAD) pattern recorded from a cross-sectional specimen of a NiW12 layer indexed for a [−1 −1 2] zone axis. The pattern should be considered a superposition of the SAD patterns of a number of crystallites all with the zone axes parallel to the incident electron beam, which are perpendicular to <111> directions perpendicular to the surface of the Ni(W) layer. Full interpretation of the pattern thus requires a superposition of diffraction patterns (originating from the different columnar crystallites) pertaining to the zone axes [1 −1 0], [−1 −1 2], and [−3 2 1] and their equivalents (as [−1 0 1], etc.).

7. XRD measurements with variable orientation of the diffraction vector
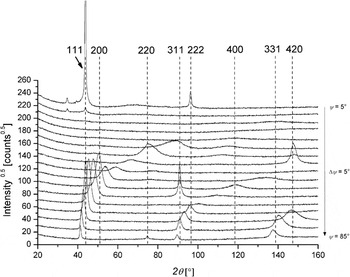
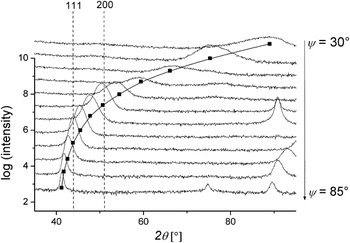
XRD measurements were also performed with variable orientation of the diffraction vector with respect to the specimen-surface normal, by ψ-tilting employing the Eulerian cradle of the diffractometer. The obtained results have been gathered in Fig. 6. Broad intensity maxima occur in-between the Bragg peaks. These intensity maxima shift over a large range of diffraction angle upon tilting the diffraction vector with respect to the specimen frame of reference. It will be shown in Sec. III.B.3 faulting that these (shifts of) intensity maxima are caused by a high density of planar faults in conjunction with a pronounced crystallographic texture.
XRD patterns recorded from a NiW12 specimen at different inclination angles (tilt angles ψ) of the diffraction vector with respect to the specimen-surface normal. The positions of the Bragg peaks of the Ni(W) solid solution have been indicated by the dashed vertical lines. Broad intensity maxima occur at diffraction angles not pertaining to the Ni(W) solid solution, which intensity maxima occur in a diffraction angle range shifting with changing tilt angle ψ [see Eq. (2) and its discussion].

B. Discussion
1. Phase composition
The XRD patterns (absence of diffraction lines pertaining to possibly developing intermetallic phases as Ni4W), the lattice-parameter values [linear dependence of the lattice parameter of the Ni(W) solid solution on the W content for the entire concentration range studied], and the TEM image and SAD pattern analyses presented in Sec. IV.A all support that the Ni–W layers consist of a single-phase Ni(W) solid solution up to and including the highest W concentration (22 at.% W). The occurrence of a solid solution with W concentrations exceeding the solubility limit of the equilibrium phase diagram was reported in other studies of Ni–W films with compositions between pure Ni and Ni containing up to 25 at.% W prepared by sputter deposition as well.Reference Borgia, Scharowsky, Furrer, Solenthaler and Spolenak28
These findings indicate a limited (if at all) segregation of solute for the as-prepared condition of sputter-deposited Ni–W films; increasing the global W content (as confirmed by chemical analysis) increases proportionally the amount of substitutionally dissolved W (as determined by lattice-parameter measurement; see Fig. 2), which contrasts with segregating systems where solute additions can partly (or completely) segregate at the grain boundaries.
2. Grain size and morphology
The XRD line-broadening analyses and the microstructural investigation by FIB and TEM provide a coherent picture of crystallite/grain size and morphology: whereas a globular grain morphology, with a grain size of less than 50 nm, prevails for the Ni layers, a pronounced morphological texture occurs for the Ni–W layers: the Ni–W layers consist of columnar grains of large aspect ratio (15–25), running from top (surface) to bottom (layer/substrate interface) with the column axes oriented parallel to the specimen-surface normal; the in-plane grain size/column width is about 25 nm. No correlation of crystallite size with W concentration is apparent.
3. Planar faulting
A high density of twins parallel to the surface occurs in the Ni–W layers: see the bright/dark contrasts in the bright-field TEM micrograph (diffraction-contrast image) in Fig. 3 and the twin boundary marked in the HR-TEM micrograph in Fig. 4. A rough estimation of the twinning probability can be obtained by counting the number of twin boundaries (on the basis of the bright/dark contrast reversals in the diffraction-contrast images) over a certain length of the twinned grains. It follows that the twinning probability β is in the range 10 to 15%. Similar values were obtained for all W concentrations; no systematic variation with the W concentration could be discerned apart from the twinning probability β in the NiW8 solid solution being somewhat smaller.
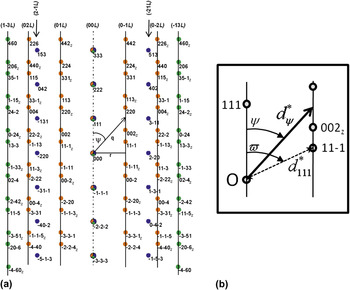
The effect of planar faulting on the SAD patterns can be discussed as follows: because of the occurrence of a strong and sharp {111} fiber texture and the small in-plane dimension of the crystallites, a complete indexing of the SAD pattern shown in Fig. 5, taken on a cross-sectional specimen, requires taking diffraction patterns pertaining to different zone axes into consideration (i.e., a number of columnar crystals with a (111) plane parallel to the surface contributes to the SAD pattern; selecting only one crystallite for the SAD analysis is impossible in view of the small in-plane crystallite size), which zone axes must be oriented perpendicularly to the <111> direction. Full interpretation of the SAD pattern shown in Fig. 5 requires a superposition of diffraction patterns (originating from different columnar crystallites) pertaining to the zone axes [1 −1 0], [−1 −1 2], and [−3 2 1] and their equivalents (as [−1 0 1], etc.). The total diffraction pattern obtained by superposition of the patterns corresponding to the relevant zone axes is shown in Fig. 7 and exhibits an excellent agreement with the experimentally obtained SAD pattern.
(a) Laue indexing of the SAD pattern shown in Fig. 5. Full interpretation of the SAD pattern shown in Fig. 5 requires a superposition of diffraction patterns (originating from different columnar crystallites) pertaining to the zone axes [1 −1 0] (orange spots in the SAD pattern), [−1 −1 2] (blue spots in the SAD pattern); and [−3 2 1] (green spots in the SAD pattern) and their equivalents (as [−1 0 1], etc.). The spots with Laue indices with the subscript “z” are obtained by using respective equivalent zone axes. The indices indicated on top of the figure pertain to “hexagonal indexing” of the vertical row of diffraction spots considered, with L as running index. (b) The sketch explains the calculation of the length (i.e., distance to the origin of reciprocal space) of the diffraction vector pertaining to the cutting of the (0 −1 L) streak [see Eq. (2)].

The Laue indexes of the reflections broadened to streaks in the SAD pattern satisfy the condition h + k + l = 3N ± 1, whereas the Laue indexes of the unbroadened reflections obey the condition h + k + l = 3N, where N is an integer including zero.Reference Velterop, Delhez, de Keijser, Mittemeijer and Reefman40 It is evident from the SAD pattern (see Figs. 5 and 7) that the directions of streaking can be represented by straight lines parallel to the <111 > direction. A convenient notation is possible by converting from cubic (hkl) to hexagonal (HKL) indexing (Fig. 7, top).Reference Whelan and Hirsch41
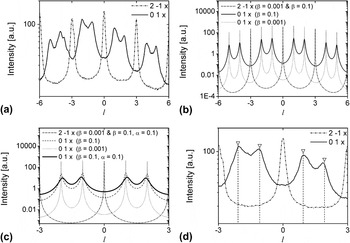
The intensity distributions along the (0 1 L) and (2 −1 L) streaks (hexagonal indexing) have been extracted from the experimental SAD pattern shown in Fig. 5 using the software Gatan Digital Micrograph (Gatan, Pleasanton, CA) and are shown in Fig. 8(a). The intensity distribution along the (2 −1 L) streak (belonging to the category h + k + l = 3N; see above) is characterized by relatively sharp intensity maxima at the positions L = ..., −6, −3, 0, 3, 6, ..., whereas a diffuse intensity distribution occurs along the (0 1 L) streak (belonging to the category h + k + l = 3N ± 1; see above) at the positions L = ..., −5, −4, −2, −1, 0, 1, 2, 4, 5, ....
(a) Intensity distribution extracted from the experimental SAD pattern shown in Fig. 5 for the (0 1 L) and the (2 −1 L) streaks (see Fig. 7). (b) Calculated intensity distributions for (0 1 L) and the (2 −1 L) streaks for different twinning probabilities β. (c) Calculated intensity distributions for (0 1 L) and the (2 −1 L) streaks for different twinning probabilities β and intrinsic faulting probabilities α. (d) Part of the intensity distribution extracted from the experimental SAD pattern for the (0 1 L) and the (2 −1 L) streaks [see (a)] with an indication of the expected peak positions in the absence of intrinsic faulting.

A calculation of the (electron) diffraction patterns of faulted crystals is possible employing the software DIFFaX. In this work, the Fortran 77 version DIFFaX v1.812 (The Portland Group, Lake Oswego, OR) was used.Reference Treacy, Newsam and Deem42 DIFFaX permits calculation of the intensity distribution along (HKL)-streaks where L varies between user-defined values for fixed values of H and K. The intensity distributions along the (0 1 L) and (2 −1 L) streaks have been calculated for different twinning and stacking-fault probabilities [see Figs. 8(b) and 8(c)]. The effects of twinning with twinning probabilities β = 0.001 (i.e., practically no twin faults occur) and β = 0.1 (see Sec. II.B with variable orientation of the diffraction vector) and the simultaneous occurrence of twinning with β = 0.1 and intrinsic faulting with a probability α = 0.1 have been considered. The occurrence of both twinning and intrinsic faulting does not affect the intensity distribution on the (2 −1 L) streak. Twinning results in a considerable broadening (only; no peak-maximum shift) for the intensity maxima on the (0 1 L) streak [Fig. 8(b)]. If both twinning and intrinsic faulting occur, additional broadening of the peaks on the (0 1 L) streak occurs and, moreover, a shifting of the intensity maxima on the (0 1 L) streak occurs such that the intensity maxima at L = 1 and L = 2 shift in opposite directions along the streak, and thus their distance of separation decreases [similarly for L = −1 and L = −2; see Fig. 8(c)].
An enlarged section of the experimentally determined (0 1 L) and (2 −1 L) streaks is shown in Fig. 8(d). The distance in reciprocal space (abscissa) has been calibrated on the basis of the positions of the regularly spaced intensity maxima along the (2 −1 L) streak (which are not affected by faulting), and on this basis, the positions of the maxima on the (0 1 L) streak in the absence of intrinsic faulting have been calculated [dashed lines with markers in Fig. 8(d)]. Even though quantification of intensity distributions extracted from experimental SAD patterns is difficult, it appears that the pairs of intensity maxima at (about) L = 1, 2 and L = −1, −2 have indeed a slightly smaller spacing than as expected for the absence of intrinsic faulting, that is, the occurrence of intrinsic faulting has been validated. This conclusion is confirmed by measuring the distances of a number of pairs of intensity maxima (i.e., at L = 1, 2 and at L = −1, −2, etc.) on different streaks affected by planar faulting, which all are slightly smaller than expected for the absence of intrinsic faulting. Hence, the twinning observed in the Ni–W layers (see also the TEM diffraction-contrast images and the HR-TEM micrograph) is accompanied by the occurrence of intrinsic stacking faults (see also the HR-TEM micrograph). A more quantitative assessment appears to be impossible because of the limited accuracy for a quantitative analysis of the SAD patterns, but a probability of twinning, β, in the range 0.1–0.15 (as determined from the bright/dark contrast in the bright-field TEM diffraction-contrast images) and a probability of intrinsic faulting α < 0.1 [as the distance of the maxima at L = 1, 2 and at L = −1, −2, etc. is not smaller than as calculated for α = 0.1; see Fig. 8(c)] are plausible.
The above presented discussion of the SAD patterns provides the basis for explanation of the intensity distribution observed between the Bragg peaks in XRD patterns recorded with different orientations of the diffraction vector with respect to the specimen frame of reference (Sec. III.A.7). The orientation of the diffraction vector has been indicated in Fig. 7 together with the orientation angle ψ. At ψ = 0°, the XRD pattern thus contains only the 111 reflection and higher orders thereof. Upon tilting the specimen in the diffractometer, that is, upon increasing ψ, the diffraction vector cuts the (0 −1 L) intensity streak, and the diffuse intensity distribution along this streak is exhibited in the XRD pattern by a diffuse intensity maxima, also at specimen-tilt angles where no Bragg peak pertaining to the unfaulted Ni(W) solid solution is expected (see Fig. 9). As the streak has a certain width perpendicular to the streak direction, due to broadening caused by crystallite size and lattice defects and due to the instrumental broadening of the x-ray diffractometer, the broadening of the peak arising from cutting the streak increases with decreasing tilt angle ψ (i.e., at shallow angles of cutting of the streak by the diffraction vector).
Enlarged parts of the XRD patterns recorded from a NiW12 specimen and shown in Fig. 6. The continuous line is the locus, for increasing tilt angle ψ, of the expected position of the diffracted intensity arising from the cutting of the (0 −1 L) streak with the diffraction vector as function of the tilt angle ψ. The square dots indicate the intensity maximum positions (abscissa values) at the corresponding specimen-tilt angle.

The diffraction angle θ pertaining to the intersection of the diffraction vector with one of the streaks can be calculated as a function of the tilt angle ψ. For example, for the position of the cut of the (0 −1 L) streak, it is obtained [see Fig. 7(b)]:
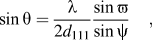
where  (i.e., the tilt angle of the inclined (111) planes with respect to the stacking direction), d 111 is the lattice-plane spacing of the (111) planes, and λ is the x-ray wave length. On the basis of this calculation, the expected 2θ positions of the intensity maxima, arising from the cutting of the (0 −1 L) streak for increasing ψ, have been calculated, and these 2θ positions have been marked in the diffraction patterns (constant ψ, increasing 2θ) presented in Fig. 9 (which shows enlarged parts of the diffraction patterns shown in Fig. 6). An excellent agreement of the expected peak position and the position of the experimentally observed intensity maximum can be observed.
Nanoscale twinning has been observed for sputter-deposited pure metal films of low stacking-fault energy as austenitic stainless steel and copper (both stacking-fault energies are about 40 mJ/m2; see Ref. Reference Rhodes and Thompson43 and references therein) upon applying a high deposition rate.Reference Zhang, Misra, Wang, Nastasi, Embury, Mitchell, Hoagland and Hirth44–Reference Zhang, Anderoglu, Hoagland and Misra47 Even for Ni exhibiting a considerably higher stacking-fault energy (≈110 mJ/m2),Reference Siegel48 a high twinning density can occur at a sufficiently high deposition rate (of the order of tens of nanometers per second).Reference Dahlgren, Nicholson, Merz, Bollmann, Devlin and Wang49 In the present work, a comparatively low deposition rate (≈0.5 nm/s) was used (see Sec. II.A). Indeed, nanoscale twinning did not occur for the Ni specimens, but only for the Ni–W specimens.
In view of the above discussion, nanoscale twinning and intrinsic faulting of the Ni–W specimens may be ascribed to the lowering of the stacking-fault energy by the addition of W: indeed, stacking-fault energies as low as 40 mJ/m2 can be achieved in the system Ni–W.Reference Siegel48 Thus, as an alternative to performing depositions with a high rate, nanotwinning can be induced/promoted in (metallic) layers by alloying.
4. Residual stresses
Diffraction-stress analysis of the Ni–W layers on the basis of the crystallite group method involves the use of (also) the 111 diffraction line at a tilt angle ψ = 70.53° of the diffraction vector, which is affected by planar faulting (see Fig. 7). This induces a minor error in the determined stress value and a very small error in the strain-free lattice parameter, as will be shown elsewhere.Reference Kurz, Welzel and Mittemeijer50 For the present work, this minor effect can be and has been ignored. The Ni layer exhibits a small tensile stress (see Table II). This tensile stress can be attributed to the cooling of the specimen after completion of the deposition process (see Sec. II.A): the thermoelastic slope Ξ (thermal stress per Kelvin) can be calculated employing the biaxial modulus M for a perfectly {111} fiber-textured specimen calculatedReference Nix51, Reference Chakraborty, Welzel and Mittemeijer52 from single-crystal elastic data (M = 356.9 GPa; see Sec. II.B) and the difference of the linear coefficients of thermal expansion of Si α Si and Ni α Ni (α Si = 2.97 × 10⁻⁶ 1/K, α Ni = 1.37 × 10⁻⁵ 1/KReference Touloukian, Kirby, Taylor and Desai53):

For a cooling range of about 25 K, the thermal stress expected for the Ni layer thus is about 100 MPa, which is compatible with the experimental results (see Table II).
A large tensile stress occurs for the Ni(W) layer of lowest W concentration (NiW8); the stress decreases pronouncedly with increasing W content. This can be understood as follows: all Ni–W layers are composed of columnar crystallites. Tensile stresses in columnar microstructures can arise from intercolumnar attractive forces acting across voids (which may be of atomic size) at the column boundaries.Reference Ohring54 With increasing W content, the deposition rate increases (see Sec. II.A) and thus the contribution of atomic peening, resulting in a compressive stress contribution, increases. The pronounced nature of the decrease of the tensile stress (i.e., increase of a compensating compressive stress contribution) with increasing W content may be due to the relatively high atomic mass of W, thereby promoting the effect of atomic peening with increasing W content.Reference Ohring54
IV. MICROSTRUCTURAL EVOLUTION DURING ANNEALING
A. Results
1. In situ XRD phase analysis, line-broadening analysis, and texture analysis
XRD phase analysis revealed that all Ni–W specimens maintain a single-phase state [Ni(W) solid solution], even for the holding time at the maximum temperature of 550 °C. In particular, it is noted that the formation of Ni4W does also not occur for the specimen NiW22, which has a W concentration pertaining to the two-phase Ni4W/NiW (compound) region in the equilibrium phase diagram. Moreover, the intensity distributions observed between the Bragg peaks in XRD investigations of Ni–W specimens at different orientations of the diffraction vector with respect to the specimen frame of reference (see Fig. 6) do not change significantly upon annealing. This indicates that the microstructure of planar faulting is stable against the heat treatment.
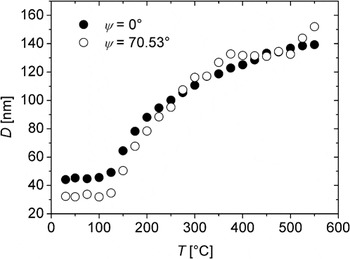
The crystallite size as function of the annealing temperature, as derived from the line broadening, for the pure Ni layer is shown in Fig. 10. The onset of pronounced grain growth occurs at a temperature of about 125 °C. The microstrain (not shown), from an initial value of about 0.001, decreases rapidly to zero with increasing temperature. Upon reaching the highest annealing temperature of 550 °C, a crystallite size of 130–150 nm is reached both perpendicularly to the specimen surface (i.e., measured at ψ = 0°) and (more or less) parallel to the specimen surface (i.e., measured at ψ = 70.53°). These results agree well with data obtained from the TEM and FIB investigations performed in this work. Texture analysis revealed that the grain growth is accompanied by considerable texture sharpening (the pole width decreases from about 4°, see Sec. III.A.3, to about 2° after annealing at 550 °C), but the texture character remained unchanged (i.e., the twins due to twinning on inclined (111) planes are not consumed upon annealing).
Evolution of the crystallite size, D, of a Ni layer as determined by XRD line-broadening analysis during heating to a temperature of 550 °C.

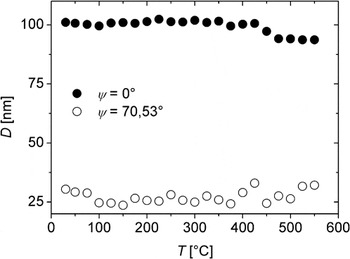
A strikingly different result was obtained for the Ni–W specimens. As similar results are obtained for all W concentrations, only the results obtained for the specimen NiW12 are discussed in the following (see Fig. 11). No change of the crystallite size occurs upon heating up to about 400 °C. The microstrain (not shown) is practically zero at ψ = 0° and about 0.01 at ψ = 70.53° and stays constant up to the highest annealing temperature of 550 °C. At about 425 °C, a slight decrease of the crystallite size perpendicular to the specimen surface (as measured at ψ = 0°) appears to occur, whereas the crystallite size obtained at ψ = 70.53° stays practically constant.
Evolution of the crystallite size, D, of a NiW12 layer as determined by XRD line-broadening analysis during heating to a temperature of 550 °C.

2. XRD in situ stress analysis
The results of the in situ XRD stress measurements for the stress parallel to the surface are shown in Fig. 12 for a complete heat-treatment cycle of a pure Ni specimen between room temperature and 550 °C. The expected thermoelastic stress evolution calculated for a perfectly {111} fiber-textured specimen (see Sec. III.B.4) has been indicated by the dashed line.
Evolution of the stress, σ, parallel to the surface of a Ni layer during a thermal cycle (see Sec. II.B) between ambient temperature and 550 °C.

It is evident that the experimentally observed stress evolution deviates pronouncedly from purely thermoelastic behavior, which would induce large compressive stress: pronounced tensile stress contributions develop upon heating the specimen as the stress evolution deviates from the thermoelastic line toward the tensile direction. This (compensating) tensile stress contribution can be attributed to thermally activated relaxation processes as grain growth (reduction of excess free volume associated with grain boundariesReference Kuru, Wohlschlogel, Welzel and Mittemeijer55). At elevated temperatures, plastic accommodation of thermal strains may also play a role. At the highest annealing temperature, a slightly compressive stress occurs (about −100 MPa), which does not change significantly during the holding time of 12 h. Upon cooling, the stress becomes tensile and, below about 350 °C, an approximately linear (tensile) stress evolution is obtained. However, the (absolute) value of the slope is significantly smaller than that expected for a purely thermoelastic behavior. This is indicative of the occurrence of plastic deformation, which appears likely in view of the considerable tensile stress level exceeding 1 GPa at ambient temperature.
The strain-free lattice parameter as function of temperature and thus the thermal expansion were obtained from the in situ diffraction-stress measurements at each temperature by interpolation at the strain-free direction sin2ψ * in plots of the lattice-plane spacing versus sin2ψ (see Sec. II.B). The measured thermal expansion for the Ni specimen (results not shown) follows the expected thermal expansion, as predicted from the linear coefficient of thermal expansion (CTE),Reference Touloukian, Kirby, Taylor and Desai53 very well. This validates the temperature calibration of the heating chamber (see Sec. II.B).
As similar results were obtained for all W concentrations, only the stress evolution as determined for the NiW12 specimen is shown in Fig. 13. The heating segment of the cycle is characterized by a linear decrease of the stress up to about 350 °C (slope: −3.54 MPa/K). At and above this temperature, a pronounced tensile stress contribution, as compared to the stress evolution extrapolated from the linear behavior in the temperature interval between room temperature and 350 °C, occurs. During the holding time at 550 °C, the stress changes in the compressive direction by about 350 MPa, followed upon cooling by a linear (tensile) stress increase with a slope somewhat less negative than that obtained upon heating up to 350 °C (slope: −3.01 MPa/K).
Evolution of the stress, σ, parallel to the surface of a NiW12 layer during a thermal cycle (see Sec. II.B) between ambient temperature and 550 °C. The temperature of 550 °C was maintained for a holding time of 12 h in between the heating and cooling segments of the thermal cycle. The stress contribution due to the “segregation stress” has been marked as a vertical line with double arrow heads (see text in Sec. IV.B). The dashed line indicates the linear extrapolation of the stress evolution as measured in the temperature range between ambient temperature and 350 °C.

From the strain-free lattice parameter, a 0 (T) (see Sec. II.B), the relative expansion ε with reference to the strain-free lattice parameter at 25 °C was calculated as
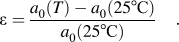
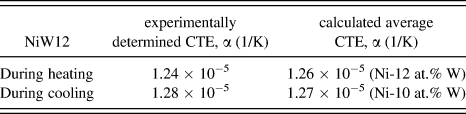
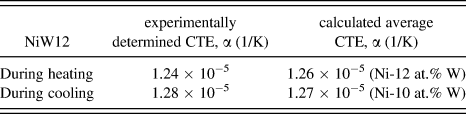
The result is shown for the NiW12 layer in Fig. 14(a). A linear increase of the expansion ε due to thermal expansion occurs in the temperature interval between ambient temperature and 350 °C. The slope of the expansion ε as function of temperature gives the linear CTE. For the Ni–W specimens, a literature value for the linear CTE is not available, but an estimate may be obtained by calculating the (atomic) concentration-weighted average of the CTEs of Ni and W (see Table III). The accordingly expected thermal expansion ε has been indicated in Fig. 14(a) by the continuous line. The expected and the measured expansions agree very well up to about 350 °C.
(a) Relative expansion ε, with reference to the strain-free lattice parameter at 25 °C, of a NiW12 layer obtained from XRD stress analysis during a thermal cycle (see Sec. II.B) between ambient temperature and a temperature of 550 °C. (b) W concentration change, ΔX W, derived from the difference between the thermal expansion and the measured total expansion ε. For details, see Sec. IV.A.2.

Linear coefficients of thermal expansion (CTE) for the NiW12 specimen obtained as the slope of the lattice expansion plotted versus temperature in the temperature regime between 25 and 350 °C during heating and cooling (cf. Fig. 14; second column) and calculated linear coefficients of thermal expansion for Ni(W) solid solutions obtained as arithmetic averages of the linear coefficients of thermal expansion of pure Ni and pure W (third column; further, see text in Section XRD in-situ stress analysis).
A pronounced deviation from thermal expansion behavior is observed between 350 and 550 °C: contraction occurs. This strikingly nonlinear behavior in the temperature range between 350 –550 °C may be due to a change of the W concentration of the Ni(W) solid solution resulting in a change of the strain-free lattice parameter. Thus, the decrease of the expansion ε with increasing temperature hints at a W depletion of the Ni(W) solid solution [see Eq. (1)], likely due to W segregation (for further discussion see Sec. IV.B). The observed, total lattice expansion is given by a contribution of compositional expansion (strain), ε comp, and a contribution of thermal expansion, ε thermal:

A W concentration change, ΔX W at constant temperature, results in a compositional expansion:

where  is the initial W content of the Ni(W) solid solution.
Employing Eq. (1), it follows from Eq. (6):

where it will be assumed that k is practically independent of temperature.
Adopting the above approach, the change in W concentration, ΔX W, for the NiW12 solid solution during the applied heat-treatment cycle has been calculated from the experimental data for the observed, total strains. The result is shown in Fig. 14(b).
Upon cooling, a negative expansion (i.e., contraction), linearly dependent on temperature, is observed as expected for pure thermal shrinkage. The linear CTE derived from the slope of the straight line observed is slightly larger than the value obtained during heating (see Table III). This can be understood as a change of the CTE because of the change of the W concentration of the Ni(W) solid solution in the last part of the heating segment of the heat-treatment cycle (see above).
3. Transmission electron microscopy
The pronounced grain growth in the pure Ni layers occurring during the heat treatment, as observed by XRD line-broadening analysis (see Fig. 10), was confirmed by cross-sectional TEM micrographs.
For the Ni–W specimens, cross-sectional TEM micrographs do not reveal any morphological changes upon annealing as compared to the as-deposited state. These TEM results thus are fully compatible with the results obtained by XRD line-broadening analysis. The SAD patterns exhibit intensity streaks after annealing as observed in the as-deposited condition, thereby confirming that the (extent of) planar faulting is not affected by annealing the Ni–W specimens, as indicated by the XRD measurements (see Sec. IV.A.1).
B. Discussion; segregation and the development of “segregation stress”
The in situ XRD line-broadening analysis, the in situ XRD stress analysis, and the ex situ XRD texture analysis indicate that pronounced thermally activated relaxation processes as grain growth and a decrease of the crystalline imperfection occur in a pure Ni layer upon heating. The associated annihilation of excess free volume (as contained in grain boundaries) results in a pronounced tensile stress contribution (see Fig. 12), as recently demonstrated for nanocrystalline metal films.Reference Kuru, Wohlschlogel, Welzel and Mittemeijer55
The stability of the microstructure of the Ni–W layers up to an annealing temperature of about 350 °C is in line with results obtained for electrodeposited Ni–W alloy layers with an equiaxed microstructure,Reference Detor and Schuh21 where grain coarsening did not occur upon annealing up to about 500 °C, followed by normal grain growth at higher temperatures. The stability against grain coarsening (as compared to pure Ni thin films) has been attributed to a combined effect involving both a grain-boundary-energy reduction, that is, the driving force for grain coarsening is reduced, and an increased activation energy for grain-boundary migration.Reference Detor and Schuh21 For the columnar layers investigated in the present work, grain growth would be limited to two-dimensional growth in the plane of the film. Stagnant columnar structures (i.e., no further grain coarsening takes place) are commonly encountered in thin films and occur when drag forces, as exerted for instance by thermal grooves, act on the grain boundaries.Reference Thompson56 For the columnar Ni–W layers, segregated W atoms will exert drag forces on the columnar grain boundaries and will likely also simultaneously lower the grain-boundary energy and increase the activation energy for grain-boundary mobilityReference Detor and Schuh21 (see also Sec. I). Results on the grain-growth behavior over a wider temperature range, likely permitting a distinction of the different stabilization mechanisms for Ni–W thin films, will be presented elsewhere.Reference Kurz, Welzel and Mittemeijer50
It follows from the results obtained in the present work that the microstructural changes in the Ni–W layers, in the temperature regime between 350 and 550 °C, appear to be dominated by W segregation, as indicated by the annealing-induced W depletion of the Ni(W) solid solution (see Fig. 14). The experimentally determined W depletions of the Ni(W) solid solutions (upon annealing up to 550 °C) have been summarized for the Ni(W) layers investigated in Table IV. These results reveal that the amount of segregated W increases with increasing W content of the Ni(W) solid solution. The absence of pronounced segregation at ambient temperature (see Sec. III.B.1 and Ref. Reference Detor and Schuh22) can be ascribed to the limited W mobility at this temperature rather than to a lack of the driving force for segregation. W is initially homogeneously distributed in Ni by cosputtering performed at room temperature (i.e., intermixing of Ni and W occurs initially on an atomic scale); segregation of W (to attain an equilibrium state by a redistribution of the W concentration) thus requires sufficient W mobility.
W depletion (negative increase of W content) of the matrix [Ni(W) solid solution] of the Ni(W) layers upon annealing up to 550 °C as derived from the decrease of the strain-free lattice parameter.

Estimating the diffusion length of W in Ni on the basis of the tracer diffusion coefficient  for W in Ni by
 , using the preexponential factor A and the activation energy Q for W tracer diffusion in Ni as given in Ref. Reference Guiraldenq57 (A = 2.87 cm2 · s−1 and Q =308.1 kJ · mol−1), demonstrates indeed that W is essentially immobile at ambient temperature. On the same basis, at an annealing temperature of 550 °C, diffusion lengths of the order of a nm are obtained for a time period of 1 h. Thus, W segregation is possible at elevated temperatures during the heat treatments performed in this work (further note that the defective microstructure of sputter-deposited thin films can enhance lattice diffusion substantially; see, for example, Ref. Reference Chakraborty, Welzel and Mittemeijer58).
Additional results obtained in this investigation are compatible with the occurrence of W segregation:
(i) Comparing the coefficients of thermal expansion as determined from the temperature evolution of the strain-free lattice parameter during heating (below the onset of segregation) and during cooling (see Fig. 14) shows that for all Ni–W specimens the coefficients of thermal expansion derived from the cooling segments are systematically larger than those derived from the heating segments. This indicates that the crystallites of the Ni–W layers have a lower W concentration after annealing and thus a larger CTE (see Table III).
(ii) W depletion of the Ni(W) solid solution corresponds with decrease of the lattice parameter of the Ni(W) solid solution [see Eq. (1)] and thus to a “segregation strain” that develops as compared to the initial situation [i.e., before the occurrence of segregation; see Eq. (6)]. As a result, the (also) lateral dimensions of the Ni(W) crystallites tend to decrease. In view of the cohesive bonding with the (thick) substrate, then a tensile “segregation stress” parallel to the surface can be induced. For the NiW12 specimen, the “segregation stress” is calculated to be 1 GPa upon depletion of the Ni(W) solid solution with 2 at.% W. This calculated “segregation stress” contribution has been marked as a vertical line with double arrow heads in Fig. 13: An excellent agreement occurs of this (tensile) stress change because of W segregation with the experimentally observed stress change, with respect to the extrapolated thermoelastic behavior (see dashed line in Fig. 13).
For the Ni–W layers investigated, an ultrahigh density of planar defects (twin boundaries and stacking faults) occurs perpendicular to the specimen-surface normal. Segregation to planar defects in fcc metals (“Suzuki effect”; see Ref. Reference Suzuki59) can occur because of a lowering of the stacking-fault energy by segregation (see, for example, Refs. Reference Herschitz and Seidman60 and Reference Mendis, Jones and Smallman61). Considering that the diffusion distances for W segregation to these planar faults are much smaller than the diffusion distances to the intracolumnar grain boundaries oriented more or less perpendicularly to the specimen surface, it is likely that W segregation occurs predominantly at the planar faults. Therefore, whereas the W depletion within the Ni(W) grains results in an isotropic shrinkage (and thus to a pronounced in-plane tensile “segregation stress” contribution; see earlier discussion), the W accumulation predominantly occurring at the planar faults parallel to the surface leads to an expansion only along the direction of the specimen-surface normal, which can occur unconstraintly and thus does not induce a macroscopic stress contribution in this direction.
The above discussion also provides an explanation for the observed (moderate but significant) decrease of the crystallite (domain) size in the direction parallel to the specimen-surface normal of the Ni–W layers above 400 °C (see Fig. 11): W segregation to the planar faults parallel to the surface leads to a loss of coherency for diffraction from planes oriented parallel to the planar faults. This reduced coherency is exhibited as a decrease of the crystallite (domain) size in the direction of the specimen-surface normal.
V. CONCLUSIONS
(1) By cosputtering of Ni and W, single-phase Ni(W) solid-solution layers with a W concentration up to, at least, 22 at.% W (i.e., beyond the equilibrium solid solubility of about 12 at.% W) can be produced.
(2) Both pure Ni and Ni–W layers exhibit very strong and very sharp {111} fiber textures. In the Ni layers, minor texture components occur as a result of (also multiple) twinning on (with respect to the surface) inclined (111) planes. Such twinned components do not occur for the Ni–W layers investigated.
(3) The Ni layers exhibit a nanocrystalline, globular grain morphology. The Ni–W layers are composed of needle-shaped, columnar crystallites oriented perpendicular to the surface (i.e., parallel to the growth direction); most of the crystallites extend throughout the entire layer thickness (500 nm) with an in-plane size of only a few tens of nanometers.
(4) The Ni–W layers exhibit a very high density of planar [twin and (intrinsic) stacking] faults oriented perpendicular to the growth direction. The nanoscale planar faulting is induced by a lowering of the stacking-fault energy of Ni by alloying with W.
(5) Planar faulting in combination with the strong and sharp {111} fiber texture results in very peculiar diffraction effects both in SAD and XRD patterns: intensity streaks occur along certain directions in reciprocal space in the SAD patterns; diffuse intensity maxima, shifting their position with changing orientation of the diffraction vector (with respect to the specimen frame of reference), occur in x-ray diffractograms.
(6) Pronounced grain coarsening occurs for the nanocrystalline pure Ni thin films already upon heating to temperatures as low as about 125 °C. This grain growth leads to the development of a distinct tensile stress component parallel to the surface, as a result of annihilation of excess free volume in grain boundaries. The microstructure, comprising the grain size and planar faults and the state of stress, of the nanocrystalline Ni(W) thin films remains stable up to much higher temperatures, even exceeding 350 °C: the addition of W to the nanocrystalline microstructure causes its preservation up to much higher temperatures.
(7) Above 350 °C, a W depletion of the Ni(W) solid solutions occurs due to W segregation at planar faults. This effect leads to the development of a tensile “segregation stress” parallel to the surface of the Ni–W layers. W segregation at the planar faults parallel to the surface does not lead to development of a stress component.
ACKNOWLEDGMENTS
The authors thank Dr. G. Richter and Mr. F. Thiele (Max Planck Institute for Intelligent Systems, Central Scientific Facility “Thin Film Laboratory”) for the sputter deposition of the layers and Dr. Markus Wohlschlögel (now at Admedes Schüssler GmbH, Pforzheim, Germany) for contributions during initial stages of the research work.