


Recently, pundits, politicians, and ordinary citizens have expressed growing concern over political polarization in the United States and the media’s purported role in exacerbating the problem. In a January 2018 interview, former President Barack Obama observed that viewers of Fox News are “living on a different planet” from National Public Radio listeners. He added that “We are operating in completely different information universes… At a certain point, you just live in a bubble. And that’s part of why our politics is so polarized right now.”Footnote 1
Perhaps, as Obama suggests, partisan news media cause, or at least exacerbate, polarization between liberals and conservatives. This perspective places the blame at the feet of the media: by presenting one-sided versions of issues, partisan media outlets like Fox News on the right and MSNBC on the left drive Americans apart. These slanted news sources persuade individuals that a particular one-sided version of issues represents the unvarnished truth.
A second possibility is that in a world of fragmented media, the more polarized our country becomes, the more pre-existing political attitudes drive people’s choices of news outlets. If so, this represents a clear example of selective exposure (e.g., Lazarsfeld, Berelson, and Gaudet Reference Lazarsfeld, Berelson and Gaudet1948)—the tendency to seek out information that reinforces preexisting views.
These competing perspectives on the relationship between the media and the public suggest very different roles of partisan media in the modern political system. Do like-minded individuals seek out partisan news sources that support their preexisting beliefs—resulting in a tendency toward a particular perspective among consumers of ideologically narrow partisan media outlets via self-selection? Or do consumers of partisan news alter their views to reflect information encountered in such outlets, resulting in increased polarization between consumers of liberal and conservative news? In the former instance, media choice reflects polarization; in the latter, media choice causes it. Relatedly, is the rise of partisan media a cause or an effect of public polarization? If the former, how might partisan media exacerbate the polarization of opinion?
We investigate whether and how partisan media contribute to attitude polarization by assessing the extent to which such media can persuade consumers with differing preexisting media preferences. That is, do partisan media cause individuals to change their attitudes in line with the valence of the media message? Adopting a new experimental design, which we call the Preference-Incorporating Choice and Assignment (PICA) design, this study combines traditional experimentally randomized exposure to media with a more organic choice process. Our PICA design expands upon the patient preference trial (PPT) framework by not only measuring media consumption preferences but also by accounting, within the same procedure, for the effects of both forced exposure to media and choice among media options. Our design therefore allows us to estimate the degree of selective exposure, while simultaneously disaggregating our estimates of the persuasive power of the media by individuals’ preferences for particular media sources.
We estimate the degree of polarization originating from selective exposure by comparing opinions among different groups of news consumers. We distinguish between those individuals who would, if given the choice, read a given partisan media story and those who would elect not to read partisan news. This allows us to compute the degree of polarization that exists absent exposure to ideologically dissonant media.
We also compute the treatment effect of partisan news on political opinions and behavior, disaggregated into a series of choice-specific treatment effects. We thus demonstrate the heterogeneity of partisan media’s power on different groups of news consumers. We show that partisan media are most likely to persuade individuals who would choose to consume entertainment media rather than partisan media. The treatment effects after one instance of exposure among these inadvertent partisan media consumers are substantial when compared to real-world polarization, reaching close to half the size of existing attitudinal differences between partisan news consumers from opposing sides of the political spectrum.
Those individuals who do prefer partisan media are also persuadable, albeit to a limited extent. Consuming opposing partisan media can decrease polarization under some circumstances. We therefore provide evidence that while selective exposure—self-selection by readers into ideologically consonant partisan news sources—limits the exposure of ideological extremists to media that causes them to moderate their opinions, partisan media may ameliorate this polarization. However, we also show that the behavioral effects of partisan media are strongest among consumers of MSNBC, indicating that the downstream effects of exposure to partisan media are likely to have ramifications for how people share information with others in their lives. Additionally, in an advance over other studies that have employed the PPT framework, our design also enables us to estimate the sensitivity of these results to discrepancies between people’s stated media preferences and their actual choices, an important source of potential bias unaccounted for in prior research. These sensitivity analyses highlight the consequences of relying on naïve treatment effect estimates in experimental paradigms where there is a danger of large discrepancies between survey-expressed preferences and actual choices. Finally, while we report the results based on a single news topic in the main text, in Online Appendix E we present replications employing three additional news topics, survey modalities, and population samples, thereby demonstrating that our findings are generalizable.
POLARIZATION AS A CAUSE OR AN EFFECT OF PERSUASION?
There is a broad agreement that Americans increasingly have opportunities to consume unbalanced news. For instance, the typical US household now receives about 190 television channels, more than a tenfold increase since 1980. The options for different news sources on the Internet are even more numerous. This explosion of media outlets has vastly increased the choices available to consumers and allowed for the development of ideological “niche” news outlets (Hamilton Reference Hamilton, Overholser and Jamieson2005). Partisan media are widely accessible (Baum and Groeling Reference Baum and Groeling2010; Groeling Reference Groeling2013) and often present news that is more beneficial to one party than the other (Baum and Groeling Reference Baum and Groeling2008). The public widely recognizes this partisan slant, routinely associating Fox News and MSNBC with heavy biases toward the Republican and Democratic parties, respectively (Ladd Reference Ladd2012).
But how do such media actually influence the political preferences of Americans? Whenever social scientists observe a difference between actors exposed to different stimuli in a context where it is not possible to control who gets the treatment, the question arises as to whether any effect results from the treatment itself, or from preexisting differences between the actors exposed to different treatments. This is the problem of self-selection. Many studies designed to determine the effects of partisan media on polarization are thus ill-equipped to disentangle the preexisting differences from the effects of media treatments. The observed differences in attitudes among individuals exposed to partisan information could stem from variation in either the information itself or the kinds of individuals who choose to expose themselves to it.
Most research has addressed only one of these concerns. Some studies treat polarization primarily as a cause of media fragmentation, through individuals’ decisions to selectively expose themselves to partisan media. Others treat polarization as an effect, focusing on the possibility that media fragmentation enhances political polarization because partisan media persuade individuals to adopt more extreme political views. We discuss both approaches, before proposing a corrective for individuals’ tendencies to inaccurately recall their media consumption.
INTEGRATING SELECTIVE EXPOSURE WITH PERSUASION
Research dating back to the 1940s (e.g., Campbell et al. Reference Campbell, Converse, Miller and Stokes1960; Lazarsfeld, Berelson, and Gaudet Reference Lazarsfeld, Berelson and Gaudet1948) has theorized that selective exposure to information causes divergent political opinions. This research found evidence of such selective exposure to partisan information in media consumption patterns.
Over the last decade, researchers have more precisely identified some of the conditions under which selective exposure occurs. Many researchers (Arceneaux, Johnson, and Murphy Reference Arceneaux, Johnson and Murphy2012; Gaines and Kuklinski Reference Gaines and Kuklinski2011; Iyengar and Hahn Reference Iyengar and Hahn2009; Stroud Reference Stroud2011) have shown that Democrats and Republicans—especially the strongest (Iyengar et al. Reference Iyengar, Hahn, Krosnick and Walker2008; Kim Reference Kim2009) and most politically engaged (Bennett and Iyengar Reference Bennett and Iyengar2008) partisans—prefer news that supports their preexisting beliefs. The implication is that political preferences shape media choice, albeit with some limitations due to increasing online information consumption (Brundidge Reference Brundidge2010; Messing and Westwood Reference Messing and Westwood2014; Mummolo Reference Mummolo2016).
Widespread self-selection into partisan media streams is troubling for democracy because it could lead to increasingly insular partisan information silos among the public (Sunstein Reference Sunstein2001; Negroponte Reference Negroponte1995; Pariser Reference Pariser2012; but see Gentzkow and Shapiro Reference Gentzkow and Shapiro2011; Leeper Reference Leeper2014; Prior Reference Prior2007). If individuals only expose themselves to one side of an argument, they may disproportionately reinforce their attitudes, thereby becoming less inclined to compromise or moderate their views.
This line of research, however, does not account for persuasion by the media. Recent innovations in our understanding of human information processing have upended the longstanding scholarly view that people are largely immune to persuasion (e.g., Berelson, Lazarsfeld, and McPhee Reference Berelson, Lazarsfeld and McPhee1954; Campbell et al. Reference Campbell, Converse, Miller and Stokes1960; Lazarsfeld, Berelson, and Gaudet Reference Lazarsfeld, Berelson and Gaudet1948). Zaller (Reference Zaller1992), for instance, argues that researchers have looked for persuasion in the wrong place. He asserts that it is the moderately politically aware—not their more highly aware counterparts—who are most amenable to persuasion. These individuals pay enough attention to encounter political messages but not so much that they can effectively counter-argue information that challenges their preexisting beliefs. Those with stronger beliefs are more likely to engage in motivated reasoning: discounting the arguments with which they disagree, while giving undue weight to arguments with which they already agree (Bolsen, Druckman, and Cook Reference Bolsen, Druckman and Cook2014; Kunda Reference Kunda1990; Leeper and Slothuus Reference Leeper and Slothuus2014; Taber and Lodge Reference Taber and Lodge2006).
Other research has shown that media can be persuasive, at least within controlled experiments. Scholars have begun to identify conditions under which persuasion is more or less likely to occur (Bullock Reference Bullock2011; Dilliplane Reference Dilliplane2014; Feldman Reference Feldman2011a, Reference Feldman2011b; Levendusky Reference Levendusky2013b), as well as under which partisan media may provoke a backlash against the perspective being advocated (Zaller Reference Zaller1992), the outlet presenting the argument (Arceneaux, Johnson, and Murphy Reference Arceneaux, Johnson and Murphy2012; Coe et al. Reference Coe, Tewksbury, J. Bond, L. Drogos, W. Porter and Yahn2008;), or even the media more generally (Ladd Reference Ladd2012).
PROMISE AND LIMITATIONS OF EXISTING RESEARCH
To date, in studying media effects, scholars have struggled to resolve the problem of self-selection underlying the theory of selective exposure. Even controlled experiments designed to identify the effects of partisan media on polarization cannot determine whether real-world-observed differences in attitudes among individuals exposed to different information stem from differences in the information or in the individuals choosing to expose themselves to it.
Typical experiments begin by assessing participants’ political partisanship and ideology. Researchers then follow one of the two different general designs. In the first, forced-exposure design, researchers present participants with a single randomly assigned news item and then ask for their opinions on political issues (see e.g., Feldman Reference Feldman2011; Levendusky Reference Levendusky2013b). This design allows for causal investigation of persuasion by the single source. Yet, it may produce heterogeneous effects, depending on respondents’ underlying preferences about alternative news sources, thereby making it difficult to generalize to real-world polarization.
In the second, far less common, free-choice design, researchers present respondents with multiple news items from which to choose and then ask for their opinions on issues over which partisans usually disagree (see, e.g., Ellithorpe, Holbert, and Palmer-Wackerly Reference Ellithorpe, Holbert and Palmer-Wackerly2013; Knobloch-Westerwick and Kleinman Reference Knobloch-Westerwick and Kleinman2012; Knobloch-Westerwick and Meng Reference Knobloch-Westerwick and Meng2009). This allows investigators to determine the extent to which participants choose sources compatible with their preexisting beliefs, as well as to measure differences in attitudes between participants who consume different news sources. However, the lack of controlled randomization prevents researchers from identifying a media persuasion effect because the design does not account for selection bias.
Recent research incorporates individual preferences when estimating the persuasive power of the media. Arceneaux and Johnson (Reference Arceneaux and Johnson2013) and Arceneaux, Johnson, and Murphy (Reference Arceneaux, Johnson and Murphy2012) incorporate the elements of both designs in a single study following recommendations from Gaines and Kuklinski (Reference Gaines and Kuklinski2011). In their “selective exposure experiment,” Arceneaux, Johnson, and Murphy (Reference Arceneaux, Johnson and Murphy2012) randomly treat half of their participants with a liberal, conservative, or entertainment news story and then observe the effects of that treatment on subsequent attitudes (the forced-choice component). They allow the other half of their participants to choose any one of the same three program choices (the free-choice component). They then compare the observed effects on attitudes toward the media (Arceneaux, Johnson, and Murphy Reference Arceneaux, Johnson and Murphy2012) and policy opinions (Arceneaux and Johnson Reference Arceneaux and Johnson2013). Because this combined design does not capture common information on media preferences from both the free-choice and the forced exposure groups of respondents, they cannot estimate the group-specific effects of media exposure, despite randomization between forced exposure and free choice. Instead, they analyze the free-choice group of respondents as a single-treatment group, limiting the conclusions they can draw.
In a separate experimental design, Arceneaux and his colleagues (Arceneaux, Johnson, and Murphy Reference Arceneaux, Johnson and Murphy2012, 183; Arceneaux and Johnson Reference Arceneaux and Johnson2013, 85) incorporate the measurement of media preferences prior to the forced-exposure procedure. These “patient preference designs,” or “participant preference experiments,” measure respondents’ preferences for consuming media, but do not incorporate choice. Levendusky (Reference Levendusky2013a, Reference Levendusky2013b) employs a similar design and separately estimates persuasion among individuals who prefer like-minded and oppositional partisan media. Assuming respondents’ stated media preferences match their actual media choices, this design can provide a causal estimate of the effects of media exposure conditional on media choice.Footnote 2 However, people’s preferences may differ from their actual choices when given media options beyond just news. Moreover, given the difficulty individuals have in accurately recalling their own past media consumption (Prior Reference Prior2007, Reference Prior2013), it is also important to account for the potential discrepancy between self-reported and real-world viewing behavior. Revising their design, as delineated below, allows us to better understand and measure whether and to what extent estimates of the persuasive effects of partisan media depend on untestable assumptions about survey self-reports.
DESIGN
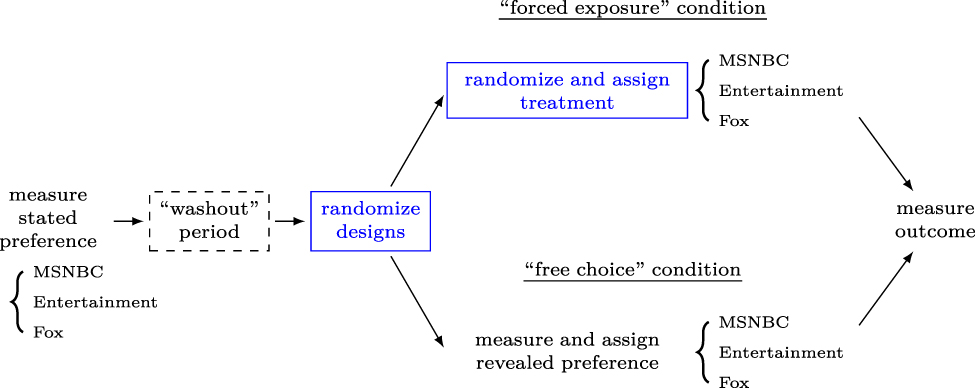
Our study resolves the trade-off between the reliable measurement of preferences offered by selective exposure studies, on the one hand, and the identification of persuasion effects among subgroups of the population that do or do not consume a given media option, on the other. We do so by using our new PICA design (Figure 1). In this design, we randomly assign participants to either a forced exposure or free choice treatment condition. Each of the two conditions individually resembles procedures separately employed by Arceneaux and his colleagues (Arceneaux and Johnson Reference Arceneaux and Johnson2013; Arceneaux, Johnson, and Murphy Reference Arceneaux, Johnson and Murphy2012; Gaines and Kuklinski Reference Gaines and Kuklinski2011; Levendusky Reference Levendusky2013a, Reference Levendusky2013b). But the PICA design combines them into a single framework. Participants in both conditions read news reports from either Fox News, MSNBC, or an entertainment network (the Food Network). We derive all reports from real online news stories, which we edited to equalize length and framing.Footnote 3 For the partisan media treatments, the articles discussed either the economic, social, safety, or public health effects of legalizing marijuana.Footnote 4 On each topic, the Fox News and MSNBC articles were nearly identical except for text that was either supportive of (MSNBC) or opposed to (Fox) marijuana legalization. The Food Network articles discussed how to save money while grocery shopping, tips for buying meat, and how grocery stores might change in the future.
Preference-Incorporating Choice and Assignment (PICA) Experimental Design

The PICA design builds upon the general framework known in the medical literature as the patient preference trial (PPT). As noted, some existing political science research employs PPT frameworks, incorporating participants’ preferences over treatment options (Torgerson and Sibbald Reference Torgerson and Sibbald1998) to examine the effects of experimental treatments that may vary depending on those preferences (Gaines and Kuklinski Reference Gaines and Kuklinski2011; Leeper Reference Leeper2017). This step makes it possible to avoid relying on self-reported ideology to identify people’s media preferences. Unlike these existing proposals, however, our design also incorporates the stated preferences over treatment options for all respondents, enabling us to combine information from the forced exposure and the free choice arms for more nuanced inference. The PICA design thus unifies key elements from Arceneaux and Johnson’s two designs as well as the previous two-arm PPT designs.
The overall advantage of the PICA design is therefore twofold. First, the randomization of participants into either the forced exposure or the free choice conditions enables us to draw inferences about the persuasion effects of pro-attitudinal and counter-attitudinal political news among participants who if given a choice would consume those media, as well as among those who would choose nonpolitical media. It also allows us to distinguish between consumers of liberal and conservative partisan media, rather than combining these two groups and estimating the combined net effects of pro- and counter-attitudinal consumption (as Arceneaux and Johnson Reference Arceneaux and Johnson2013 do). Second, unlike previous studies, our design measures both stated media preferences and actual selective exposure to the media options. For subjects who are assigned to the free choice condition, we can empirically measure any discrepancy between their stated and actual media preferences. This allows us to undertake sensitivity analyses for the estimated persuasion effect of particular media among subjects who prefer particular partisan news and those who prefer non-political media.Footnote 5
We administered the experiment via an Internet-based survey to a national sample of 7,298 respondents through Survey Sampling International (SSI).Footnote 6 This large sample allows us sufficient power to detect the persuasive effects of media among different groups. We follow the protocol proposed in Knox et al. (Reference Knox, Yamamoto, Baum and Berinsky2019) and summarized in Figure 1. First, early in the survey we measure the stated preference of all respondents over the three options. Specifically, we asked: “If you were given the choice of news articles from the following three sources to read, which of the three would you choose?” We presented each choice with an accompanying logo of the network, while randomizing the order in which the options appeared on the screen.
This choice environment is obviously not entirely realistic. The Internet provides access to thousands of different news sources, and, in fact, the average American visits 89 different web domains a month (Nielsen 2010). But to make the experiment tractable and to gain some control over the content of the programs, it was necessary to conduct it in a stylized environment.Footnote 7 Doing so could, admittedly, introduce external validity concerns, as people’s preferences may exhibit more consistency in our experiment than in reality. People’s preference for partisan news rather than an entertainment option may change if there are more entertainment options. But our sensitivity analyses, which identify the extent to which estimates of partisan media persuasion could be affected by discrepancies between the stated and actual preferences, can partially mitigate such concerns by providing conservative estimates of media persuasion.Footnote 8
We then move to a “washout” period, where we asked participants to answer demographic questions not directly related to the media choice, and to complete distraction tasks. The goal was to minimize the possibility that measuring stated preferences might contaminate respondents’ voluntary choices of stories to read in the free choice condition. These distraction tasks enhance external validity by allowing for the instability of preferences over time.
Next, we randomized subjects with equal probability into the forced exposure and free choice conditions. We then randomly assigned those in the forced choice arm to read either the Fox News, MSNBC, or entertainment story, each with probability 1/3. For those in the free choice arm, we instead asked, “Which of these three articles would you like to read now?” We presented these participants with the same three options. Subjects in the free choice arm then read the single story they chose. Finally, we asked a series of questions measuring subjects’ opinions about, as well as their desire to share or learn more about, marijuana policy, as described in more detail in Results section below.
METHODOLOGY
We estimate the degree of persuasion using the average choice-specific treatment effect (ACTE) of the media stories, following Knox et al. (Reference Knox, Yamamoto, Baum and Berinsky2019).Footnote 9 In the current study, the ACTEs of interest constitute the average effects of exposure to one story relative to another among those who would prefer to read Fox News, MSNBC, or the entertainment article. We focus here on the difference between the two partisan outlets, which most directly estimates the degree of political polarization due to biased partisan media, and in particular the effect of these specific articles on opinions about marijuana legalization.Footnote 10 The relationships we report below thus represent the causal effects of treating individuals with Fox News as opposed to MSNBC, within each choice-specific group.
We take two approaches for the inferences about our ACTEs of interest. First, we use the stated media preferences that we measure at the beginning of the experiment as an approximate measure of actual media choices and estimate the “naïve” ACTEs as the difference between the average opinions among subjects assigned to Fox News and the average among subjects assigned to MSNBC within the forced exposure condition.Footnote 11 However, our design also allows us to go beyond this naïve estimate. In particular, our two-arm PICA design allows us to use additional information from subjects assigned to the free choice condition to conduct sensitivity analyses via the nonparametric bounds proposed by Knox et al. (Reference Knox, Yamamoto, Baum and Berinsky2019) and estimate the degree to which the divergence of stated and actual media preferences can bias our naïve estimates of the ACTEs.
Conceptually, these sensitivity analyses involve two steps. First, we can assume the extreme (and unlikely) scenario where respondents whose actual media choices differed from their stated choices could hold any opinion about the issue. Under this agnostic assumption, we can calculate the maximum and minimum possible values of the ACTEs for each of the outcome measures. The resulting values represent our “no-assumption” upper and lower bounds for the possible true value of the ACTE, that is, the interval within which we can be confident that the ACTE lies. In the second step, we explore a more plausible “middle ground” by modifying the agnostic assumption to fit a more realistic scenario. We continue to assume that there is a discrepancy between the stated and actual choice groups in their response to a treatment, but we hypothesize the size of the discrepancy to be less than a certain threshold. Following Knox et al. (Reference Knox, Yamamoto, Baum and Berinsky2019), we call this hypothesized upper bound on the discrepancy the sensitivity parameter and denote it by ρ.Footnote 12 We then derive the bounds on the ACTE using a procedure similar to the first step for varying levels of the sensitivity parameter. These bounds represent the largest and the smallest that our treatment effect estimates could be, under the restrictions imposed by a given level of ρ. Finally, we assess the threshold value of ρ at which the bounds contain zero and cease to be informative about the sign of the ACTE. A high value of this threshold ρ value would imply that our conclusion based on the naïve estimate is robust to the possible bias resulting from a relatively large discrepancy between the stated and actual choices.
RESULTS
We first examine evidence for selective exposure by focusing on subjects assigned to the free choice condition (i.e., the bottom portion of Figure 1) and analyzing their revealed media preferences and reported opinions. Our results indicate that polarization in the electorate does indeed correspond with polarization in media consumption. Across all categories of partisanship, 30% of people chose to read the Food Network article, 41% chose Fox News, and 28% chose MSNBC. However, these choices varied significantly when we looked at this same breakdown by party. Among Democrats, 31% preferred the entertainment option, 24% preferred Fox News, and 45% preferred MSNBC. Among Republicans, 28% preferred entertainment, 61% Fox News, and only 12% MSNBC. Among those with no preference for either party, 42% preferred entertainment, 34% Fox News, and 23% MSNBC.Footnote 13 These results demonstrate a strong separation in choices between the ideological left and right: Democrats were 33 percentage points more likely than Republicans to prefer left-leaning MSNBC, while Republicans were 37 percentage points more likely than Democrats to prefer right-leaning Fox News.Footnote 14
Polarization by Selective Exposure
We also find that selective exposure corresponds with differences in political opinions and behaviors. To measure political opinions, we asked respondents ten questions about marijuana and drug policy. We asked them whether they agreed or disagreed with the following statements, “The legalization of marijuana leads to fewer people using more serious drugs, such as heroin and cocaine” and “Marijuana use increases violent crime,” corresponding to the articles about public safety and health consequences of legalization. Similarly, we asked respondents whether legalization would make the economy better or worse, which corresponded directly to the interventions about the tax and economic implications of legalization.Footnote 15 Other questions addressed feelings regarding marijuana more broadly. Respondents placed themselves on 7-point scales between strongly agreeing or strongly disagreeing with the phrases: “Government efforts to enforce marijuana laws cost more than they are worth,” “Using marijuana is morally wrong,” “Marijuana should be legal for medical use,” “Marijuana use is a serious problem today,” and “Marijuana should be legal for recreational use.” Finally, respondents placed themselves along another seven-point scale between, at one end, whether habitual drug use should be thought of as a criminal offense or, at the other, a medical problem.Footnote 16 They then placed several substances, including marijuana, on scales from very dangerous to very safe. We recode all opinion variables to 0–1 intervals, with the most liberal or permissive of legalization at 0 and the most conservative or opposing of legalization at 1. To capture variation in the underlying latent attitudes and beliefs about marijuana, we form an additive index of these ten opinion questions. We use this index as the primary dependent variable on which we assess polarization and persuasion.Footnote 17
We also asked respondents to indicate their likelihood of forwarding, discussing, posting to social media, or seeking out additional information on the story they had just read. We combined these four measures into an additive index of sharing behavior, which ranges from 0 (least likely to share) to 1 (most likely to share).
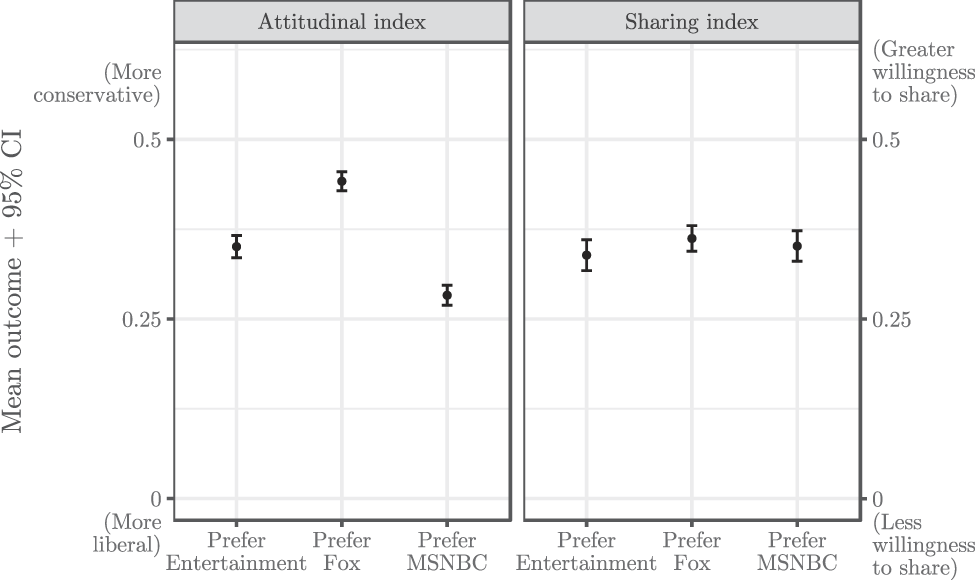
Political opinions and behavior differed across the three groups of respondents who self-selected into different media options. Figure 2 shows the average responses among the respondents assigned to the free choice arm (i.e., the bottom portion of Figure 1), separated along the x-axis by media preference group.Footnote 18 We plot our attitudinal and sharing indexes in the left- and right-hand panels, respectively. On the left side of each panel, we show the responses among those who preferred to (and did) read the entertainment article. People who both preferred and chose Fox News (in the middle of each panel) reported opinions that were 0.16 greater along the 0–1 scale of our attitudinal index than those who both preferred and chose MSNBC (on the right of each panel). This difference is equivalent to 0.72 standard deviations for this outcome measure. On our sharing index, those who preferred and read Fox reported intended behaviors that were 0.01 greater than those who preferred and read MSNBC—a substantively and statistically insignificant difference. Together these free-choice results show that people who consume different media report different political attitudes but similar behaviors.
Average Responses in Free Choice Condition
Points indicate mean responses for each outcome variable and 95% confidence intervals within each stated preference subgroup. Outcome variables are recoded to the unit scale with more conservative opinions in the positive direction and more liberal opinions in the negative direction for the attitudinal index, and with higher reported willingness to share stories in the positive direction and lower willingness to share stories in the negative direction for the sharing index.

Partisan Media’s Persuasive Effects
The pattern described above reflects only the descriptive differences between groups of respondents who self-selected into each media treatment. This conflates self-selection and persuasion and cannot be interpreted as polarization necessarily caused by partisan media sources.
The forced choice arm of our experiment (the top portion of Figure 1)—where we randomly assign respondents to partisan media or entertainment—accounts for the persuasive effect of media exposure. To measure changes in political opinions, we disaggregate these respondents by the type of media that they would choose if given a choice.Footnote 19 The results demonstrate substantial added explanatory value over simpler comparisons more commonly employed in the literature, such as that between partisan groups.Footnote 20 Here, we present our treatment effects on the aforementioned 10-question additive index, to assess the effect of forced exposure to Fox News rather than MSNBC.Footnote 21
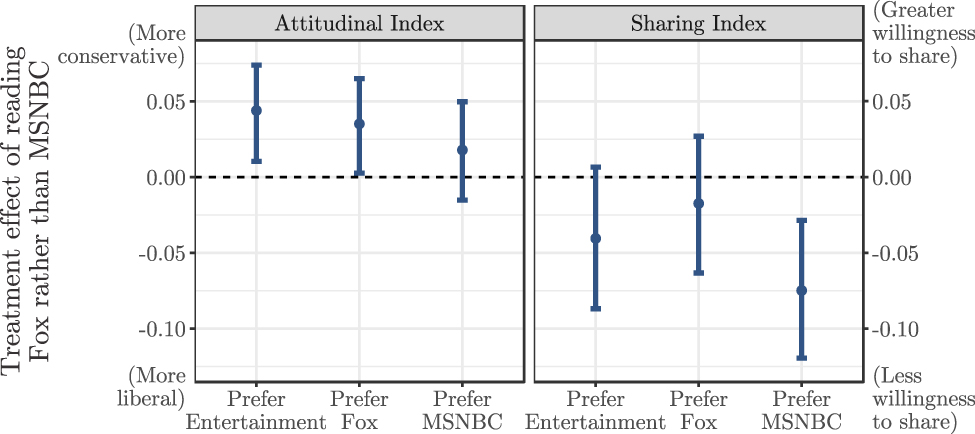
Partisan media have a strong impact on respondents’ opinions in the forced-choice arm. In Figure 3, we show the estimated effects of treating respondents with Fox News rather than MSNBC, conditional on media consumption preferences, and based solely on the respondents assigned to the forced choice condition and their stated media preference.Footnote 22 The left-hand panel plots the treatment effects with 95% confidence intervals for our attitudinal index along the y-axis, separated by media preferences along the x-axis. Effects above zero represent persuasion in the conservative direction on the 10-attitude-question index, while effects below zero represent persuasion in the liberal direction.
ACTE Estimates Based on Stated Media Preferences
Points indicate treatment effects of watching Fox rather than MSNBC, which are estimated as the difference in means between these two groups in the forced exposure arm of the experiment.

Among respondents who would prefer to read entertainment rather than news—shown on the left sides of both panels in Figure 3—reading Fox instead of MSNBC yields statistically significant movement in the conservative direction on the attitudinal index. Along the 0–1 scale, reading Fox causes these entertainment-preferring respondents to report opinions that are four percentage points more conservative than if they had read MSNBC. This demonstrates the substantively large persuasive effects that partisan media may have on attitudes of those who would not ordinarily consume these news sources.
Among respondents who would choose Fox if given the choice—plotted in the center sections of both panels—the persuasive effect is similar to that for entertainment consumers. Respondents who prefer Fox reported opinions that are three and a half percentage points more conservative (on the 0 to 1 scale) if they read Fox than if they read MSNBC. This effect is statistically significant. So, exposure to more partisan news can sway the opinions of even those respondents who are already exposed to some degree of partisan news.
Among respondents who prefer MSNBC—plotted as the rightmost line within each of the panels in Figure 3—the persuasive effect of reading Fox rather than MSNBC was similar (in a conservative direction) but smaller and statistically insignificant.
Together, these results show that partisan news is persuasive, albeit not for all consumers. In other words, partisan media can move the attitudes of respondents exposed to a given message—both those who choose it and those who would ordinarily not consume political news—in the direction the message advocated. The effects were most consistent among those who preferred entertainment. Among these readers, we found effects in the expected direction for every individual attitudinal question as well as a statistically significant effect on the aggregate index. Among readers who preferred Fox News the effects remained fairly strong and were also statistically significant for our attitudinal index. Finally, for those who preferred MSNBC the effects remained in the expected direction but were somewhat smaller in magnitude and statistically insignificant.
We also found that partisan news has different effects across different subgroups of readers. That is, the media preferences of individuals condition the media’s persuasive effects. For individuals who preferred entertainment, partisan media powerfully polarized attitudes. Contingent on exposure, these individuals appear to be most subject to influence by partisan media. However, we also found persuasion among respondents who prefer partisan news. This suggests that partisan media can be persuasive, though perhaps less so because the opinions of their consumers tend to be more solidified and so more resistant to persuasion.
The right-hand panel of Figure 3 turns from attitudes to behavior, by presenting the treatment effects on our sharing index, with positive effects representing a greater intent to share the news story. Across all subgroups, reading Fox News rather than MSNBC had a negative effect on sharing. Respondents were more likely to report a willingness to share the articles after reading MSNBC than after reading Fox News. Reading the Fox News article instead of the MSNBC story reduced respondents’ reported willingness to engage in sharing behaviors by between 0.02 and 0.07 along the unit scale for our three subgroups of media consumers. This effect was statistically significant for readers that preferred MSNBC, but not for those that preferred entertainment or Fox News. This indicates that, among those people who preferred MSNBC, exposure to pro-attitudinal media increased their propensity to share its content relative to exposure to counter-attitudinal media.
Overall, the persuasive effect of partisan media is strong across a number of political outcome variables. While other research has suggested that partisan media can induce a backlash among individuals who hold opposing preferences, we find that even counter-attitudinal partisan media can be persuasive. Moreover, such effects are not limited to attitudes. They also appear to affect socially significant political behaviors, such as sharing content. Those who preferred either MSNBC or entertainment media were more likely to report an intent to share content after actually consuming MSNBC than after actually consuming Fox News. Our experimental procedure enables us to detect where these persuasive effects occur across different groups of media consumers.Footnote 23
Polarization from Both Selective Exposure and Persuasion
The results thus far do not directly tell us how the persuasive effects of partisan media might bring the attitudes of their consumers closer together in the real world. To put these results in context, we leverage evidence from both the forced exposure and the free choice conditions of our PICA design and simulate how our estimated persuasion effects might change the existing levels of partisan polarization. As a baseline for “real-world” levels of the existing polarization, we first use responses from subjects in the free choice condition to measure the existing differences in opinions between the groups that chose opposing partisan media. Then, using the ACTE estimates obtained from the same media-preference group in the forced choice condition, we see whether a certain amount of “treatment” might at least partially bridge (or widen) these gaps—that is, by hypothetically forcing those individuals to consume opposing media. Specifically, our multi-arm design allows us a window into this hypothetical world by comparing the existing attitude polarization to the situation where we expose individuals to the persuasive power of media from the other side.
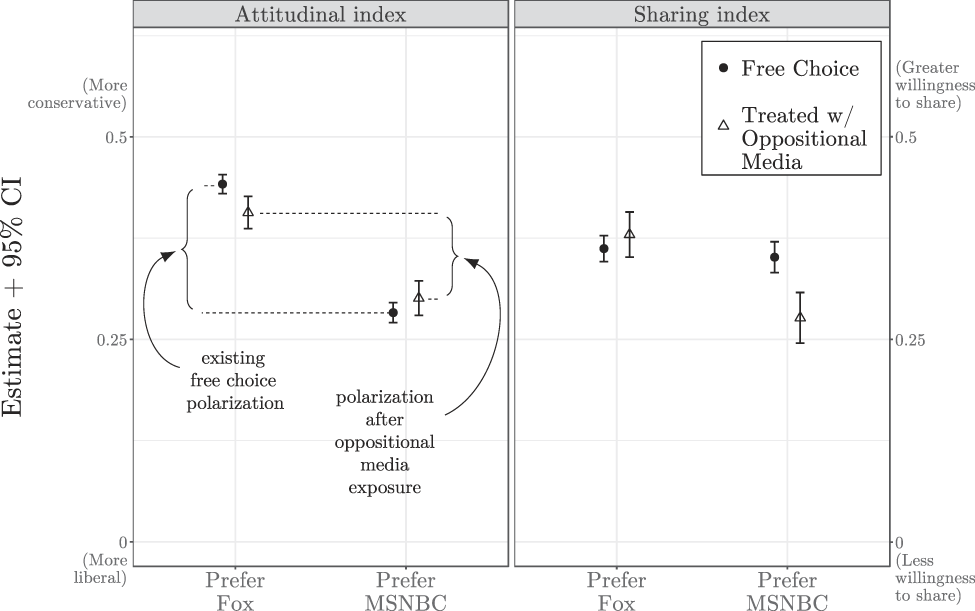
Figure 4 presents the gaps in opinion between subgroups in the free-choice arm of our experiment along with the estimates of their opinions had we instead treated them with counter-attitudinal media. We plot the point estimates and corresponding confidence intervals for respondents who read their freely chosen media with filled black circles, and estimates of their opinions if treated with the opposing media with open triangles. We again present the attitudinal and sharing indexes in the left- and right-hand panels, respectively, and separate the subgroups of media consumers along the x-axis.
The Effect of Opposing Media Treatment on Polarization
Points indicate mean responses for both outcome variables and 95% confidence intervals within stated preference subgroups. Closed circles indicate subgroup estimates in the free choice arm of our experiment, while open triangles indicate estimates of the outcome after treatment effects from the forced choice arm of the experiment are applied to free choice estimates.

Our experiment indicates that forcing people to read news from the “other side” generally moderates the opinions of partisan media consumers, thereby reducing polarization. On our attitudinal index, treatment from opposing media reduced the opinion gap between respondents who preferred Fox versus MSNBC. We can apply the statistically significant treatment effect of 0.035 among those who prefer Fox News and the smaller and insignificant effect of 0.018 among those who prefer MSNBC to the average outcomes among those two groups in the free-choice arm. Treating respondents that prefer Fox News with the MSNBC article and vice versa would reduce the opinion gap in the free choice arm by about one third—from 0.16 to 0.10 (along the 0–1 scale). This reduction is statistically significant, with a 95% confidence interval of 0.019 to 0.087.Footnote 24 Applying the treatment effects of oppositional media estimated in the forced-choice arm reduces the existing polarization between the opinions of partisan media consumers in the free-choice arm of our experiment.
Our experiment also yields evidence that consuming counter-attitudinal media may polarize consumers’ subsequent behavior. While partisan media consumers may moderate their opinions when exposed to media from across the partisan aisle, they appear to respond differently in their sharing behavior. Among people who prefer Fox, exposure to MSNBC made them no more or less likely to share news content than those who chose Fox News. However, among those who preferred MSNBC, exposure to Fox News reduced their willingness to share news content. This means that, were both groups exposed to content from across the aisle, the subsequent sharing of this media would be higher among those who prefer Fox—leading to potential counter-attitudinal consumption of this content by other people in their lives—relative to those who prefer MSNBC. This demonstrates that the immediate short-term behavioral effects of counter-attitudinal partisan media that we find may lead to even larger net effects were they to occur in a situation allowing for content sharing among people’s friends and family. Moreover, the potential for these reinforcing effects may be asymmetrical, primarily affecting those people who prefer MSNBC rather than Fox.
Polarization Among the Inadvertently Exposed
Perhaps the most worrisome effects of partisan media may befall those who would not choose to consume these stories. These inadvertent consumers—the group of citizens who otherwise would prefer entertainment—may change their opinions as a result of chance encounters with partisan media. This could have pernicious consequences for political polarization as partisan media become increasingly prevalent. To show how exposing these individuals to partisan media would change their opinions, we again use both the forced exposure and free choice conditions to assess how our estimated persuasion effects change the existing opinions. We first measure the baseline of opinions among those who prefer entertainment in the free choice group. We then use our ACTE estimates obtained from the forced choice group to simulate how these opinions would change after “treatment”—that is, by hypothetically exposing entertainment-preferring individuals to partisan media rather than entertainment. As with the groups who preferred partisan media, our experiment allows us to compare their existing opinions with the scenario in which we expose them to partisan media.
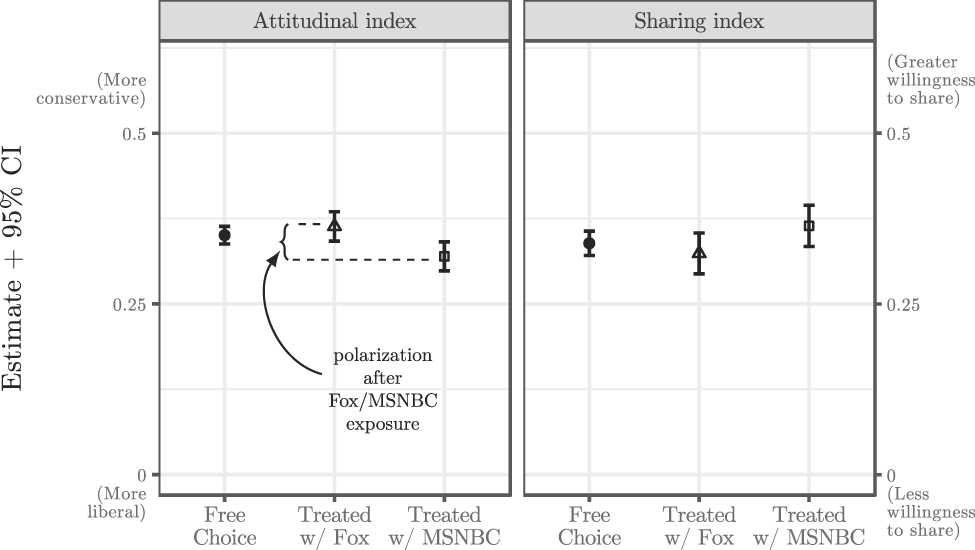
Figure 5 presents opinions among those who prefer entertainment in the free-choice arm of our experiment along with the estimates of their opinions had we instead treated them with partisan media. We plot with filled black circles the point estimates and corresponding confidence intervals for respondents who read their freely chosen entertainment story, while plotting with open triangles and open squares the estimates of their opinions if treated with Fox News and MSNBC, respectively. We again present the attitudinal and sharing indexes in the left- and right-hand panels, respectively.
The Effect of Media Treatment on Entertainment-Readers
Points indicate mean responses and 95% confidence intervals. Closed circles indicate subgroup estimates in the free choice arm of our experiment after respondents who stated a preference for entertainment watched entertainment. Open triangles indicate estimates of the outcome after the treatment effect of Fox rather than entertainment from the forced choice arm of the experiment is applied to free choice estimates, and open rectangles indicate similar estimates of the free choice outcome after the treatment effect of MSNBC rather than entertainment is applied.

We find that, among inadvertent readers, partisan media can substantially polarize political opinions, driving readers in opposite directions. On our attitudinal index, people who preferred to read entertainment and did so had a mean response of 0.35 along the 0–1 scale in the free choice arm. Applying the treatment effect from the forced choice experiment—equivalent to exposing them to Fox News rather than entertainment—their estimated response would instead be a more conservative 0.36 on average, while if we apply the treatment effect of MSNBC, their estimated response would be 0.32. This resulting opinion gap of 0.04, as plotted in the left panel of Figure 5 with the open triangle and open square, is statistically significant (with a 95% confidence interval of 0.014 to 0.074). In substantive terms, this level of polarization is approximately one-third of the existing polarization on this index between respondents preferring MSNBC versus Fox in the free choice arm. This demonstrates the polarizing power of just one instance of exposure to partisan media among this segment of the population.
Partisan media may also affect the behavior of these inadvertent partisan media readers. In the right panel of Figure 5, we plot the estimated response on our sharing index among people who prefer entertainment and select it in the free choice arm, as well as their estimated responses if they instead read Fox News or MSNBC. In the free choice arm, these respondents had an average response of 0.34. Had they read MSNBC rather than entertainment, however, they would be even more likely to share the story they read, with an estimated response of 0.36. On the other hand, had they read Fox, they would be less likely to share the story, with an estimated response of 0.32. This estimated gap in sharing behavior of 0.04 (95% confidence interval: −0.002, 0.083) demonstrates how the effect of partisan news may change the way that people who prefer entertainment engage with or share the partisan news media that they encounter.
SENSITIVITY ANALYSES
As previously discussed, the ACTE estimates we have presented thus far rely on the rather strong assumption that the discrepancy between participants’ stated preferences over media options and their actual media choice is “ignorable;” that is, unsystematic and unrelated to the way they react to different news media. In this section, we present results of our sensitivity analysis, which relaxes this assumption and assesses how much these estimates of choice-specific persuasion are susceptible to the violation of the assumption that people’s reported media preferences match their behavior when choosing media. This analysis requires information from both the forced exposure and the free choice conditions, so our PICA design is essential for assessing such a problem.
The results from the free-choice condition of our experiment show that those subjects who state a preference for a given media option do not always choose that option when given the chance to do so.Footnote 25 Thanks to random assignment, we know that in expectation the same proportion of those subjects in the forced-exposure condition would have deviated from their stated media preferences if they had been allowed to do so, contrary to our “naïve” assumption. Thus, we begin our sensitivity analysis by asking what values the ACTEs could take if we removed that assumption. That is, if we made no assumption about the opinion measures and sharing index for those subjects whose stated and actual media preferences would differ, what could we still conclude about the ACTEs?
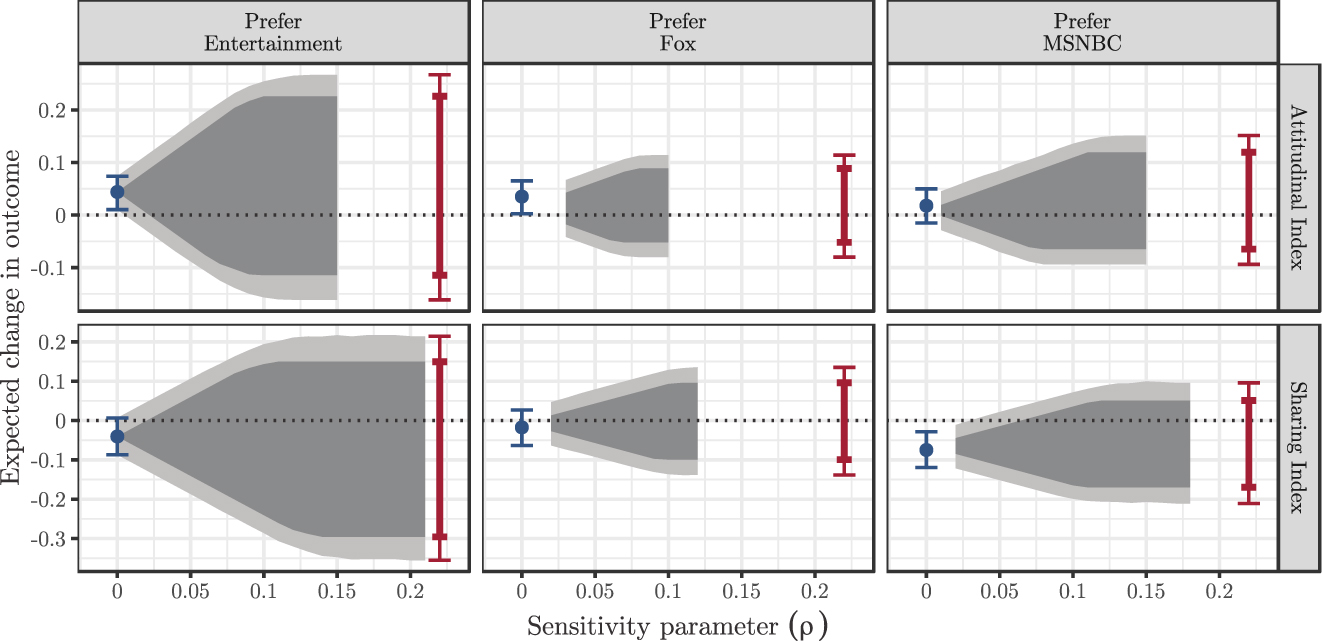
We answer this question by calculating the nonparametric bounds on the ACTEs for each dependent variable. In Figure 6, we present the resulting bounds on the far right-hand side of each panel (thick lines) along with their 95% confidence intervals (thin lines). The top and bottom rows report results for our attitudinal and sharing indexes, respectively, while each column disaggregates respondents by their media preferences. These bounds represent a “worst-case” scenario, in that they present the effect of reading a given article when we assume that responses under stated preferences are entirely uninformative of responses under actual preferences. The estimated bounds suggest that this extreme assumption renders all of our persuasion effects statistically insignificant.
Sensitivity Analyses
Points and 95% confidence intervals on the left of each panel reproduce naïve treatment effects, with values in the positive direction indicating opinion change in the conservative direction on the attitudinal index (top row) and greater willingness to share the media content on the sharing index (bottom row). Lines on the right of each panel represent the no-assumption bounds (thick lines) and 95% confidence intervals for those bounds (thin lines). Gray areas indicate the bounds for varying levels of ρ (dark gray) and 95% confidence intervals for those bounds (light gray).

Although these widest bounds represent our most assumption-free estimates, they are also almost certainly too conservative. After all, it is unrealistic to expect that opinions of those individuals who state a preference for (say) Fox News are completely unrelated to the opinions of those who prefer to actually read Fox News. Thus, the next step in our sensitivity analysis is to allow those two groups to have different opinions not arbitrarily but only to a certain degree, which we specify via the sensitivity parameter ρ. That is, if the difference in the average opinions between the stated-preference groups and the actual-choice groups were at most ρ, what can we conclude about the possible values of the ACTEs?
In Figure 6, we also plot the sensitivity bounds for the ACTEs (in dark gray) and corresponding confidence intervals (in light gray) for the summary index of our attitudinal measures (in the top row) and the behavioral index (in the bottom row) as we change the sensitivity parameter ρ between 0 and the value at which it converges with the no-assumption bounds, moving along the x-axis of each panel. As ρ approaches zero, the bounds become tighter (because we allow less divergence of opinions between the stated-preference and actual-choice groups) and eventually collapse to the naïve estimates (on the left). On the right, all the sensitivity bounds coincide with the no-assumption bounds. Our primary interest is in the value on the x-axis at which each effect’s bounds cross zero, which is the value of ρ at which our estimated effect ceases to be informative about the true sign of the ACTE.
We focus first on the statistically significant naïve estimates for the attitudinal index, in the top row of the figure, beginning with those who prefer entertainment (left panel). For this index, the value of ρ at which our bounds around the treatment effect cross zero is estimated to be 0.02. This implies that among people who prefer entertainment, in order to have zero estimated effect of reading Fox News rather than MSNBC, the deviation in the measure between stated-preference groups and actual-choice groups would have to be just below half the size of our naïve estimate of 0.04. After incorporating statistical uncertainty into the estimation of these bounds, however, the estimates appear less robust to the discrepancy in the stated and actual preferences: The 95% confidence intervals for the bounds include zero as soon as we allow for a deviation of 0.01 in the average opinions between the stated-preference and actual-choice groups—one quarter the size of our estimated treatment effect. Among those respondents who prefer Fox, for whom we observed a statistically significant treatment effect on the attitudinal index of 0.04, we also observe similar results, with the lower bound of the treatment effect on this measure growing to include zero given a small violation of our assumption about the discrepancy between the stated and actual preferences, making our estimate uninformative about the true direction of the effect.
For our behavioral measure—whether or not respondents would share or discuss with others the news story they read, shown in the bottom row of Figure 6, larger deviations from the naïve assumption are necessary to negate our significant negative estimates of the ACTEs for the respondents who prefer MSNBC. Among these respondents, the upper bound on our treatment effect remains negative until ρ reaches 0.06—nearly equivalent to the size of our treatment effect—and even the 95% confidence interval does not contain zero until ρ is 0.03.
Taken together, these sensitivity analyses indicate that our evidence of media persuasion effects depends on assumptions of relatively modest deviations between stated preferences and actual media choices. When we allow for larger deviations between the opinions of the stated-preference and actual-choice groups, the lower bounds of our estimated persuasive effects of partisan media on attitudes become negative even for the group of people who state a preference for entertainment. This means that we can no longer entirely exclude the possibility that these effects are actually below zero under those scenarios. The estimated levels of sensitivity further increase when we incorporate statistical uncertainty into our analysis. Our estimated effects on intended behavior are robust to relatively larger violations of this assumption.
Thus, we cautiously conclude that our findings are robust to reasonable—but not large—violations of the assumption that the discrepancy between the stated and actual media preferences is ignorable.Footnote 26 But more broadly, our analysis highlights the importance of accounting for the potential deviation between stated preferences and actual behavior in any experimental paradigm aimed at accurately estimating attitudinal change.
CONCLUSION
The explosion of consumer choice over the past several decades and with it the resurgence of an American partisan press, combined with a parallel rise in partisan polarization, has deepened scholarly interest in learning how media influence public opinion. Understanding the role of partisan media is particularly important when building coalitions across partisan and ideological lines seems ever more elusive and citizens increasingly question the capacity of our leaders to overcome partisan polarization.
In contrast to previous research, we demonstrate a strong persuasive impact of partisan media on political attitudes with data collected through our PICA design. While other studies have shown that counter-attitudinal information is unlikely to persuade people, and may even produce backlash effects (e.g., Nyhan and Reifler Reference Nyhan and Reifler2010), we show that both pro- and counter-attitudinal partisan media can, in fact, change people’s opinions in the direction of the partisan media’s message. This fits with a growing body of research showing limited backlash to opposing information (e.g., Guess and Coppock Reference Guess and Coppock2018; Wood and Porter Reference Wood and Porter2019).
Our results indicate that political polarization is not simply a function of selective exposure. To be sure, selective exposure is a real phenomenon—people do prefer media that supports their preexisting attitudes, and those who consume opposing media have polarized political opinions, which we confirm using the free choice arm of our experiment. Yet, this does not preclude partisan media from having a strong polarizing effect as well. In the case of marijuana policy—and on three additional policy areas presented in Online Appendix EFootnote 27—our results show a strong impact of partisan news on the people who read it—not just among those who would ordinarily choose to read these sources, but also among people who prefer apolitical entertainment news. Indeed, partisan media may have the greatest potential to polarize attitudes among the large segment of people who prefer not to consume partisan news at all. For these consumers, a single exposure to partisan media from one ideological perspective can create polarization in attitudes equivalent to approximately one-third of the polarization that exists between self-selected partisan news consumers on opposite sides of the aisle. Thus, while the consequences are minor if these people maintain an entertainment-only media diet, if they deviate from such content or are inadvertently exposed to partisan media from one side or the other, their attitudes may change—and by a substantively large amount.
We also find evidence that partisan news can further change the opinions of people who would already self-select into these partisan news silos, exacerbating polarization. Yet, this result also indicates that partisan news media can reduce polarization via exposure to counter-attitudinal media sources among those who would ordinarily choose to consume pro-attitudinal partisan media. Persuasion by oppositional partisan media can help bridge the gap in opinions between groups of consumers. Moreover, the power of partisan media is not limited to opinions, but extends to socially and politically consequential behaviors, as measured by our sharing index. People—particularly those who would prefer to consume MSNBC—are more likely to spread pro- than counter-attitudinal partisan news stories to other people. This result suggests that biases may arise in the interpersonal flow of information. Though endorsements from social connections and other characteristics of specific media content may ameliorate this tendency (e.g., Messing and Westwood Reference Messing and Westwood2014; Mummolo Reference Mummolo2016), it may still lead to increasingly homogenous information received via other people (cf. Brundidge Reference Brundidge2010). Understanding how media consumption affects these types of behavior is especially important given the growing prevalence of online social media as vehicles for information sharing.
We also leveraged our PICA design to bound these persuasion estimates based on the instability between self-reported media consumption preferences and observed behavior. The bounds generated through our sensitivity analyses demonstrate how easily persuasion effects may disappear if assumptions about the stated preferences are not true. These sensitivity analyses illustrate the importance of assessing the treatment effects of partisan media for individuals making real-world choices among media options. Indeed, our experimental findings might look different “in the wild” with violations of our assumption about stated preferences and actual media choices. Further research on persuasion that incorporates real-world behavior along with stated preferences on surveys can better uncover the true effects of media without relying on such assumptions.
Taken together, these results suggest a more nuanced story regarding the effects of ideological media than scholars have previously recognized. Though many people do disproportionately choose to consume news from their own side of the ideological spectrum, many others—both partisans and independents—prefer entertainment over partisan news. Partisan news can be persuasive to these individuals. Separately estimating these effects for people with different media-viewing preferences can help detect important heterogeneity in the effects of partisan media (e.g., Gaines and Kuklinski Reference Gaines and Kuklinski2011; Leeper Reference Leeper2017). We demonstrate that reading partisan news on a politically salient topic can change people’s opinions, as well as their actions, to different degrees depending on their media preferences. Indeed, contrary to the “minimal effects” hypothesis, among the segment of the population who mostly prefers entertainment media, we find strong evidence of attitudinal persuasion.
If, as our findings suggest, partisan news can affect both attitudes and actions, then there is cause for concern. Some people may indeed choose to separate their media consumption patterns according to their ideology, but ironically it is the people who opt for largely apolitical stories who are most vulnerable to the persuasive effects of slanted news. When these individuals consume partisan media content, their opinions can change.
Our findings on the persuasiveness of ideological media are one piece of a puzzle and raise other questions about the broader implications of partisan media. For instance, more research on the persistence of these persuasive effects, or the aggregate effect of repeated treatments in a media-rich environment, could give us some indication of how they will affect politics writ large. Furthermore, estimating how interactions with political media affect subsequent choices among media options could potentially prove an important factor in assessing the total persuasive effect of partisan media. While ideologically slanted media may increase polarization among its natural consumers, our results suggest that it is the large number of relatively apolitical individuals, rather than the much smaller number of regular consumers of these news sources, who are most susceptible to such polarization effects. Indeed, this last finding suggests a powerful incentive for political entrepreneurs to seek out these entertainment-seekers and deliver such slanted political messages directly to them via social network feeds, native ads, or other means not requiring an individual’s choice to consume partisan news. Assessing the extent to which they are able to successfully target these individuals and expose them to partisan news remains a fruitful avenue for future research.
SUPPLEMENTARY MATERIAL
To view supplementary material for this article, please visit https://doi.org/10.1017/S0003055419000418.
Replication materials can be found on Dataverse at: https://doi.org/10.7910/DVN/MM2VWC.




Comments
No Comments have been published for this article.