





Schizophrenia remains one of the leading causes of disability worldwide, with a lifetime prevalence of 0.7%. Reference He, Liu, Li, Guo, Gao and Bai1,Reference Vos, Abajobir, Abate, Abbafati, Abbas and Abd-Allah2 The disorder manifests as a complex interplay of positive symptoms (e.g. delusions, hallucinations), negative symptoms (e.g. blunted affect, avolition) and cognitive symptoms (e.g. impaired working memory and attention). Reference McCutcheon, Reis Marques and Howes3 Antipsychotic medications are the primary treatment for schizophrenia, and are highly effective for positive symptoms for many individuals. Reference Lyman and McCutcheon4 Negative and cognitive symptoms, however, frequently persist and continue to impair social and occupational functioning. Reference McCutcheon, Keefe and McGuire5,Reference Nucifora, Woznica, Lee, Cascella and Sawa6 The mechanisms underlying both therapeutic response and residual symptoms remain poorly understood, limiting progress toward more effective interventions. Reference Kaar, Natesan, McCutcheon and Howes7
Network analysis
Network theory offers a complementary framework for understanding schizophrenia by conceptualising symptoms as dynamically interacting components rather than as isolated manifestations of an underlying disease. Reference Borsboom8,Reference Borsboom and Cramer9 In this model, symptoms are represented as nodes in a network, and their statistical associations as edges connecting them. The strength and configuration of these connections can reveal how symptoms influence one another, cluster into communities or propagate across the network. High overall connectivity may reflect self-sustaining pathological loops, Reference Borsboom8,Reference Cramer, Van Borkulo, Giltay, Van Der Maas, Kendler and Scheffer10 whereas central symptoms – those exerting strong influence on others – may represent potential targets for intervention. Reference Bringmann, Elmer, Epskamp, Krause, Schoch and Wichers11,Reference Buchwald, Narayanan, Siegert, Vignes, Arrowsmith and Sandham12
Recent studies applying network analysis to schizophrenia have shown that antipsychotic treatment alters static network structure, identifying specific symptoms such as avolition, excitement and poor rapport as key treatment-sensitive nodes. Reference Strauss, Zamani Esfahlani, Sayama, Kirkpatrick, Opler and Saoud13,Reference Sun, Zhang, Lu, Yan, Guo and Liao14 Furthermore, antipsychotics have been shown to reduce overall network connectivity after 6 weeks of treatment in treatment-responsive patients relative to treatment-resistant individuals. Reference Sun, Zhang, Lu, Yan, Guo and Liao14 These previous studies, however, have relied on cross-sectional correlational networks. These are based on between individual static associations, and cannot reveal temporal dynamics or potential causal pathways between symptoms. Reference Briganti, Scutari, Epskamp, Borsboom, Hoekstra and Golino15 Temporal network approaches, such as panel graphical vector autoregression (GVAR) models, address this limitation by modelling symptom interactions across time, providing insight into how one symptom predicts subsequent changes in another. Reference Hoffart, Skjerdingstad, Freichel, Mansueto, Johnson and Epskamp16
Study aims
In this study, we applied temporal network modelling to pooled data from 8 randomised controlled trials of paliperidone, encompassing 2508 patients with schizophrenia, assessed over 6 weeks. Our objective was to examine how antipsychotic treatment modulates the dynamic structure of symptom networks compared with placebo. We hypothesised that antipsychotic treatment would reduce overall network connectivity reflecting a disruption of pathological feedback loops that sustain psychotic symptoms.
Method
Participants and study design
Data were obtained from Yale University Open Data Access project #2024-0608 (https://yoda.yale.edu). Because of the de-identified nature of the secondary data, no further ethical approval or consent was required beyond that obtained during the initial studies.
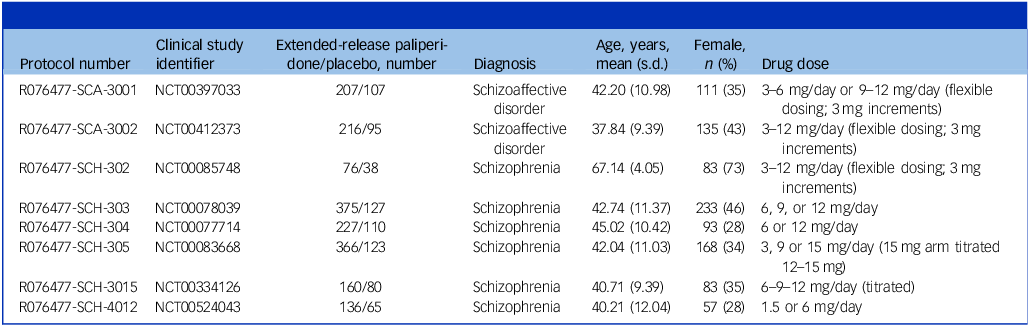
The data-set comprised eight double-blind, randomised, placebo-controlled clinical trials of oral antipsychotic treatment efficacy (Table 1). All participants were aged 18 years or over and had a DSM-IV diagnosis of schizophrenia or schizoaffective disorder. Included participants were randomised to either extended-release paliperidone or placebo. An additional minority of participants across the clinical trials received alternative antipsychotic treatment but were excluded from the analysis to account for cross-drug differences. Extended-release paliperidone was provided by oral tablets once daily for at least 6 weeks. Drug doses for each study are provided in Table 1.
Characteristics of clinical trials included in the analysis

Table 1 Long description
The table presents the characteristics of clinical trials for extended-release paliperidone and placebo. It includes eight rows and eight columns. The columns are labeled as Protocol number, Clinical study identifier, Extended-release paliperidone/placebo, number, Diagnosis, Age, years, mean (s.d.), Female, n (%), and Drug dose. The rows provide details for each clinical trial. Row 1: Protocol number, R076477-SCA-3001; Clinical study identifier, NCT00397033; Extended-release paliperidone/placebo, number, 207/107; Diagnosis, Schizoaffective disorder; Age, years, mean (s.d.), 42.20 (10.98); Female, n (%), 111 (35 percent); Drug dose, 3-6 mg/day or 9-12 mg/day (flexible dosing, 3 mg increments). Row 2: Protocol number, R076477-SCA-3002; Clinical study identifier, NCT00412373; Extended-release paliperidone/placebo, number, 216/95; Diagnosis, Schizoaffective disorder; Age, years, mean (s.d.), 37.84 (9.39); Female, n (%), 135 (43 percent); Drug dose, 3-12 mg/day (flexible dosing, 3 mg increments). Row 3: Protocol number, R076477-SCH-302; Clinical study identifier, NCT00085748; Extended-release paliperidone/placebo, number, 76/38; Diagnosis, Schizophrenia; Age, years, mean (s.d.), 67.14 (4.05); Female, n (%), 83 (73 percent); Drug dose, 3-12 mg/day (flexible dosing, 3 mg increments). Row 4: Protocol number, R076477-SCH-303; Clinical study identifier, NCT00078039; Extended-release paliperidone/placebo, number, 375/127; Diagnosis, Schizophrenia; Age, years, mean (s.d.), 42.74 (11.37); Female, n (%), 233 (46 percent); Drug dose, 6 or 12 mg/day. Row 5: Protocol number, R076477-SCH-304; Clinical study identifier, NCT00377714; Extended-release paliperidone/placebo, number, 227/110; Diagnosis, Schizophrenia; Age, years, mean (s.d.), 45.02 (10.42); Female, n (%), 93 (28 percent); Drug dose, 6 or 12 mg/day. Row 6: Protocol number, R076477-SCH-305; Clinical study identifier, NCT00383668; Extended-release paliperidone/placebo, number, 366/123; Diagnosis, Schizophrenia; Age, years, mean (s.d.), 42.04 (11.03); Female, n (%), 168 (34 percent); Drug dose, 3, 9, or 15 mg/day (15 mg arm titrated 12-15 mg). Row 7: Protocol number, R076477-SCH-3015; Clinical study identifier, NCT00334126; Extended-release paliperidone/placebo, number, 160/80; Diagnosis, Schizophrenia; Age, years, mean (s.d.), 40.71 (9.39); Female, n (%), 83 (35 percent); Drug dose, 6-9-12 mg/day (titrated). Row 8: Protocol number, R076477-SCH-4012; Clinical study identifier, NCT00524043; Extended-release paliperidone/placebo, number, 136/65; Diagnosis, Schizophrenia; Age, years, mean (s.d.), 40.21 (12.04); Female, n (%), 57 (28 percent); Drug dose, 1.5 or 6 mg/day.
Outcome measures
Symptoms were assessed using the Positive and Negative Syndrome Scale (PANSS), Reference Kay, Fiszbein and Opler17 comprising 30 items rated on a 7-point scale (1 = absent to 7 = extreme). Because of the high computational demand of the panel GVAR model, 20 out of the 30 PANSS items were selected according to the PANSS consensus 5-factor model, Reference Wallwork, Fortgang, Hashimoto, Weinberger and Dickinson18 which integrates consensus features across multiple PANSS factor structures and has demonstrated reliability in evaluating symptom change. Reference Pinna, Bosia, Cavallaro and Carpiniello19
Assessments were conducted biweekly over 6 weeks, yielding four equidistant time points (baseline and weeks 2, 4 and 6). All 2508 participants completed baseline assessments; follow-up completion rates were 2053 (81.9%; week 2), 1664 (66.3%; week 4) and 2151 (85.8%; week 6).
Symptom network analysis
All analyses were conducted in R version 4.3.0 (The R Foundation for Statistical Computing, Vienna, Austria; https://cran.r-project.org/web/packages/psychonetrics/index.htmlpublisher), using the ‘psychonetrics’ package. Network visualisations were produced with the ‘qgraph’ and ‘ggplot2’ packages. Reference Epskamp, Cramer, Waldorp and Schmittmann20,Reference Wickham21
Missing symptom scores were imputed via Kalman smoothing (requiring three or more observations per participant). Reference Slipetz, Falk and Henry22 To satisfy stationarity assumptions, data were detrended for linear and quadratic time effects and standardised across time points. Reference Hoffart, Skjerdingstad, Freichel, Mansueto, Johnson and Epskamp16 Study-specific effects across trials were also removed. Full information maximum-likelihood estimation was applied to handle residual missingness, ensuring inclusion of participants with incomplete data. Reference Enders23
A panel GVAR model Reference Epskamp, Waldorp, Mõttus and Borsboom24 was used to estimate average within-individual temporal symptom networks, controlling for between-participant variance. Temporal networks capture lagged predictive relationships between symptoms across adjacent time points (directed edges, β-coefficients). Outgoing edges quantify how much a symptom predicts subsequent changes in other symptoms. Incoming edges indicate the degree to which a symptom is predicted by others. Separate panel GVAR models were estimated for the treatment and placebo groups. Networks were bootstrapped over 500 iterations, and edge weights with 95% confidence intervals crossing 0 were removed to retain only statistically robust connections. Reference Fried, Eidhof, Palic, Costantini, Huisman-van Dijk and Bockting25
Community structure was assessed using the Spinglass algorithm, repeated 1000 times per network to ensure stability; the median outcome was selected, and network modularity calculated. Reference Vierl, Juen and Benecke26
To quantify the relative importance of each symptom in the network, node strength and expected influence were computed. Strength centrality represents the total absolute edge weights of each node and is considered the most stable among centrality metrics. Reference Epskamp, Borsboom and Fried27 Expected influence, in contrast reflects the sum of the signed values. Reference Robinaugh, Millner and McNally28 In-strength, out-strength and total-strength were calculated separately for each node by summing the absolute value of relevant incoming/outgoing edge weights; in-, out- and total-expected- influence were computed by summing the signed counterparts. To assess overall network connectivity, global strength was determined by summing the total absolute edge weights in each network.
Differences between treatment and placebo networks in edge weights, node centrality, community modularity and global strength were assessed with resampling-based permutation tests. Reference Good29 Group labels were randomly shuffled 500 times, and significance was determined by the proportion of permuted differences equal to or exceeding the observed difference. Multiple comparisons were adjusted with the Benjamini–Hochberg false discovery rate (FDR) correction, and p ≤ 0.05 (two-tailed) was considered statistically significant.
Results
Sample characteristics
A total of 2508 participants were included. A total of 1763 participants were randomised to receive drug treatment by extended-release paliperidone and 745 received placebo. Participants were 43.11 (s.d. 12.27) years old and 38.4% were female.
Network structure
Temporal networks for both placebo and active treatment are illustrated in Fig. 1. Global connectivity was significantly lower in the treatment group compared with placebo (18.92 v. 26.52; S = 7.60; p < 0.001), indicating reduced overall symptom interdependence. This difference remained significant when restricted to non-autoregressive (incoming and outgoing) edges (10.71 v. 17.89; S = 7.18; p = 0.004), but was nonsignificant for autoregressive edges alone (8.21 v. 8.64; S = 0.43; p = 0.352).
Temporal symptom networks under active and placebo treatment. Temporal symptom networks for the (a) treatment group and (b) placebo group. Green lines (grey lines in print version) represent positive associations between nodes and red lines (black lines in print version) represent negative associations as regression coefficients. Line thickness corresponds to edge weight. To facilitate visual comparison, node locations were fixed and the maximum edge weight was standardised as 0.57 (the maximum edge weight across the corresponding networks). Weak edges with an absolute edge weight below 0.05 were removed from graphs. Node colour corresponds to the symptom category: red (black in print version) for positive, blue (also blue in print version) for negative and green (grey in print version) for general psychopathology symptoms. Node labels correspond to symptoms as follows: P1 (Delusions), P2 (Conceptual disorganisation), P3 (Hallucination), P4 (Excitement), P5 (Grandiosity), P7 (Hostility), N1 (Blunted affect), N2 (Emotional withdrawal), N3 (Poor rapport), N4 (Passive/apathetic social withdrawal), N5 (Difficulty in abstract thinking), N6 (Lack of spontaneity), G2 (Anxiety), G3 (Guilt feelings), G6 (Depression), G7 (Motor retardation), G8 (Uncooperative), G9 (Unusual thought content), G11 (Poor attention) and G14 (Poor impulse control).

Patterns of symptom centrality for treatment and placebo networks are presented in Fig. 2. Group comparisons were conducted for in-strength, out-strength and total-strength centrality metrics. Although many symptoms showed nominally significant reduced connectivity in the active treatment group, after FDR correction, lack of spontaneity (N6) was the only node differing significantly between groups, showing lower out-strength (0.97 v. 1.74; p < 0.001) and total-strength (1.58 v. 3.37; p < 0.001) in the treatment group. Further group comparisons were calculated for in-, out- and total-expected-influence metrics as demonstrated in Supplementary Fig. 1. Here, none of the nodes exhibited a significant difference between the groups for any metric after FDR correction, highlighting that treatment affects edge weights overall.
Differences in strength centrality between placebo and active treatment. Heatmap showing in-strength, out-strength and total-strength estimates for the treatment and placebo networks. Darker colours indicate symptoms with higher strength and therefore a higher influence on (out-strength) or from (in-strength) other symptoms. Strength estimates that significantly differ between treatment and placebo groups at the p ≤ 0.05 level are marked with a single asterisk, whereas estimates with a double asterisk are significant after false discovery rate correction.

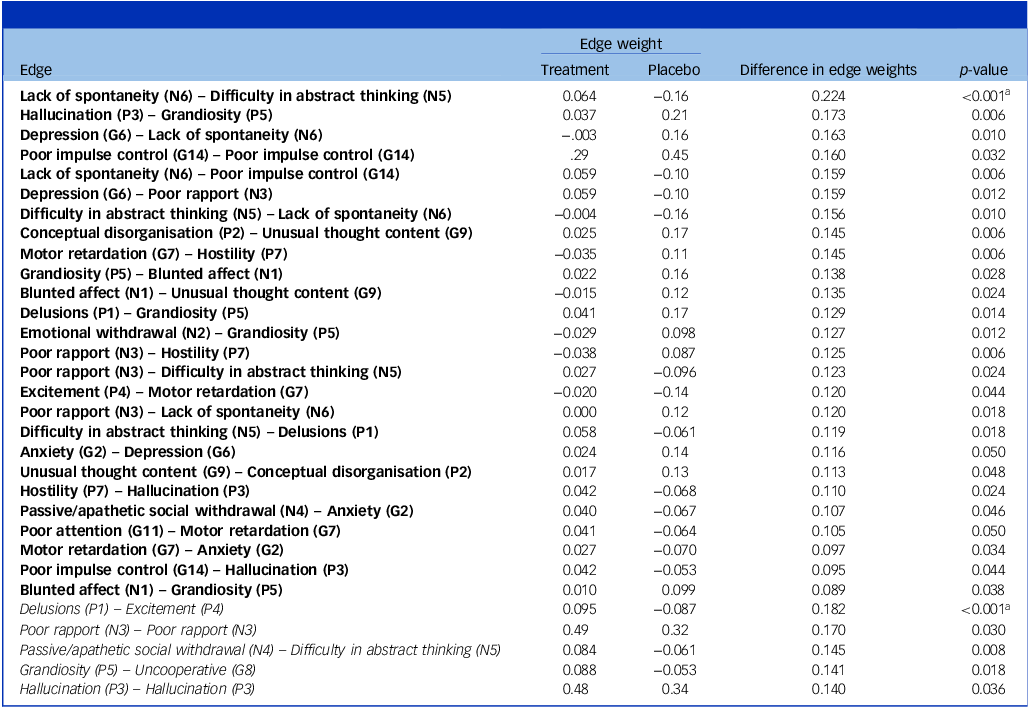
In terms of symptom–symptom interactions, only two edges remained significant after FDR correction (Table 2). The outgoing connection from lack of spontaneity (N6) to difficulty in abstract thinking (N5) was significantly lower in magnitude in the treatment group (β = 0.064) compared with placebo (β = −0.16; p < 0.001), but also exhibited a change in direction. Further, the edge from delusions (P1) to excitement (P4) demonstrated a greater magnitude in the treatment group (β = 0.095 v. β = −0.087; p < 0.001), with a similar change in direction.
Symptom interactions under placebo and active treatment

Table 2 Long description
A table comparing symptom interactions under placebo and active treatment. The table has 25 rows and 5 columns. The columns are labeled Edge, Treatment, Placebo, Difference in edge weights, and p-value. Each row lists a specific symptom interaction and its corresponding values for treatment, placebo, difference in edge weights, and p-value. For example, the first row shows Lack of spontaneity (N6) – Difficulty in abstract thinking (N5) with Treatment: 0.064, Placebo: -0.16, Difference in edge weights: 0.224, and p-value: <0.001.
Edges showing significant differences between treatment and placebo temporal networks. Edges are ordered by descending magnitude of difference. Based on their absolute values, edges greater in the placebo group are listed in the top half of the table in bold; edges greater in the treatment group are listed in the bottom half in italics.
a. Remains significant after false discovery rate correction.
Modularity was low in both active (Q = 0.090) and placebo networks (Q = 0.077), indicating a lack of clear community structure, and did not differ between groups (p = 0.542).
Discussion
In this large, pooled analysis of eight randomised controlled trials, we examined how 6 weeks of paliperidone treatment influences the temporal architecture of symptom networks in schizophrenia. Consistent with our hypothesis, antipsychotic treatment was associated not only with reductions in overall symptom severity, but also with a marked attenuation of dynamic interdependencies among symptoms. Specifically, global network connectivity was significantly lower in the treatment group compared with placebo, indicating a weakening of temporal coupling and potential disruption of self-reinforcing symptom cycles. These findings provide empirical support for network theoretic models of psychopathology, which conceptualise clinical improvement as stemming not solely from reductions in symptom intensity, but also from the dismantling of maladaptive symptom interactions.
Our results advance network-theoretic models of psychopathology by demonstrating that effective pharmacotherapy can disrupt within-person temporal interdependencies that may sustain illness. Reference Borsboom8,Reference Cramer, Van Borkulo, Giltay, Van Der Maas, Kendler and Scheffer10 Lower global strength in the treatment network implies that symptoms under active medication are less likely to trigger cascades of activation across the symptom ensemble; that is, treatment appears to reduce the system’s tendency to enter or sustain self-reinforcing loops. This temporal evidence complements prior cross-sectional work showing reduced co-activation after treatment, Reference Sun, Zhang, Lu, Yan, Guo and Liao14,Reference Esfahlani, Sayama, Visser and Strauss30–Reference Griffiths, Leighton, Mallikarjun, Blake, Everard and Jones32 and extends those findings by explicitly modelling how symptoms predict subsequent changes in one another rather than only co-occurrence at single time points.
Notably, despite the network-wide reduction in symptom connectivity, there was only a specific change in a limited number of individual associations. These being a reduced connection from lack of spontaneity to difficulty in abstract thinking, and a greater connection from delusions to excitement under treatment. This indicates that the network-wide changes owing to antipsychotic treatment occur in a largely diffuse manner rather than confined to specific pathways. Interestingly, much of the effect appeared focused on a weakening of anticorrelations, suggesting that under treatment symptom trajectories become more aligned.
Three specific network features deserve further emphasis. First, autoregressive (self-predictive) effects were similar across groups and did not differ significantly after correction. In our data, the reduction in global connectivity was driven primarily by diminished cross-symptom relationships rather than by changes in symptom self-persistence. Clinically, this pattern suggests that paliperidone attenuates the propagation of activation between symptoms, making symptoms less influential on one another, while leaving the short-term temporal inertia of individual symptoms relatively unchanged over the 6-week window. Second, modularity was low in both treatment and placebo networks, and did not differ between groups. This contrasts with many cross-sectional findings that identify clearer symptom communities or factors; Reference Abplanalp, Braff, Light, Nuechterlein and Green33,Reference van Rooijen, Isvoranu, Meijer, van Borkulo, Ruhé and de Haan34 the discrepancy highlights an important conceptual distinction between static, between-person association structures and within-person temporal dynamics. Temporal network may reveal a more intermixed, non-modular landscape in which symptoms are diffusely coupled across domains, and short-term pharmacologic intervention appears to weaken those diffuse couplings without reorganising the network into distinct modules. Third, although antipsychotic medications primarily target positive symptoms, Reference Lyman and McCutcheon4,Reference Nucifora, Woznica, Lee, Cascella and Sawa6,Reference Haddad and Correll35 these results suggest that treatment may also modulate negative symptom connectivity. Lack of spontaneity, a negative symptom reflecting decreased initiation and fluency of interaction, was identified as a node whose temporal influence is especially labile to pharmacologic intervention, in terms of its overall connectivity. The lack of impact on expected influence highlights that much of the effect of antipsychotics appears concentrated on negative edges within the network. Targeting such central symptoms (pharmacologically or behaviourally) may therefore produce cascading benefits across the symptom network.
Strengths and limitations
This study has several methodological strengths. It is the first, to our knowledge, to apply a panel GVAR approach to model temporal symptom dynamics during antipsychotic treatment. This framework distinguishes within-person temporal effects from between-person differences, offering a more precise estimate of treatment-related changes in symptom coupling. The large, multinational data-set, including more than 2500 participants across 13 countries, further enhances the generalisability of results.
Nonetheless, several limitations warrant consideration. First, computational constraints in processing speed limited analysis to 20 PANSS items derived from the consensus 5-factor model. Although our approach captures core dimensions of schizophrenia, broader symptom subsets may reveal additional treatment-sensitive dynamics. This also includes symptoms not included in the full 30-item PANSS, such as affective and cognitive symptoms.
Second, our findings are specific to extended-release paliperidone; other antipsychotics may produce distinct network effects arising from differences in receptor binding and pharmacokinetics. Reference Sun, Zhang, Lu, Yan, Guo and Liao14,Reference McCutcheon, Harrison, Howes, McGuire, Taylor and Pillinger36 Similarly, previous research has highlighted potential moderating effects of gender on symptom profiles Reference Freichel37 which has not been accounted for here. This analysis also did not take into account the impact of side-effects produced by the antipsychotic medication, which may exert influence on symptoms across time, such as extrapyramidal effects.
Furthermore, although the implementation of full information maximum-likelihood estimation and Kalman smoothing allowed the maximisation of sample size across the study time points, the implemented methods rely on data being missing at random. However, the cause of the non-monotonic dropout at week 4 in a subset of the included studies is not directly testable from the data available. The missing-at-random assumption can therefore not be fully verified in these studies, and should be considered a potential limitation of the analysis.
Finally, symptom networks were modelled using fixed biweekly lags across four time points, as determined by the assessment intervals available in the study data-set. Symptom interactions likely unfold across multiple temporal scales, and some symptom changes may occur within the 2-week interval between assessments. As such, alternative lag structures may reveal additional symptom interactions. A greater number of time points could also promote more robust network estimation. Future studies could employ variable-lag or continuous-time modelling approaches to further explore symptom dynamics across different timescales. Reference Briganti, Scutari, Epskamp, Borsboom, Hoekstra and Golino15,Reference Wysocki, McCarthy, Van Bork, Cramer and Rhemtulla38 Alternative frameworks, such as cross-lagged panel network models, Reference Betz, Penzel, Rosen, Bhui, Upthegrove and Kambeitz39 may further elucidate how these dynamics evolve throughout treatment. Additionally, further investigation into the influence of treatment effectiveness on temporal networks may highlight individual-level differences in symptom dynamics over time.
There are several clinical and theoretical implications. From a mechanistic standpoint, the data are consistent with treatment-induced stabilisation of neural and cognitive systems, manifesting as reduced coupling among symptoms and a lower propensity for self-sustaining symptom loops. Practically, identifying highly central and treatment sensitive symptoms, such as lack of spontaneity in our sample, may guide adjunctive interventions (behavioural activation, cognitive remediation, motivational enhancement) to amplify treatment effects and address residual disability. Moreover, temporal network metrics could be explored as biomarkers; for example, early reductions in global connectivity or in the centrality of specific nodes might predict subsequent functional recovery or relapse risk.
In summary, in this pooled analysis of eight randomised controlled trials, antipsychotic treatment was associated with a broad reduction in temporal symptom connectivity and specific alterations in directional relationships among both positive and negative symptoms. These findings suggest that antipsychotic efficacy extends beyond symptom reduction, to include disruption of pathological interactions within the symptom network. Future research should evaluate whether changes in network connectivity predict treatment response, investigate potential moderating factors and investigate whether targeted interventions can selectively modulate network structure to improve long-term outcomes.
Supplementary material
The supplementary material is available online at https://doi.org/10.1192/bjp.2026.10775
Data availability
This study, carried out under Yale University Open Data Access (YODA) Project #2024-0608 used data obtained from the YODA Project, which has an agreement with Janssen Research & Development. The interpretation and reporting of research using this data are solely the responsibility of the authors and does not necessarily represent the official views of the YODA Project or Janssen Research & Development. The original proposal can be found at https://yoda.yale.edu/data-request/2024-0608/. The data that support the findings of this study are available on request from the YODA Project, at https://yoda.yale.edu/. The analytical code used in this project is not publicly available due to the privacy policies of the YODA platform. Artificial Intelligence tools have not been used in the formulation of this paper.
Author contributions
E.A.K. was the data analyst for the study and wrote the initial article draft. O.V.E. contributed to study design and data analysis, and edited the manuscript. B.A.B. guided data analysis choices and edited the manuscript. R.A.M. formulated the initial research question, guided data analysis choices and edited the manuscript.
Funding
R.A.M. is funded by a Wellcome Trust Clinical Research Career Development Fellowship (reference 224625/Z/21/Z) and is supported by the National Institute for Health and Care Research (NIHR) Oxford Health Biomedical Research Centre. The views expressed are those of the author(s) and not necessarily those of the NIHR or the Department of Health and Social Care.
Declaration of interest
R.A.M. has received speaker/consultancy fees from Angelini Pharma, Boehringer Ingelheim, Bristol Myers Squibb, Janssen, Karuna, Lundbeck, Newron, Otsuka and Viatris; and co-directs a company that designs digital resources to support treatment of mental ill health. E.A.K., O.V.E. and B.A.B. have nothing to declare.




 Open access


eLetters
No eLetters have been published for this article.