Implications
A method was developed to allow end-users of InraPorc (a nutritional model predicting and analysing growth in pigs) to easily characterise their animals based on observed data and then use the model to evaluate different scenarios applied to pig populations. This stochastic approach is useful to study the variation in response between animals. Its application showed that a lysine supply corresponding to 110% of the mean requirement of the population allowed maximising the technical performance while minimising their variation. Coupled with an economical approach, it would be useful to economically optimise nutrition of groups of pigs while reducing the environmental impact of pig production.
Introduction
Nutrient requirements, even though frequently determined in individual animals, are mainly given as mean values without considering the variation within the population. However, differences can appear between the response of the mean population (i.e. the mean of all individuals) and the response of the average individual of that population. Considering only the mean requirement has practical consequences. For instance, the lysine (Lys) requirement in pigs is a function of the animal (e.g. genetic, sex, weight, composition of the growth at a given BW), environmental conditions and feeding factors (Noblet and Quiniou, Reference Noblet and Quiniou1999). Even though some of these factors may be controlled, the Lys requirement varies between individual pigs (Bertolo et al., Reference Bertolo, Moehn, Pencharz and Ball2005). Formulating diets for the mean requirement of a population implies that the requirements of some animals will not be met and that their potential performance will not be realised. Consequently, the mean performance of the group will be lower than expected. Pig growth models such as those developed by Whittemore and Fawcett (Reference Whittemore and Fawcett1976), Moughan et al. (Reference Moughan, Smith and Pearson1987), Knap (Reference Knap2000) or van Milgen et al. (Reference van Milgen, Valancogne, Dubois, Dourmad, Sève and Noblet2008) have been designed to simulate the response of an individual animal. Due to the importance of considering between-animal variation, stochasticity has been included in modelling approaches to study the impact of between-animal variation on performance (Ferguson et al., Reference Ferguson, Gous and Emmans1997; Knap, Reference Knap2000; Pomar et al., Reference Pomar, Kyriazakis, Emmans and Knap2003; Schinckel et al., Reference Schinckel, Li, Preckel, Einstein and Miller2003; Wellock et al., Reference Wellock, Emmans and Kyriazakis2004). As the animal is described by a limited number of parameters in most models, inclusion of between-animal variation in modelling studies requires the determination of individual values of these parameters. Consequently, methods based on the analysis of serial live measurements have been developed to obtain these values (Schinckel and de Lange, Reference Schinckel and de Lange1996; Knap et al., Reference Knap, Roehe, Kolstad, Pomar and Luiting2003; Schinckel et al., Reference Schinckel, Li, Preckel, Einstein and Miller2003; Doeschl-Wilson et al., Reference Doeschl-Wilson, Knap and Kinghorn2006). The objective of this study is to develop an analysis method to summarise individual growth and feed intake profiles by five descriptive parameters of a growth model, and to study the relationships between these parameters. This analysis was based on actual performance data of a population of 192 pigs. Simulations with the InraPorc model were then performed to illustrate the possible use of such a set of parameters to model the growth response of a population of growing pigs to feeding strategies differing in Lys supply and the number of phase-feeding diets.
Material and methods
Individual characterisation of pigs in a population
In the first part of our study, an analysis procedure was developed to characterise individual pigs by a set of five parameters on the basis of repeated measurements of BW and ad libitum feed intake. To illustrate this method and its application for the study of impact of between-animal variation in a population of pigs, data from 192 pigs were used for individual estimation of the five parameters (three BW parameters and two feed intake parameters).
Data analysis procedure
In order to describe the change in, for example, daily gain, mechanistic models of growth are based on phenomena that occur at a lower level of aggregation (e.g. protein deposition or protein synthesis). These models are typically based on differential equations, which need to be integrated numerically in order to predict daily gain. Variation between individual animals is accounted for by variation in model parameters describing the underlying phenomena. Direct statistical estimation of these parameters can be used to estimate this variation but it may be very difficult and expensive when the underlying phenomena need to be observed. When only aggregate observations are available, model parameters can be obtained indirectly by using specialised software. The inconvenience is that this software is rarely available to end-users of models. In this study, an intermediate approach was taken where aggregate data on daily gain and feed intake were described by empirical equations that bear close resemblance to the equations used to describe phenomena at a lower level of aggregation. In this study, we apply the technique to the InraPorc model but it has general applicability.
In InraPorc (2006), protein deposition is described using a Gompertz function (van Milgen et al., Reference van Milgen, Valancogne, Dubois, Dourmad, Sève and Noblet2008). Because of the close relationship between protein deposition and daily gain, we used the Gompertz function to describe the change in BW as a function of age. This function is typically parameterised by the initial BW (at age = 0), BW at maturity and a shape parameter (BGompertz). The first two parameters may be difficult to estimate because they refer to a situation well beyond the applicability range of the growth model (and most observed data). The Gompertz function was therefore reparameterised to include ‘expected-value parameters’ (Schnute, Reference Schnute1981) to replace parameters that are beyond the range of observed data. The equation below is the Gompertz function, where the initial BW and BW at maturity are replaced by the expected BW at 65 days of age (BW65d; i.e. a typical starting weight for a growth model) and the age at which pigs reach a BW of 110 kg (age110; i.e. a typical slaughter weight) (equation (1)).

We then further reparameterised the model by replacing age110 by the average daily gain between 65 days of age and 110 kg of BW (ADG65d-110 kg; calculated as ADG65d-110 kg = (110 − BW65d)/(age110 − 65)). Thus, the change in BW can be described by a model with three parameters, which have a practical meaning: BW65d, ADG65d-110 kg and the shape parameter BGompertz. The shape parameter BGompertz (called ‘precocity’ in the InraPorc software) indicates whether pigs are early- or late maturing. For a given BW65d and ADG65d-110 kg, a high value of BGompertz indicates an early maturing animal, whereas a low value represents a late maturing animal.
The ad libitum daily feed intake (DFI) is assumed to be a function of BW in the InraPorc model. Among different available equations, a power function was chosen for this study to define the ad libitum feed intake on an as-fed basis (kg/day) (equation (2)):

The parameter a is a scale parameter of the feed intake curve, whereas b is a shape parameter. In the statistical estimation, the parameters a and b are often highly correlated. Equation (2) was therefore reparameterised to include the expected DFI (kg/day) at 50 kg BW (DFI50), which corresponds to the DFI at, approximately, the middle of the growth curve (i.e. DFI50 = a × 50b) (equation (3)):

Data description
Data from Rivest (Reference Rivest2004) were used in the analysis procedure. These data were collected from October 2003 to March 2004 during a performance test at the CDPQ experimental station in Deschambault (Québec, Canada). A total of 193 pigs (100 gilts and 93 barrows, P76×(Large White × Landrace)) were tested. Mean BW at the beginning and end of the test were 31.2 ± 3.9 kg (66.9 ± 1.5 days of age) and 113.0 ± 7.7 kg (145.1 ± 10.6 days of age), respectively. Animals had ad libitum access to diets formulated to meet or exceed nutritional requirements (National Research Council (NRC), 1998), allowing the animals to express their phenotypic potential for protein deposition. Three different diets decreasing in protein content (19.1%, 17.7% and 16.8% CP on an as-fed basis, for diets 1, 2 and 3, respectively) were used successively and diets were changed when the mean BW reached approximately 50 and 75 kg. During the test, DFI was recorded daily for each pig using an IVOG (INSENTEC, Marknesse, The Netherlands) automatic feeder system. Animals were weighed at the beginning, around 50 and 75 kg, and at the end of the test. Mean (± s.d.) ADG, average DFI (ADFI) and feed conversion ratio (FCR) observed during the test were 1.06 ± 0.10 kg/day, 2.45 ± 0.27 kg/day and 2.35 ± 0.16 kg/kg, respectively.
Calculations
The three parameters for the Gompertz function (equation (1); BW65d, BGompertz and ADG65d-110 kg) were estimated for each pig from BW and age data using the NLIN procedure from the Statistical Analysis Systems Institute (SAS, 2000). Feed intake was recorded daily whereas the proposed equation to describe the change in feed intake varies with BW (equation (2)). Consequently, the Gompertz function was used to estimate the BW for each day corresponding to the daily DFI data. The DFI50 and b parameters were then estimated for each pig using equation (3) and the NLIN procedure of the SAS (2000). Data of one barrow were excluded from the analysis because of unrealistic values of parameters.
Simulation method
In the second part of the study, the model parameters obtained above were used to create a virtual population of pigs that could be used in simulations using InraPorc (2006). The objective of these simulations was to study the variation of the population performance in response to different feeding strategies. First, the simulated Lys requirement of each pig under non-limiting conditions was determined and the average Lys requirement of the population was determined. The consequence of using different feeding strategies (differing in Lys supply and the number of phase-feeding diets) on performance of each pig from 65 days of age to slaughter at 110 kg BW, was then tested by simulation modelling.
Model parameterisation and calculation of the Lys requirement
In the InraPorc model (van Milgen et al., Reference van Milgen, Valancogne, Dubois, Dourmad, Sève and Noblet2008), several model parameters are used as inputs to define an animal profile (for ad libitum feed intake and growth). The parameters obtained in the statistical analysis of ADFI and ADG bear close resemblance to those used in InraPorc (2006). For example, in the data analysis, ADG is described by a Gompertz function whereas in InraPorc (2006), protein deposition is described by this function. For each animal, parameters obtained from the data analyses were converted to parameters used by InraPorc (2006). The parameter ADG65d-110 kg was converted to the InraPorc parameter meanPD (mean protein deposition during the simulated period). An approximate value of meanPD was first obtained by dividing ADG65d-110 kg by 6.25. If the performance predicted by InraPorc (2006) differed from the observed performance, the meanPD was adjusted manually so that the predicted ADFI and ADG corresponded as close as possible to the observed values. Through this operation, a set of model parameters was obtained for each pig, and the InraPorc model was then used to predict the daily standardised ileal digestible Lys (SID Lys) requirement for each pig. The SID Lys requirement in InraPorc (2006) is calculated using a factorial approach and accounting for requirements for maintenance and protein deposition (van Milgen et al., Reference van Milgen, Valancogne, Dubois, Dourmad, Sève and Noblet2008). Requirements for maintenance include the basal endogenous losses (0.313 g/kg dry matter intake; Noblet et al., Reference Noblet, Sève and Jondreville2002) and losses due to integuments (4.5 mg/kg BW0.75 per day) and basal turnover of protein (23.9 mg/kg BW0.75 per day) (Moughan, Reference Moughan1998). Deposited protein is supposed to contain 6.96% Lys and the maximum efficiency of using SID Lys was assumed to be 72% (Sève, Reference Sève1994). The mean daily SID Lys requirement of the population was calculated from the individual requirements.
Feed sequence plans and lysine supply
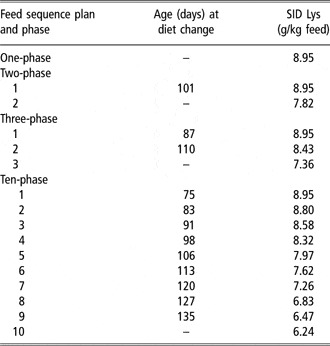
Four feed sequence plans were defined in InraPorc (2006) using one, two, three or ten different diets. These feed sequence plans were then used to simulate the performance of the population. The criterion to change diets in the multiphase feed sequence plans was the age of the animal (Table 1). As all simulations started at the same initial age (65 days), all pigs received the same diet during the same period of time, except during the last phase for which the duration was determined by the final weight (110 kg). Within each phase of a feed sequence plan, the SID Lys requirement (in g/kg feed) of a pig typically declines because voluntary feed intake (kg/day) increases more rapidly than the Lys requirement (g/day). For each phase of a feed sequence plan, a reference SID Lys level was defined as the highest mean population requirement during the phase (i.e. typically the mean requirement at the beginning of a feeding phase). Simulations were then realised by using Lys levels that provided 70%, 80%, 90%, 100%, 110%, 120% or 130% of this reference level of SID Lys. Diets in all simulations were identical in net energy (10.59 MJ/kg), CP (19%) and SID amino acid content (except Lys). No amino acid other than Lys could limit growth in the simulations.
Age at diet change and standardised ileal digestible lysine (SID Lys) content in the feeds used in the simulations

Simulations and calculations
Daily feed intake and growth were simulated individually using the InraPorc model from 65 days of age to 110 kg BW and for each feed sequence plan and Lys supply. Individual ADG, ADFI, FCR, protein and lipid weights at slaughter, duration to reach 110 kg and ingested quantities of Lys were calculated (see van Milgen et al. (Reference van Milgen, Valancogne, Dubois, Dourmad, Sève and Noblet2008) for details on the relations used in InraPorc (2006) concerning nutrient intake, composition and growth and lipid and protein deposition). The proportion of the population for which the SID Lys requirement was met (PRM, expressed as %) was calculated at the start and end of each phase, and results were averaged across phases for each feed sequence plan and Lys supply.
Statistical analysis
For the analysis of observed BW and DFI data, Pearson correlations between the five parameters were calculated using the CORR procedure of the SAS (2000). Simulated performance (i.e. ADG, ADFI, FCR, protein and lipid weights at slaughter, duration to reach 110 kg and total ingested Lys) was analysed using the MIXED procedure of the SAS (2000). Feed sequence plan and level of SID Lys were included in the model as fixed effects as well as their interaction, and animal was considered as a random effect. When effects were significant (P < 0.05), least square means were separated using the PDIFF function with the Tukey–Kramer adjustment. Linear and quadratic orthogonal contrasts were also tested for the fixed effects and their interaction. The PRM data were analysed through a χ 2 test using the GENMOD procedure of the SAS (2000).
Results
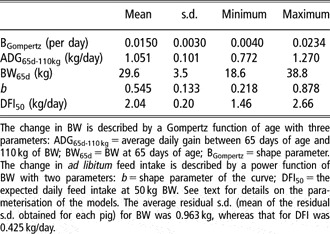
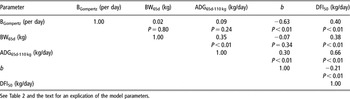
Except for one barrow, the data analysis procedure allowed obtaining realistic values for the five descriptive parameters (Table 2). Correlation analysis showed that the shape parameters b and BGompertz were highly correlated (r = −0.63; P < 0.01; Table 3), implicating that an early DFI relative to BW (i.e. a low value of b) is associated with an early maturing animal (i.e. a high value of BGompertz). The high positive correlation between DFI50 and ADG65d-110 kg (r = 0.66; P < 0.01) indicates that a high DFI at 50 kg BW is associated with a high growth rate between 65 days of age and 110 kg BW. The BGompertz was moderately correlated to DFI50 (r = 0.40; P < 0.01).
Parameter estimates used in the description of individual growth and feed intake curves of a population of 192 pigs

The change in BW is described by a Gompertz function of age with three parameters: ADG65d-110 kg = average daily gain between 65 days of age and 110 kg of BW; BW65d = BW at 65 days of age; BGompertz = shape parameter. The change in ad libitum feed intake is described by a power function of BW with two parameters: b = shape parameter of the curve; DFI50 = the expected daily feed intake at 50 kg BW. See text for details on the parameterisation of the models. The average residual s.d. (mean of the residual s.d. obtained for each pig) for BW was 0.963 kg, whereas that for DFI was 0.425 kg/day.
Pearson correlation coefficients (with probability) between the five descriptive parameters obtained from an analysis of individual growth and intake curves for a population of 192 pigs

See Table 2 and the text for an explication of the model parameters.
The DFI50 and ADG65d-110 kg were both positively correlated to BW65d (r = 0.38 and 0.35, respectively; P < 0.01). The heavier an animal was at 65 days of age, the higher were its DFI50 and ADG65d-110 kg.
The b and DFI50 were moderately correlated (r = −0.21; P < 0.01) as a result of the parameterisation of DFI model. This indicates that a higher DFI50 was only partially related to an early increase of intake. The intake parameter b was also moderately correlated with ADG65d-110 kg (r = 0.30; P < 0.01). There was no significant relationship between the growth precocity parameter (BGompertz) and ADG65d-110 kg (P = 0.24). Thus, a given growth performance is not necessarily associated with an early or late maturing pig. Similarly, the shape parameters of the growth (BGompertz) and intake (b) curves were not significantly correlated to BW65d.
Change in estimated Lys requirement and percentage of animals for which the Lys requirement was covered
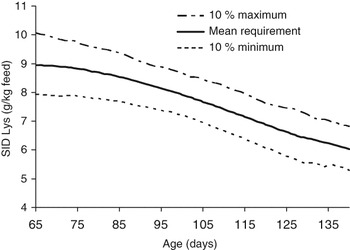
The estimated mean SID Lys requirement of the population decreased with age (Figure 1). In the multiphase feed sequence plans, we used a SID Lys supply that corresponded to the highest mean population requirement within a phase. As the SID Lys requirement declines with age, the reference SID Lys level corresponded to the mean population requirement at the beginning of a phase. Declining Lys levels were used between the successive phases (Table 1).
Simulated change in the standardised ileal digestible lysine (SID Lys) requirement (mean, 10% higher and 10% lower, g/kg feed) as a function of age for a population of 192 pigs.

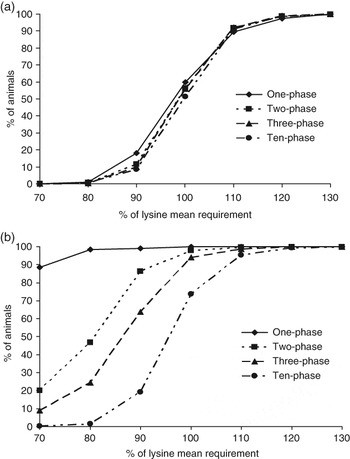
The simulated PRM at the beginning of a phase followed an S-shaped curve relative to the SID Lys supply (Figure 2a). The shape of the curve was not affected by the number of diets used in the feed sequence plan (P > 0.05). The simulated PRM increased with increasing SID Lys supply (P < 0.001). A supply of 100% of the mean population requirement covered the requirement for 56% of the population at the beginning of a phase. The PRM increased rapidly with increasing SID Lys and a supply of 130% of the mean population requirement covered the requirement of every individual in the population. The situation is different for the simulated PRM at the end of a phase (Figure 2b). As the requirement declines with age, but the supply remains the same within a phase, a greater PRM will be observed (P < 0.001). The PRM increased with increasing SID Lys supply (P < 0.001) but the response depended on the number of phases as, for a given Lys supply, the PRM decreased with an increasing number of phases (P < 0.001). With a supply corresponding to 100% of the mean population requirement, the PRM at the end of the phase was 74% for ten-phase feed sequence plan and greater than 94% for other feed sequence plans. With a supply of 130% of the mean population requirement, the requirement of entire population was met, irrespective of the feed sequence plan used.
Effect of lysine (Lys) supply (as % of the mean Lys requirement of the population) and feed sequence plan on the percentage of pigs for which the Lys requirement was met at the beginning (a) or at the end of the phase (b).

Effect of lysine supply and feed sequence plan on performance of the population
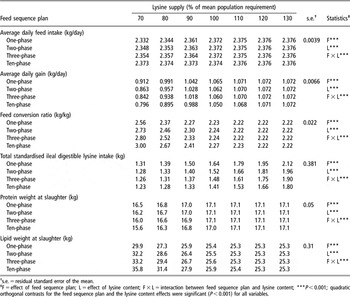
Increasing the Lys supply and increasing the number of phases resulted in a significant but numerically small increase in simulated ADFI (P < 0.001; Table 4). The mean ADFI was 2.37 kg/day. The quantity of ingested SID Lys (cumulated over the entire period of simulation) increased with increasing Lys supply (quadratic effect, P < 0.001) and decreased with increasing number of phases (quadratic effect, P < 0.001). Providing 70% of the reference Lys supply resulted in a reduction of 20% and 13% of the total SID Lys supply for the one- and ten-phase feed sequence plans, respectively. The average time required to reach 110 kg decreased with increasing Lys supply and increased with increasing number of phases (quadratic effect, P < 0.001; data not shown), When providing 70% of the reference SID Lys supply, pigs required 90 and 104 days to reach 110 kg with the one- and ten-phase feed sequence plans, respectively. For 100% of the reference SID Lys supply, they required 77 and 78 days for the one- and ten-phase feed sequence plans, respectively. For a higher supply, pigs required 76 days to reach 110 kg irrespective of the feed sequence plan used.
Effect of standardised ileal digestible lysine supply and feeding strategy on simulated performance of a population of pigs (least square means)

†s.e. = residual standard error of the mean.
‡F = effect of feed sequence plan; L = effect of lysine content; F × L = interaction between feed sequence plan and lysine content; ***P < 0.001; quadratic orthogonal contrasts for the feed sequence plan and the lysine content effects were significant (P < 0.001) for all variables.
The simulated ADG increased with increasing Lys supply (quadratic effect, P < 0.001; Table 4). Above a SID Lys supply of 110% of the reference supply, performance was similar between feed sequence plans and Lys supplies (P > 0.05). The variation in ADG in response to increasing Lys supply increased with increasing number of phases (interaction feed sequence × Lys level, P < 0.001; Table 4). As the change in ADFI was small, the effect of feeding strategy on simulated FCR was similar to that observed for ADG. Providing 70% of the reference SID Lys supply resulted in a decrease in ADG ranging from 14% for the one-phase feed sequence plan to 24% for the ten-phase feed sequence plan. This reduction also resulted in an increase in FCR ranging from 15% for the one-phase feed sequence plan to 32% for the ten-phase feed sequence plan. Simulated final body protein weight (at 110 kg BW) was reduced following a reduction in SID Lys supply, whereas simulated final body lipid weight was increased (quadratic effect, P < 0.001; Table 4). A reduction of 30% of the SID Lys (relative to the reference supply) resulted in a decrease in final protein weight ranging from 4% to 8%, and an increase in final lipid weight ranging from 18% to 38%, for the one- and the ten-phase feed sequence plans, respectively.
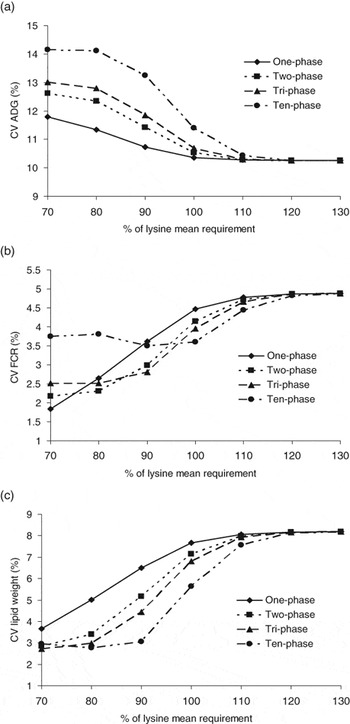
The variability in simulated performance between animals was estimated by the coefficient of variation (CV) of the calculated ADG, FCR and final lipid weight (Figure 3). For all feed sequence plans, the CV of ADG and lipid weight was constant (10.3% and 8.2%, respectively), for a SID Lys supply equal or greater than 120%. For a lower supply, the CV of ADG increased and that of final lipid weight decreased with decreasing Lys supply and with an increasing number of phases. The change in CV of final protein weight was similar to that of lipid weight, but with lower values (CV protein weight < 2%). The effect of the feed sequence plan on the CV of FCR varied with increasing Lys supply. With a supply corresponding to 70% of the mean requirement, the CV of FCR increased with an increasing number of phases. This relationship was inversed for a supply corresponding to 100% of the reference supply and no difference was observed for a supply higher than 120%. For the feed sequence plans with one, two or three phases, the CV of FCR increased with increasing Lys supply. For the ten-phase feed sequence plan, this criterion decreased for a supply between 80% and 100% of the reference supply and increased thereafter with increasing SID Lys supply.
Effect of lysine supply (as % of the mean Lys requirement of the population) and feed sequence plan on the coefficient of variation (CV) of average daily gain (ADG) (a), feed conversion ratio (FCR) (b) and lipid weight at slaughter (c).

Discussion
In several pig growth models, performance of the animal is driven by protein and lipid deposition, which are often described by functions such as the Gompertz function (Ferguson et al., Reference Ferguson, Gous and Emmans1994; Knap, Reference Knap1999 and Reference Knap2000; Wellock et al., Reference Wellock, Emmans and Kyriazakis2003). Consequently, simulating the growth of pigs requires the knowledge of the numerical values of the underlying model parameters. Different methods have been proposed to achieve this, including serial slaughter at different BW (Ferguson and Gous, Reference Ferguson and Gous1993). Repeated measurements can also be realised during growth on individual pigs (Schinckel and de Lange, Reference Schinckel and de Lange1996), allowing estimation of the between-animal variation. Alternatively, techniques of ‘inverted modelling’ or ‘reverse simulation’ have been developed to obtain model parameters (Knap et al., Reference Knap, Roehe, Kolstad, Pomar and Luiting2003; Doeschl-Wilson et al., Reference Doeschl-Wilson, Knap and Kinghorn2006 and Reference Doeschl-Wilson, Knap, Kinghorn and Van der Steen2007). With these techniques, observations are compared with model outputs (e.g. ADG) and model parameters are adjusted iteratively so that predictions correspond (as close as possible) to observations. The analysis procedure described in this study can be considered as model inversion based on a limited number of equations using measurements on growth and intake. Through standard, non-linear regression using two equations, each animal in the population is characterised by a set of five parameters. The method allows end-users of InraPorc (2006) to easily characterise their animals based on observed data and then use the model to test different scenarios. The choice of the five parameters was driven by the fact that they closely resemble the inputs required by InraPorc (2006). These parameters also have a biological or technico-economical meaning, which facilitates the understanding and interpretation of their variation and relationships.
The method presented here addresses the need to consider the between-animal variation in growth models (Knap, Reference Knap1995; Kyriazakis, Reference Kyriazakis1999; Gous and Berhe, Reference Gous and Berhe2006). This interest is mainly related to the difference that can occur between the mean population response (i.e. the mean of all individuals) and the response of the average individual of the population (Pomar et al., Reference Pomar, Kyriazakis, Emmans and Knap2003; Wellock et al., Reference Wellock, Emmans and Kyriazakis2004). Introduction of stochasticity in models requires knowledge of not only the average values of model parameters and their variation, but also of the correlation between parameters (Ferguson et al., Reference Ferguson, Gous and Emmans1997; Kyriazakis, Reference Kyriazakis1999), and the method proposed here allows obtaining these. Little information is available about correlations between parameters describing the dynamics of feed intake and growth. Without addressing the issue of cause and effect, feed intake and growth are well correlated and this is reflected by some of the model parameters listed in Table 3. Knowledge about the variance–covariance matrix of parameters is of interest to generate other populations of pigs, but it remains to be confirmed whether the variance–covariance matrix is specific for this population of pigs or that (part of) it has general applicability. Magowan et al. (Reference Magowan, Mccann, Beattie, McCracken, Henry, Smyth, Bradford, Gordon and Mayne2007) highlighted the difficulty to assess the extent to which differences in feed intake and growth rate between and within herds can be attributed to genetics, relative to the effects of management and disease. The relations between parameters observed here are therefore foremost phenotypic relations.
Using the set of individual parameters obtained here, a simulation study was performed to illustrate the interest and application of considering between-animal variation in a pig growth model. In this case, it was used to study the consequence of changing the SID Lys supply on performance and variability between pigs. The Lys requirement in pigs still requires attention (Warnants et al., Reference Warnants, Van Oeckel and De Paepe2003; Quiniou et al., Reference Quiniou, Hamelin and Noblet2006). As the SID Lys requirement (in g/kg feed) typically decreases during growth, we used the mean requirement at the start of a phase as a reference situation. As can be expected, the simulated PRM was approximately 50% at the start of a phase, and increased with time within a phase. By increasing the number of phases, PRM increases less between the beginning and end of the phase because of the shorter duration of each phase. This was particularly the case when the Lys supply was relatively low (i.e. 70% to 100% of the reference supply). For higher Lys supplies, the requirement of a greater percentage of animals (90% or more) was met both at the beginning and at the end of a phase. This may explain why model predictions of the Lys requirement for the average animal in a population are low relative to common practice. Another interest of modelling studies is to extrapolate results from metabolism studies to other different situations (BW, age) or larger populations. For instance, Bertolo et al. (Reference Bertolo, Moehn, Pencharz and Ball2005), using the indicator amino acid oxidation technique, estimated the mean and variability of the true ileal digestible Lys requirement of growing pigs, but using only nine animals. A comparison of the variability observed in metabolism studies with that observed in large(r) scale field studies is essential before their results can be used as practical recommendation.
Changes in simulated ADG, ADFI, FCR and final protein and lipid weights according to the SID Lys supply were related to the changes observed for PRM. Performance increased and variation of performance between feed sequence plans decreased with increasing Lys supply. Maximum performance was reached for a supply close to 110% of the mean population requirement. At this supply, performance was similar for the different feed sequence plans. Leclercq and Beaumont (Reference Leclercq and Beaumont2000) and Gous and Berhe (Reference Gous and Berhe2006) observed a similar curvilinear plateau response relative to SID Lys supply for ADG and FCR when modelling broiler populations. Pomar et al. (Reference Pomar, Kyriazakis, Emmans and Knap2003) observed the same type of response of body protein deposition to increasing protein intake in pigs. For a Lys supply less than 110% of the mean requirement, ADG and PRM decreased with an increasing number of phases. With a low PRM, a smaller proportion of the population will be able to express its potential and the ADG of the population therefore decreases. The final lipid weight decreased and final protein weight increased with increasing SID Lys supply and decreasing number of phases. In InraPorc (2006), all energy not used for maintenance or to support protein deposition is deposited as lipid (van Milgen et al., Reference van Milgen, Quiniou and Noblet2000 and Reference van Milgen, Valancogne, Dubois, Dourmad, Sève and Noblet2008). At low levels of Lys supply, protein deposition is limited by Lys supply for many pigs in the population. For these animals, a greater part of energy is then available for lipid deposition. With increasing Lys supply or decreasing number of phases, an increasing percentage of pigs will be able to express their potential of protein deposition at the expense of lipid deposition.
The small change in simulated ADFI in response to Lys supply is to be interpreted with caution. The InraPorc model does not take into account for the possibility of change in feed intake during or after a nutrient deficiency. The slight difference in ADFI observed with increasing number of phases or decreasing Lys supply is due to the prolonged growth duration (to reach the final BW of 110 kg) and to an increased contribution of maintenance (relative to growth). The prolonged growth duration and its consequence on ADFI also explain that a reduction in Lys supply is not accompanied by a same extent reduction in SID Lys intake.
For a Lys supply greater than 110% of the mean population requirement, PRM is higher than 90% and the majority of pigs can express their growth potential. In this case, the CV is close to the ‘natural’ phenotypic variation of this population under optimal nutritional conditions (i.e. the Lys supply is not limiting). As the Lys supply decreases, PRM decreases, especially for the multiphase sequence plans. As the change in feeds is determined by age, pigs with a lower-than-average performance will have a higher-than-average SID Lys requirement (in g/kg feed) at the moment of the feed change. Consequently, they will be penalised more than the other pigs by the feed change as they receive less Lys than required. This contributes to the increase in the variability of simulated growth performance. The increase in variability of growth performance with feeds deficient in amino acids supply was also observed in broilers (Corzo et al., Reference Corzo, McDaniel, Kidd, Miller, Boren and Fancher2004). In contrast to the variability in ADG, the variability in final lipid and protein weight decreased with decreasing SID Lys supply. For low levels of Lys supply, growth will be determined mainly by the SID Lys content of the diet, and not by the phenotypic variation of the population. Reducing the SID Lys supply will therefore result in fatter but more homogenous carcasses.
Results of this study underline the importance of having accurate knowledge of the individual SID Lys requirement, if multiphase sequence plans are used. Without this knowledge, there is a risk of increasing the variability in performance over the intrinsic phenotypic variability of the population. In addition, the greater the variation in Lys requirement, the greater the safety margin should be to cover the needs of a large part of the population. At the same time, a greater part of the Lys supply will be given in excess to animals having a low performance potential. This was illustrated for pigs by Pomar et al. (Reference Pomar, Kyriazakis, Emmans and Knap2003) in a simulation study. These authors showed that the greater the intrinsic variability of potential growth in population, the higher the balanced protein supply should be to reach the maximum mean protein deposition rate. The recommendation of the present study that a supply of 110% of the mean population requirement for SID Lys should be sufficient to cover the requirement for most pigs may has to be modulated depending on the intrinsic variability of the population.
In the present study, time has been chosen to determine the feed change in the multiphase sequence plans and this is a typical practice in most swine operations. The mean BW of the population could also be chosen to determine feed change. This type of decision rule is currently not available in the InraPorc software. However, it would be interesting to model the consequence of such a rule on performance and variability. The effect of grouping animals in batches of homogeneous pigs (e.g. barrows and gilts) following specific feed sequence plans or slaughter strategies could then be studied. The present study also has other practical implications. The mean population requirement was chosen as a basis for the Lys content in the feed. By increasing the number of phases in the sequence plan, using a diet with a SID Lys content greater than the reference value became more critical (Figure 2), in order to cover the requirements of a large percentage of animals. Despite this safety margin, it reduced the total Lys supply and, thus, feed cost, because the total Lys supply could be reduced. In addition, a reduction in Lys supply is generally accompanied by a reduction in protein supply. It is likely that reducing the total Lys supply will also reduce nitrogen excretion. This illustrates that feed formulation for a population of pigs has biological, environmental and economical dimensions, and that a biotechnical evaluation alone in not sufficient. More comprehensive approaches have been used by Moughan et al. (Reference Moughan, Kerr and Smith1995), Boys et al. (Reference Boys, Li, Preckel, Schinckel and Foster2007) and Quiniou et al. (Reference Quiniou, Brossard, Gaudre, van Milgen and Salaün2007) to define economically optimal feeding and management strategies for growing pigs.
Conclusion
The analysis method presented in this study allows describing growth and feed intake curves of individual pigs within a population by a set of five parameters. Through this method, it is possible to characterise individual pigs in a population and to simulate different feeding strategies applied to that population. The study showed that a Lys supply corresponding to 110% of the mean requirement of the population covered the requirement for most pigs and that the variation in ADG between pigs was minimal. However, this corresponds to the maximum phenotypic performance of the population and the optimum may be different when economic or environmental aspects are considered. A stochastic approach towards the nutritional modelling of growth of pigs is a useful method to evaluate different scenarios applied to populations of pigs. Such an approach can only be carried out if knowledge about the relationships between relevant model parameters is available.
Acknowledgements
The authors are grateful to the Centre de Développement du Porc du Québec for the provision of the data. The authors also thank Alain Valancogne for his skilful technical assistance.