By the beginning of the twentieth century, Europe was largely free from peacetime famine (Alfani and Ó Gráda Reference Alfani and Gráda2017). One major exception was the 1933 Soviet famine, which killed six to eight million people; at least 40 percent of the deaths occurred in the Soviet Ukraine.Footnote 1,Footnote 2 In 1928, the Soviet Union was one of the 30 richest countries in the world (Maddison Reference Maddison1995, Appendix D), and the Soviet economy was rapidly growing (Markevich and Harrison Reference Markevich and Mark2011). How, then, could almost 10 percent of the population die of starvation and hunger-induced diseases in Ukraine, a territory famous for its grain production and known as the “grain basket” of the Soviet Union?
Three main explanations have been offered: weather, government policies, and genocide. Davies and Wheatcroft (Reference Davies and Wheatcroft2004), while documenting the imbalances and atrocities of the Soviet government policies, argue that the draught of 1931 was the main cause of the famine. Tauger (Reference Tauger2001) claims that an unusually high number of pests and widespread grain diseases destroyed the 1932 harvest. Proponents of the genocide theory claim that bad weather could not have caused a disaster of such magnitude, and therefore, the famine must have been a result of the government intentionally targeting ethnic Ukrainians. This is essentially the argument in Conquest (Reference Conquest1986), in Graziosi (Reference Graziosi, Curran, Luciuk and Andrew2015), and in popular books by Snyder (Reference Snyder2010) and Applebaum (Reference Applebaum2017).Footnote 3
The main limitation of previous studies is the lack of systematic disaggregated data that are large enough for rigorous statistical analysis. This is the principal contribution of my paper. I use hand-collected data on the course of the 1933 famine in Ukraine. My dataset combines 1933 mortality from the archives in Moscow with prefamine characteristics from published sources found in libraries in Kiev, Kharkov, the United States, and Canada.Footnote 4
In short, this paper documents three conclusions. (1) Available data do not support weather as the main explanation: in 1931 and 1932, weather predicts harvests roughly equal to the 1924–1929 average; weather explains up to 8.1 percent of excess deaths. (2) Government policies (collectivization of agriculture and the lack of favored industries) significantly increased famine mortality; collectivization explains up to 52 percent of excess deaths. (3) There is some evidence that ethnic Ukrainians and Germans were discriminated against: they were more likely to die than other ethnic groups, even when exposure to economic policies is controlled for (although this result is not statistically significant), and ethnic Ukrainians were more collectivized in 1930.
My study proceeds as follows. First, I consider aggregate data for the whole of Ukraine. I show that officially reported harvests and procurement are inconsistent with the severity of the 1933 famine—rural grain retention is too high in 1931 and 1932, the two crucial years before the famine peaked in the winter and spring of 1933. Historians argue that official harvest figures are inflated and that weather (drought in June 1931 and severe rains in July 1932 (Davies and Wheatcroft Reference Davies and Wheatcroft2004) or grain diseases and pests (Tauger Reference Tauger2001) destroyed the harvest. I demonstrate that there was no drought in Ukraine in 1931 and that although there were severe rains in June (not July) 1932, heavy rains also occurred in June 1933, and the harvest that year was reportedly good. I also demonstrate that, in the years preceding the 1933 famine, published archival documents do not discuss the weather, grain diseases, or pests more than usual. I then estimate grain production function using pre-1917 data and predict how much grain should have been produced. The predicted harvest is close to the officially reported harvest, so if a gap existed between the officially reported and the true harvest (and there must have been, because otherwise, rural retention is too high), in Ukraine, this gap is not predicted by the weather.
Next, I turn to policies specific to the 1933 famine. In 1929, the government launched a comprehensive collectivization campaign. Peasants were forced to give up their land, implements, and livestock and to join collective farms where they were supposed to work together. The government banned private trading of food; instead, it procured food from the countryside and rationed it in urban areas. Motivated by the historical context, I focus on three related policies that affected food production, procurement, and distribution: collectivization, measured as a share of rural households in collective farms in 1930; procurement, proxied by distance to a railroad (presumably, the farther an area was from a railroad, the more expensive it was to procure grain from it), and the presence of industries that received preferential treatment (important for the implementation of the five-year plan the so-called Group A industries which received better food supply).
I study the relationship between local weather, government policies, and famine mortality, using both cross-sectional (on smaller units) and difference-in-differences (on larger units) approaches. In all estimates, I control for prefamine characteristics, capturing wealth, economic development, grain productivity, and alternative food sources. To compare the impact of policies with the impact of weather, I include local weather in the controls (de-meaned June 1931 temperature and de-meaned June 1932 precipitation). I show that a higher share of rural households in collective farms in 1930 is associated with higher 1933 mortality and argue that the relationship is causal. I demonstrate that, consistent with historical accounts, collectivization of agriculture led to a drop in livestock and that the larger the collective farms were, the higher the famine mortality was, presumably because of higher managerial and monitoring costs in larger collectives. These findings, combined with historical accounts of poor harvests, are consistent with collectivization decreasing agricultural productivity. In addition, although the magnitude of the effect is much smaller than the impact of collectivization, I show that areas with favored industries experienced lower mortality in 1933, consistent with the accounts that these areas were better supplied. And, surprisingly, I find no strong evidence that access to railroads affected mortality. My calculations show that rainfall in June 1932 explains up to 8.1 percent of excess deaths and that collectivization explains up to 52 percent of excess deaths.Footnote 5 I conclude that the weather cannot be the main explanation for the famine in Ukraine.
Finally, I use the variation in rural ethnic composition within Ukraine to see how famine mortality changed with ethnic composition. I show that there is a positive, although statistically weak relationship, between ethnic Ukrainians and Germans and 1933 mortality rates, even after controlling for government policies. I also demonstrate that exposure to the above policies varied with ethnic composition: ethnic Ukrainians were more collectivized, and ethnic Ukrainians and Germans both had fewer favored industries.Footnote 6 However, I find no evidence that enforcement of the government policies varied with ethnic composition: the interactions between the share of Ukrainians (or Germans) in rural population and policy proxies are not associated with increased famine mortality. The finding that Ukrainians were more likely to be collectivized and less likely to have favored industries, together with the finding that both of these policies affected famine mortality, suggests that higher Ukrainian famine mortality is partly a product of higher Ukrainian exposure to bad Soviet policies. Ethnic composition varies little across Ukraine (more than 80 percent of rural population are ethnic Ukrainians), and in my sample, the positive relationship between ethnic Ukrainians, Germans, and 1933 mortality is statistically weak. More work is needed before making strong claims about the role of ethnicity in this famine.
There is a large historical literature on the course and causes of the 1933 Soviet famine.Footnote 7 My paper is the first to use detailed microdata and to systematically test and quantify the main explanations offered by historians. It also contributes to an economics literature on collectivization of agriculture and famines in command economies. Most studies concentrate on the Great Chinese Famine of 1959–1961: Li and Yang (Reference Li and Dennis2005) attribute 61 percent of the drop in agricultural output to the government policies of collectivization and grain procurement; Meng, Qian, and Yared (Reference Meng, Qian and Yared2015) argue that an inflexible procurement system significantly contributed to famine mortality; Chen and Lan (Reference Chen and Xiaohuan2017) study the killing of draft animals during collectivization in China and its impact on grain production; Lin (Reference Lin1990) offers a theoretical model arguing that after exiting from collectives was banned in China, peasants lost the incentives to discipline themselves, and the resulting drop in production contributed to the famine. My paper is the first to study Soviet collectivization, which predated and, to some extent, informed later Chinese collectivization efforts. Finally, this paper adds to the literature on the economic transformation and industrialization of the Soviet economy: Allen (Reference Allen2003) claims that the “big push” policies launched in 1928 made the Soviet economy one of the most successful developing economies in the twentieth century; Cheremukhin et al. (Reference Cheremukhin, Golosov, Guriev and Tsyvinski2017) argue instead that the reduction of entry barriers in manufacturing and not the “big push” was the main driver behind rapid Soviet industrialization; Rozenas and Zhukov (Reference Rozenas and Zhukov2019) study short- and long-term political implications of the 1933 famine. My paper complements these studies by improving our understanding of collectivization, an integral part of the history of Stalin’s industrialization efforts.
BACKGROUND
This section presents a stylized, truncated summary of events preceding the 1933 famine, its course, and subsequent institutional changes. Litoshenko (Reference Litoshenko2001), Lewin (Reference Lewin1968), Shanin (Reference Shanin1972), and Danilov (Reference Danilov2011) study peasantry and the state of Soviet agriculture in the 1920s, before collectivization.Footnote 8 Davies (Reference Davies1980) describes early Soviet collective farms. Davies and Wheatcroft (Reference Davies and Wheatcroft2004) present a detailed history of the famine. Ó Gráda (Reference Ó Gráda2009) and Alfani and Ó Gráda (Reference Alfani and Gráda2017) put the 1933 famine in the context of famines in world history. Cameron (Reference Cameron2018) studies the 1930–1933 famine in Kazakhstan. Kotkin (Reference Kotkin2017) explores Stalin’s role in this historical episode.
In 1914, the Russian Empire entered into WWI. Amid a series of military disasters, the government’s popularity plummeted culminating in the revolution of 1917. After a period of civil war, the Communist Party seized control over the newly created Soviet Union and then attempted to introduce “communism.” It abolished money and private property, prohibited private trade, and relied on arbitrary and unpredictable requisitions of “surplus” grain from peasants to feed the urban population.Footnote 9 Grain requisitions (prodrazverstka) led to a disastrous decrease in sown area and grain production, and, possibly exacerbated by poor weather, to the rural famine of 1921–1923, which was especially severe in Russia’s Volga region (Adamets Reference Adamets2002).
Unable to organize production in the nationalized factories and desperately trying to recover the ruined economy, Lenin declared a temporary retreat from pure socialist ideals and introduced the New Economic Policy (NEP) in 1921. Under NEP, small industrial enterprises were denationalized, allowing firms to make their own decisions. In the countryside, an agricultural tax (prodnalog) replaced arbitrary food requisitions. After paying taxes, peasants were free to sell their produce to several competing government procurement organizations or to deliver it directly to markets in the cities. This resulted in rapid economic growth. Paul Gregory estimates that by 1928 agricultural output was 111 percent of the 1913 level, and industrial output was 129 percent of the 1913 level (Gregory Reference Gregory1994, ch. 5, table 5.2). Markevich and Harrison (Reference Markevich and Mark2011) estimate that in 1927 net national income per capita was 96.9 percent of the 1913 level (Markevich and Harrison Reference Markevich and Mark2011, table 6).Footnote 10
In 1927 and 1928, the government reduced the procurement price of grain while maintaining high prices of industrial goods. In response, peasants started substituting away from grain to more favorably priced animal products and industrial crops or keeping harvested grain to themselves, either waiting for prices to rise again or using the grain as fodder. A crisis followed: procurement numbers were much lower than planned, and the urban food supply was in danger. Thus, to guarantee grain supply at below-market prices, the government had to seize control of production (Gregory and Mokhtari Reference Gregory1993; Kotkin Reference Kotkin2014, ch. 14).
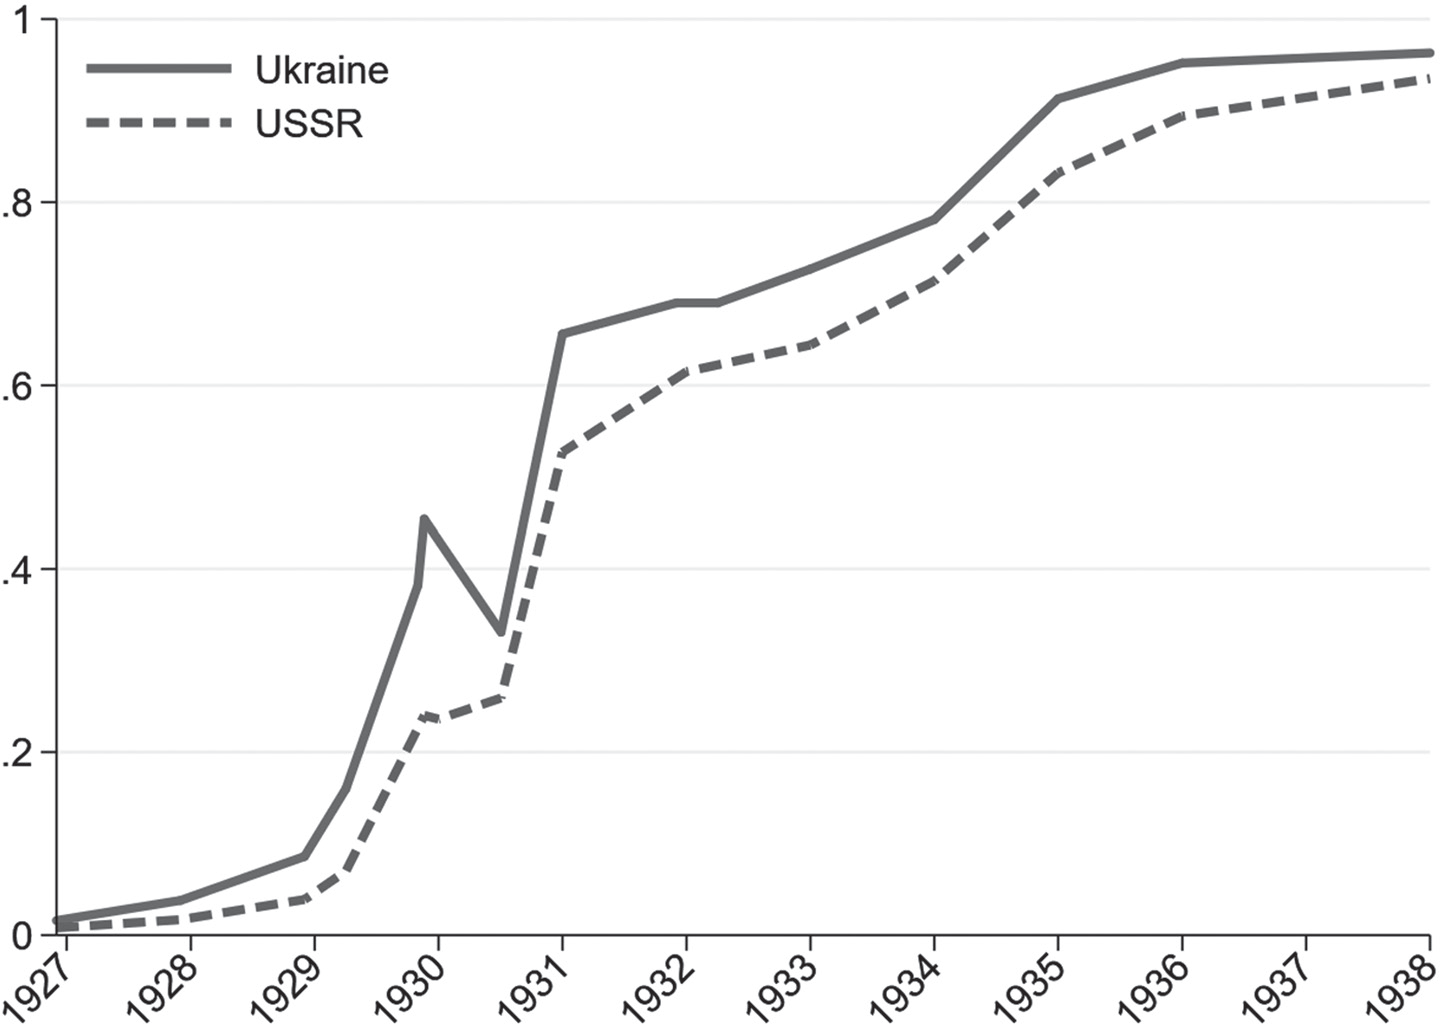
By the late 1920s, Stalin consolidated power within the Communist Party. In 1928, he launched the first five-year plan for the economic development of the Soviet Union. A year later, comprehensive collectivization and dekulakization (the liquidation of “kulaks,” relatively well-off peasants) campaigns were launched.Footnote 11 The Communist Party sent a massive number of Communists and Komsomol members to the countryside.Footnote 12 There, they employed all available methods to induce peasants to join collective farms, from promises of future prosperity, agronomists, and tractors, to open threats and coercion.Footnote 13 Peasants, attracted by the promises or scared by the threat of dekulakization, started joining collective farms. In Ukraine, the collectivization rate increased from a mere 3.8 percent in June 1928 to 8.5 percent in June 1929, to 16 percent in October 1929, and to 45 percent in May 1930 (see Figure 1). By 1932, 69 percent of rural households had joined collective farms, and 80 percent of the sown area was collectivized.
COLLECTIVIZATION RATE
Note: Share or rural households in collective farms.
Source: See notes to Appendix Table E1.

In collective farms, most of the land, livestock, and implements belonged to the collectives. Members did not decide what and when to plant—the government sent plans. Harvested grain was put directly into the collective farms’ storage. After the government took its share, the remaining produce was divided among the members. Often it was divided in proportion to the members’ family sizes, not to the amount of work done. Some private plots existed, but they were insufficient for subsistence. The remaining individual peasants were given the worst land, received extremely high procurement quotas, were in constant danger of being declared a “kulak” or a “kulak henchman,” and were generally harassed and abused by local officials. Private trade of foodstuffs was banned, and the government introduced a rationing system in the cities (Davies Reference Davies1980).
Economic policies of the late 1920s affected all aspects of food production and distribution in society. Production might have been impaired because the plans were often late and inconsistent with local conditions. Since government procurement was unpredictable, and the remaining collective produce was often divided according to the members’ family size, collective farm members’ wages depended less on effort and marginal productivity. Peasants sometimes slaughtered their livestock over giving it to the collectives, thus decreasing draught power.Footnote 14 Collective farm chairmen were punished for poor results and might have had incentives to over-report production.Footnote 15 Finally, since food distribution was mostly under government control, the government could have better supplied sectors of the economy it deemed more important.
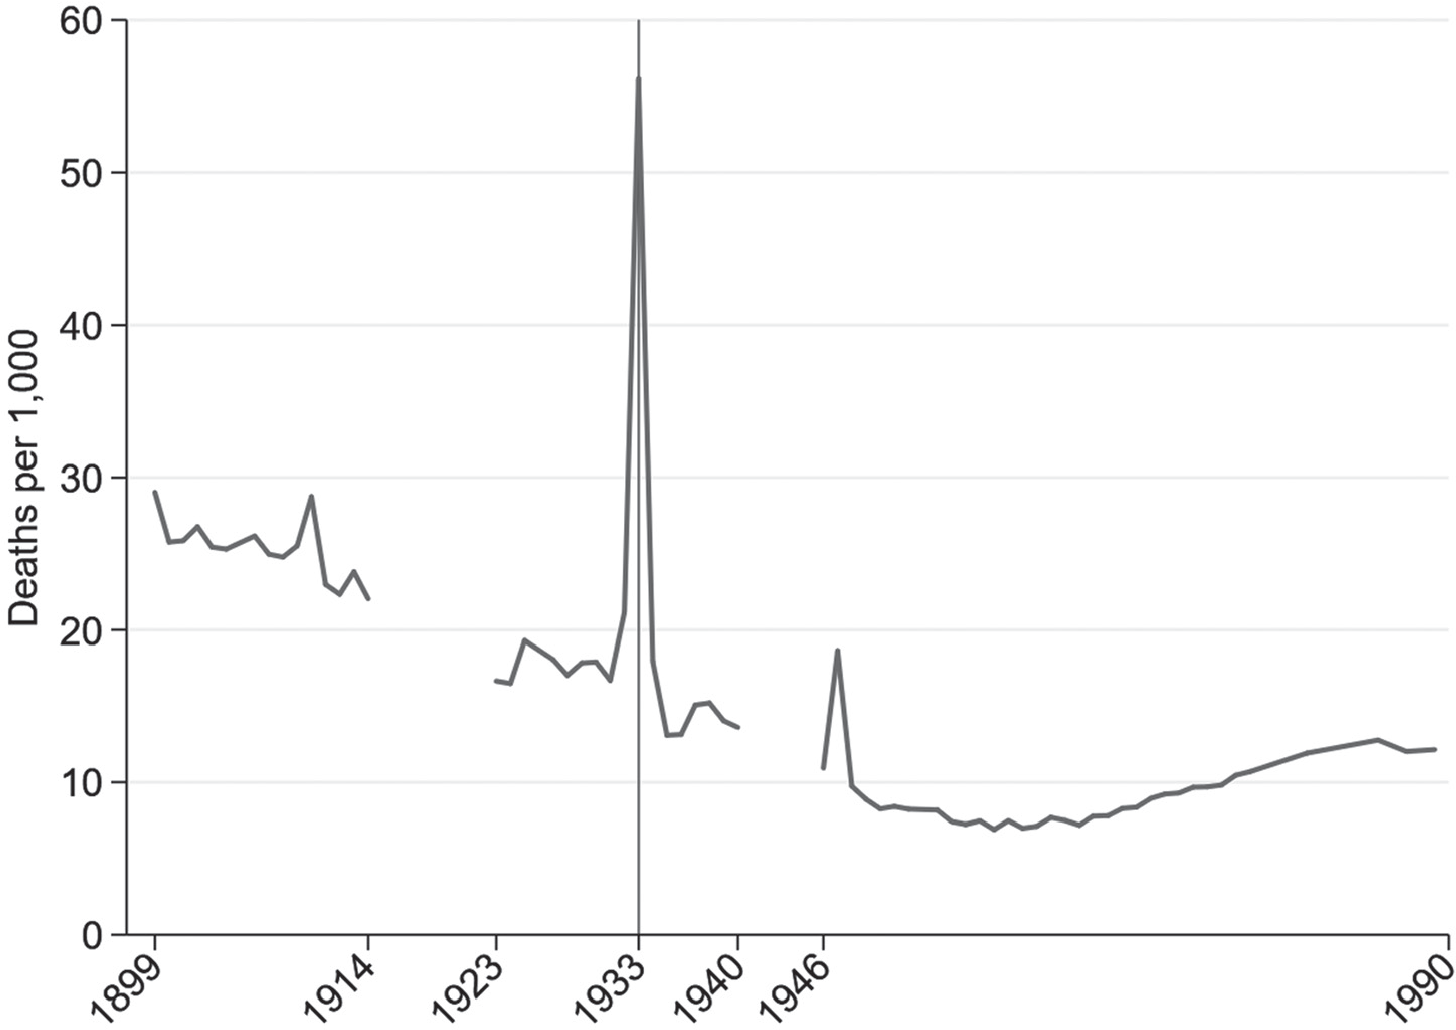
1930, the first year when the collectivized sector was a substantial share of agriculture, was a good year—the harvest was above average, and grain collection went smoothly. However, trouble followed in 1931 and 1932. By anecdotal accounts, the harvest was below expectations, and grain collection was difficult. The government was not willing to accept the low harvest estimates and made an extreme effort to procure as much grain as planned (Davies and Wheatcroft Reference Davies and Wheatcroft2004). People in the countryside started to starve. The famine peaked in the winter and spring of 1933, after the 1932 harvest. Figure 2 shows the average death rate in Ukraine from 1899 to 1990.Footnote 16 During the 1933 famine, the average mortality was more than triple the 1923–1931 level, spiking from roughly 18 per thousand to 56 per thousand.
MORTALITY IN UKRAINE
Note: Constant administrative borders.
Source: Author’s calculations.

In 1933, the government changed the system.Footnote 17 Procurement quotas would now be based on the sown area of the collective farm, and local officials were banned from imposing additional quotas. The collectivization campaign continued, and by 1939 almost all Soviet peasants had to work in collective farms. But while earlier government efforts aimed to collectivize all land and livestock, now collective farm members were allowed to keep a small private plot and some livestock, and, after paying taxes, to sell their private produce in the cities on “kolkhoz markets” with free prices. Thus, a subsidiary private economy was created, guaranteeing peasants subsistence. In 1934, in a direct reversal of early collectivization policies, the government launched a campaign to ensure that every collectivized household had a private cow. For decades to come, these small private holdings produced most of the vegetables and animal products available to Soviet citizens.Footnote 18,Footnote 19
DATA
I use three data sources: famine mortality from the archives in Moscow, historical weather reported by climatologists, and government policy proxies and prefamine economic characteristics from published statistical books, including the 1927 Soviet census.Footnote 20 Appendix Table E3 shows the exact source of every variable.
I collected 1933 district mortality data in the Russian State Archive of the Economy (RSAE).Footnote 21 These data were recently discovered by Stephen Wheatcroft in a secret part of the TsUNKhUFootnote 22 archives. In Belarus, Russia, and Ukraine, an elaborate system of civil acts registration was in place. Wheatcroft and Garnaut (Reference Wheatcroft and Garnaut2013) explain that, possibly due to unbelievably high provincial mortality figures, TsUNKhU demographers in Moscow requested original district data from province statisticians. Consequently, very fine disaggregated data survived in the archives in Moscow. While the crisis must have affected the quality of registration, Wheatcroft (Reference Wheatcroft2013) argues that the data are still sufficiently reliable.
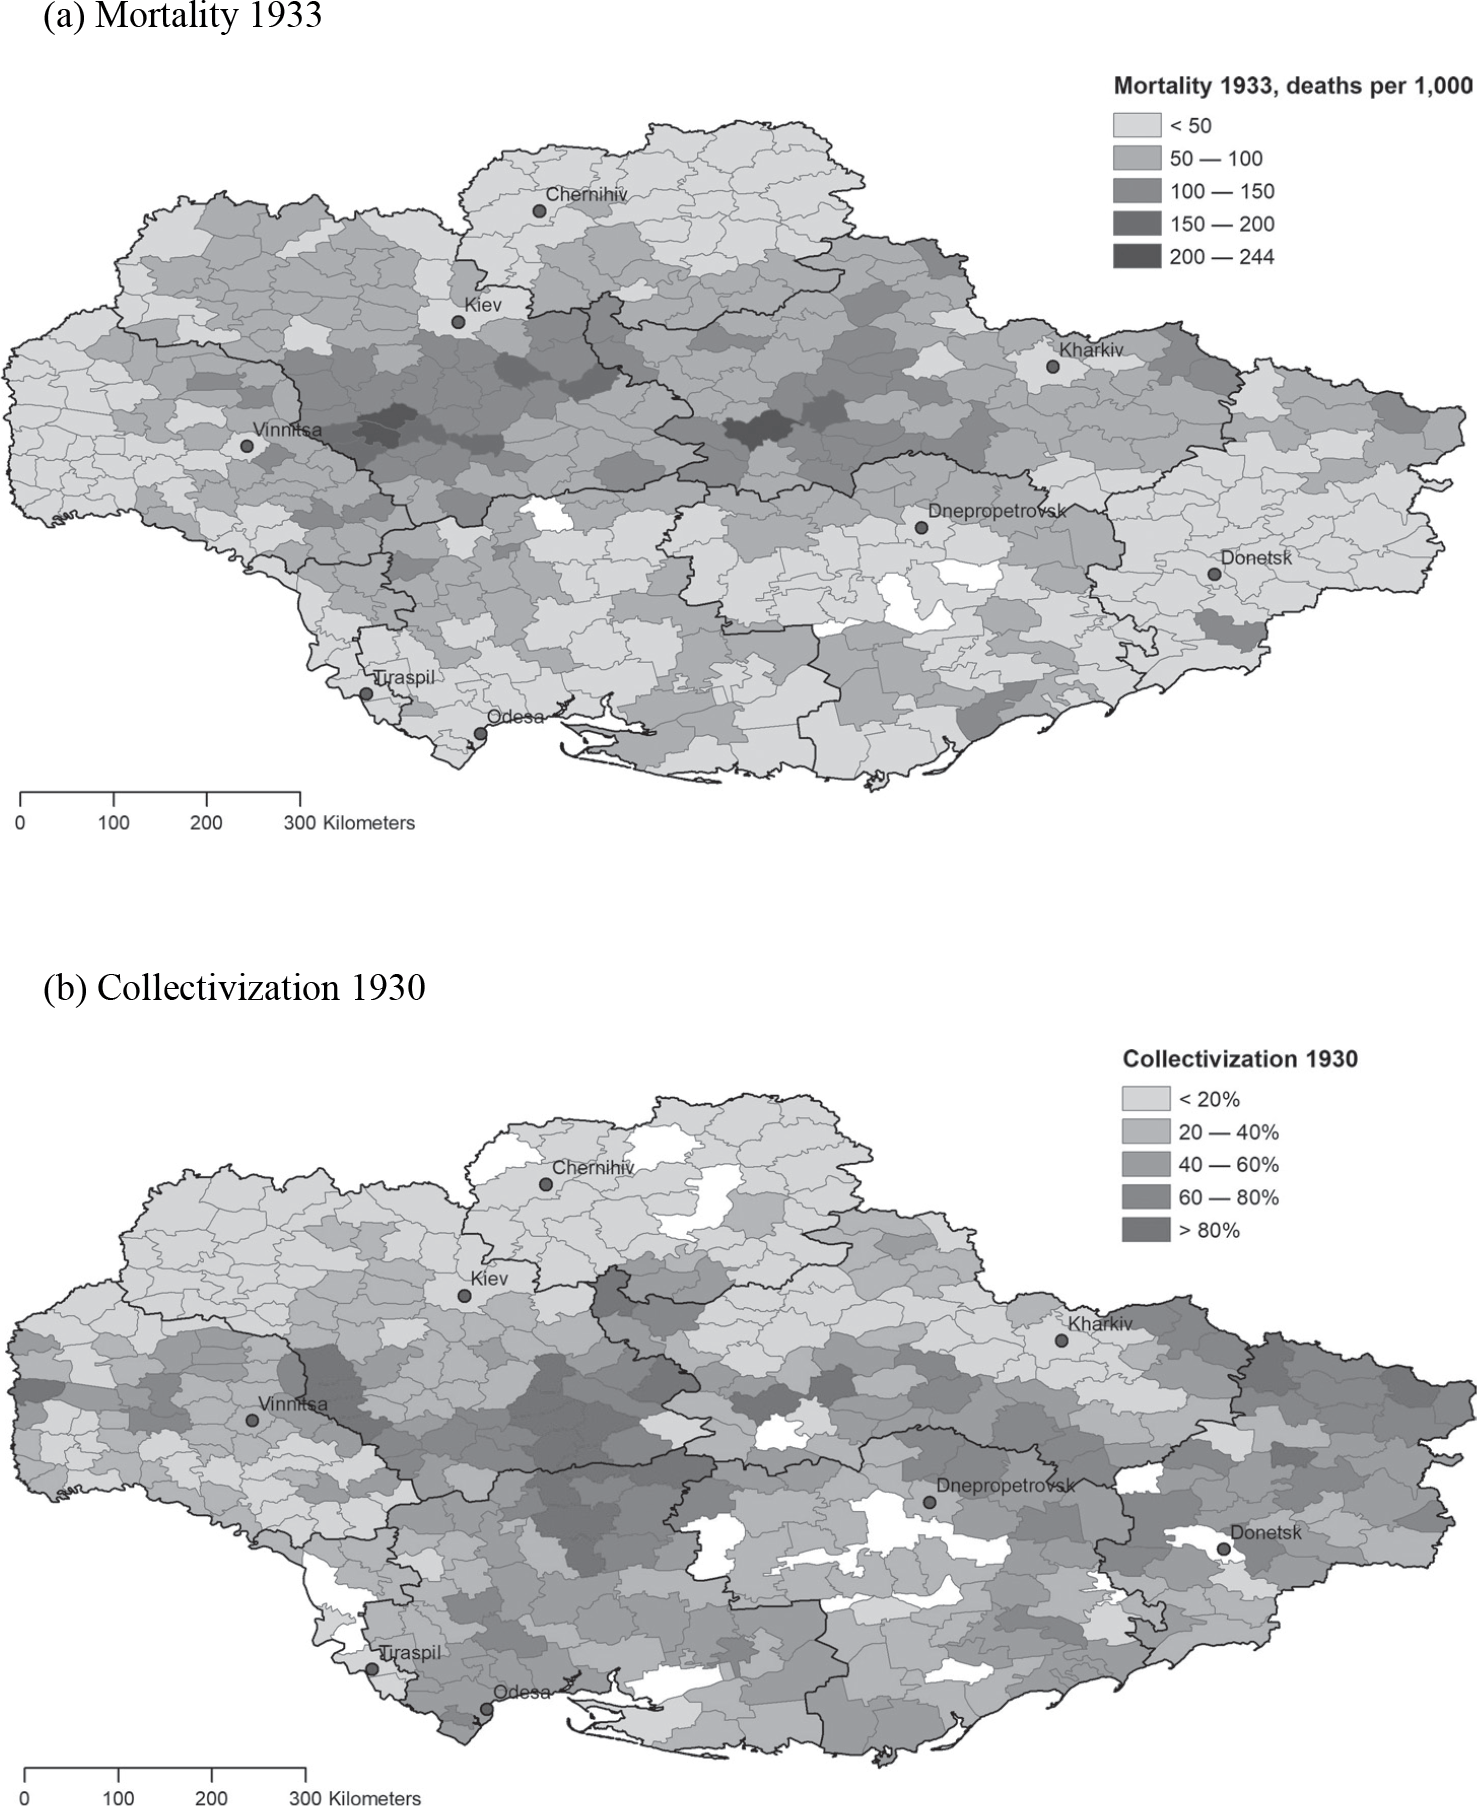
The 1933 district-level demographic data include average 1933 population; number of deaths, births, and the deaths of children younger than one year; and number of marriages and divorces. As a rule, whenever possible, deaths were attributed to the district where the person resided, not where they died, so mortality figures reflect the geographic distribution of the crisis. For Ukraine, there are two slightly different versions of the demographic data: the first includes in death figures only residents of the area, while the second adds all the dead with an unknown residence to the rural deaths of the district where they died.Footnote 23 I use the first version (RSAE 1562/329/18, p. 1–16), as the correlation between the two versions is 0.995.Footnote 24 I calculate mortality as the number of deaths divided by the average population and natality as the number of live births divided by the average population; Figure 3a maps 1933 mortality. It shows that within Ukraine, famine severity varied substantially and that traditionally grain-producing south-east (steppe) areas were not the ones hit the most.Footnote 25
MAPS OF EARLY COLLECTIVIZATION AND FAMINE MORTALITY IN UKRAINE
Note: Thick lines are province borders as of 1 January 1934.
Source: See Appendix Table E3.

Historical weather data are from professional climatologists Matsuura and Willmott (Reference Matsuura and Cort2014). They use raw weather station reports to provide average monthly temperature and total monthly precipitation on a 0.5×0.5-degree grid starting in 1900. For robustness checks and to go further back in time, I interpolate raw station reports from Rennie et al. (Reference Rennie2014) (monthly temperature only). The details are in Appendix B.4. I also consider daily weather station reports from Razuvaev et al. (Reference Razuvaev, Apasova, Martuganov, Vose and Steurer1993).
Historical weather data are less accurate than present-day data: Razuvaev et al. (Reference Razuvaev, Apasova, Martuganov, Vose and Steurer1993) and Rennie et al. (Reference Rennie2014) report information from fewer than 200 weather stations in the whole Soviet Union (the number of stations varied year to year, generally increasing with time). Interpolated historical weather is especially problematic for rugged areas (Dell Reference Dell2010). However, the territory of 1933 Ukraine is relatively flat, and these data are the best available now; recent works using them include Markevich and Zhuravskaya (Reference Markevich and Zhuravskaya2018) and Rozenas and Zhukov (Reference Rozenas and Zhukov2019).
The 1930 collectivization data come from published sources. In 1930, the disastrous famine was not yet anticipated, and many state organizations celebrated and advertised collectivization, publishing detailed statistics on its progress. As the primary source of collectivization data, I use a survey conducted on May 1, 1930, that covered the whole Soviet Union. From this survey, I collect district collectivization rates (share of rural households in collective farms) and the average number of households per collective farm in a district. Figure 3b maps 1930 collectivization rate. The Harvard Ukrainian Research Institute (HURI) kindly shared 1932 district collectivization rates with me, which I use for robustness checks.Footnote 26
From various statistical publications, I collected all other prefamine characteristics and policy proxies: the number of industrial workers in 1930, amount of agricultural equipment in 1925, and livestock and average long-term grain production as reported in 1925.Footnote 27 Data on population, urbanization, and ethnic composition come from the 1927 census, the most detailed and best published Soviet census. Using a digitized map of 1933 railroads, I calculate the distance to a railroad as the distance from the district centroid to the nearest railroad line. While most of Ukraine was considered fertile, a small Polissia (literally, forest) area in the north was closer to Belarus in its agroclimatic characteristics. I mark Polissia districts, some 10 percent of the Ukrainian territory, using the classification in the 1927 census. Administrative divisions changed from 1925 to 1927, to 1930, and to 1933. I use 1925, 1927, and 1933 maps to calculate data on 1933 administrative borders, and I match 1930 districts to 1933 districts by name; details are in Appendix A.1.
1927 and 1928 mortality comes from the Ukrainian statistical yearbooks published in 1928 and 1929. Unfortunately, no rural-urban division is available, and these data are more aggregated; only numbers for 41 larger regions were published.
Because I want to use both aggregated prefamine mortality and more detailed district data, I construct two datasets: a cross-section of 287 districts with information on 1933 mortality and all prefamine characteristics, and a short panel of 38 regions that includes information on 1927, 1928, and 1933 mortality. Appendix Table A1 reports summary statistics of all variables in both datasets. The average prefamine mortality in Ukraine was about 18 per 1,000, as compared to 59 per 1,000 in 1933. The 1930 collectivization rate was roughly 36 percent, but it varied from less than 3 percent to more than 90 percent. On average, the newly created collective farms consisted of some 90 households, but the size varied widely, from just 14 households to more than 500. In 1927, Ukraine was an agrarian republic; more than 80 percent of the population resided in the countryside. Few workers were employed in the crucial for the first five-year plan Group A industries—on average just eight per 1,000 district inhabitants. Most of the rural population had Ukrainian ethnicity, although some districts were predominantly Russian or German.
POLICIES AND MORTALITY

* = Significance at the 10 percent level.
** = Significance at the 5 percent level.
*** = Significance at the less than 1 percent level.
Notes: Standard errors are corrected for spatial correlation in a radius of 700 km. Baseline controls are average grain production per capita 1925, livestock per capita 1925, value of agricultural equipment per capita 1925, urbanization 1927, Polissia region indicator, rural literacy rate 1927, and rural population density 1927.
Sources: Section Data provides details on data construction, Appendix Table A1 shows summary statistics, and Appendix Table E3 lists the exact source of every variable.
Ukraine consisted of 392 districts and 41 regions, but because I combine many different sources, my final datasets include only 287 districts and 38 regions. Unlike other prefamine characteristics, information on birth and death rates, 1927 census data, and weather and soil quality are available for the whole Ukrainian territory. Appendix Table A2 compares the available characteristics of districts and regions in and out of the sample. In-sample districts have slightly higher mortality than out-of-sample districts, but in-sample regions have lower mortality than out-of-sample regions. This difference is driven by a few small districts with extremely high mortality that are averaged out in regions. Both in-sample districts and regions have higher birth rates than out-of-sample ones. Thus, the territories with the most extreme values (highest mortality, lowest natality), are to a large extent, out of the sample. More important, in-sample districts and regions have significantly lower urbanization rates and are located farther from railroads. This is because I do not have data on industry location around many large urban centers (see Appendix map A1a). Thus, all subsequent regressions probably underestimate the importance of industry, as for many industrialized areas, the information is missing. Finally, in-sample districts have fewer ethnic Russians (not surprising, because more Russians lived closer to urban areas), but more ethnic Germans, Jews, and other ethnicities. Thus, my sample is slightly more ethnically diverse than the whole of Ukraine.
SIZE OF COLLECTIVE FARMS AND MORTALITY: DISTRICT-LEVEL ESTIMATES

* = Significance at the 10 percent level.
** = Significance at the 5 percent level.
*** = Significance at the less than 1 percent level.
Notes: Standard errors are corrected for spatial correlation in a radius of 700 km. Baseline controls are average grain production per capita 1925, livestock per capita 1925, value of agricultural equipment per capita 1925, urbanization 1927, Polissia region indicator, rural literacy rate 1927, rural population density 1927, de-meaned June 1931 temperature, and de-meaned June 1932 precipitation.
Sources: Section Data provides details on data construction, Table A1 shows summary statistics, and Appendix Table E3 lists the exact source of every variable.
RESULTS
First, I look at the weather and aggregate grain production in Ukraine; after that, I analyze disaggregated district- and region-level data.
Weather and Grain Accounting
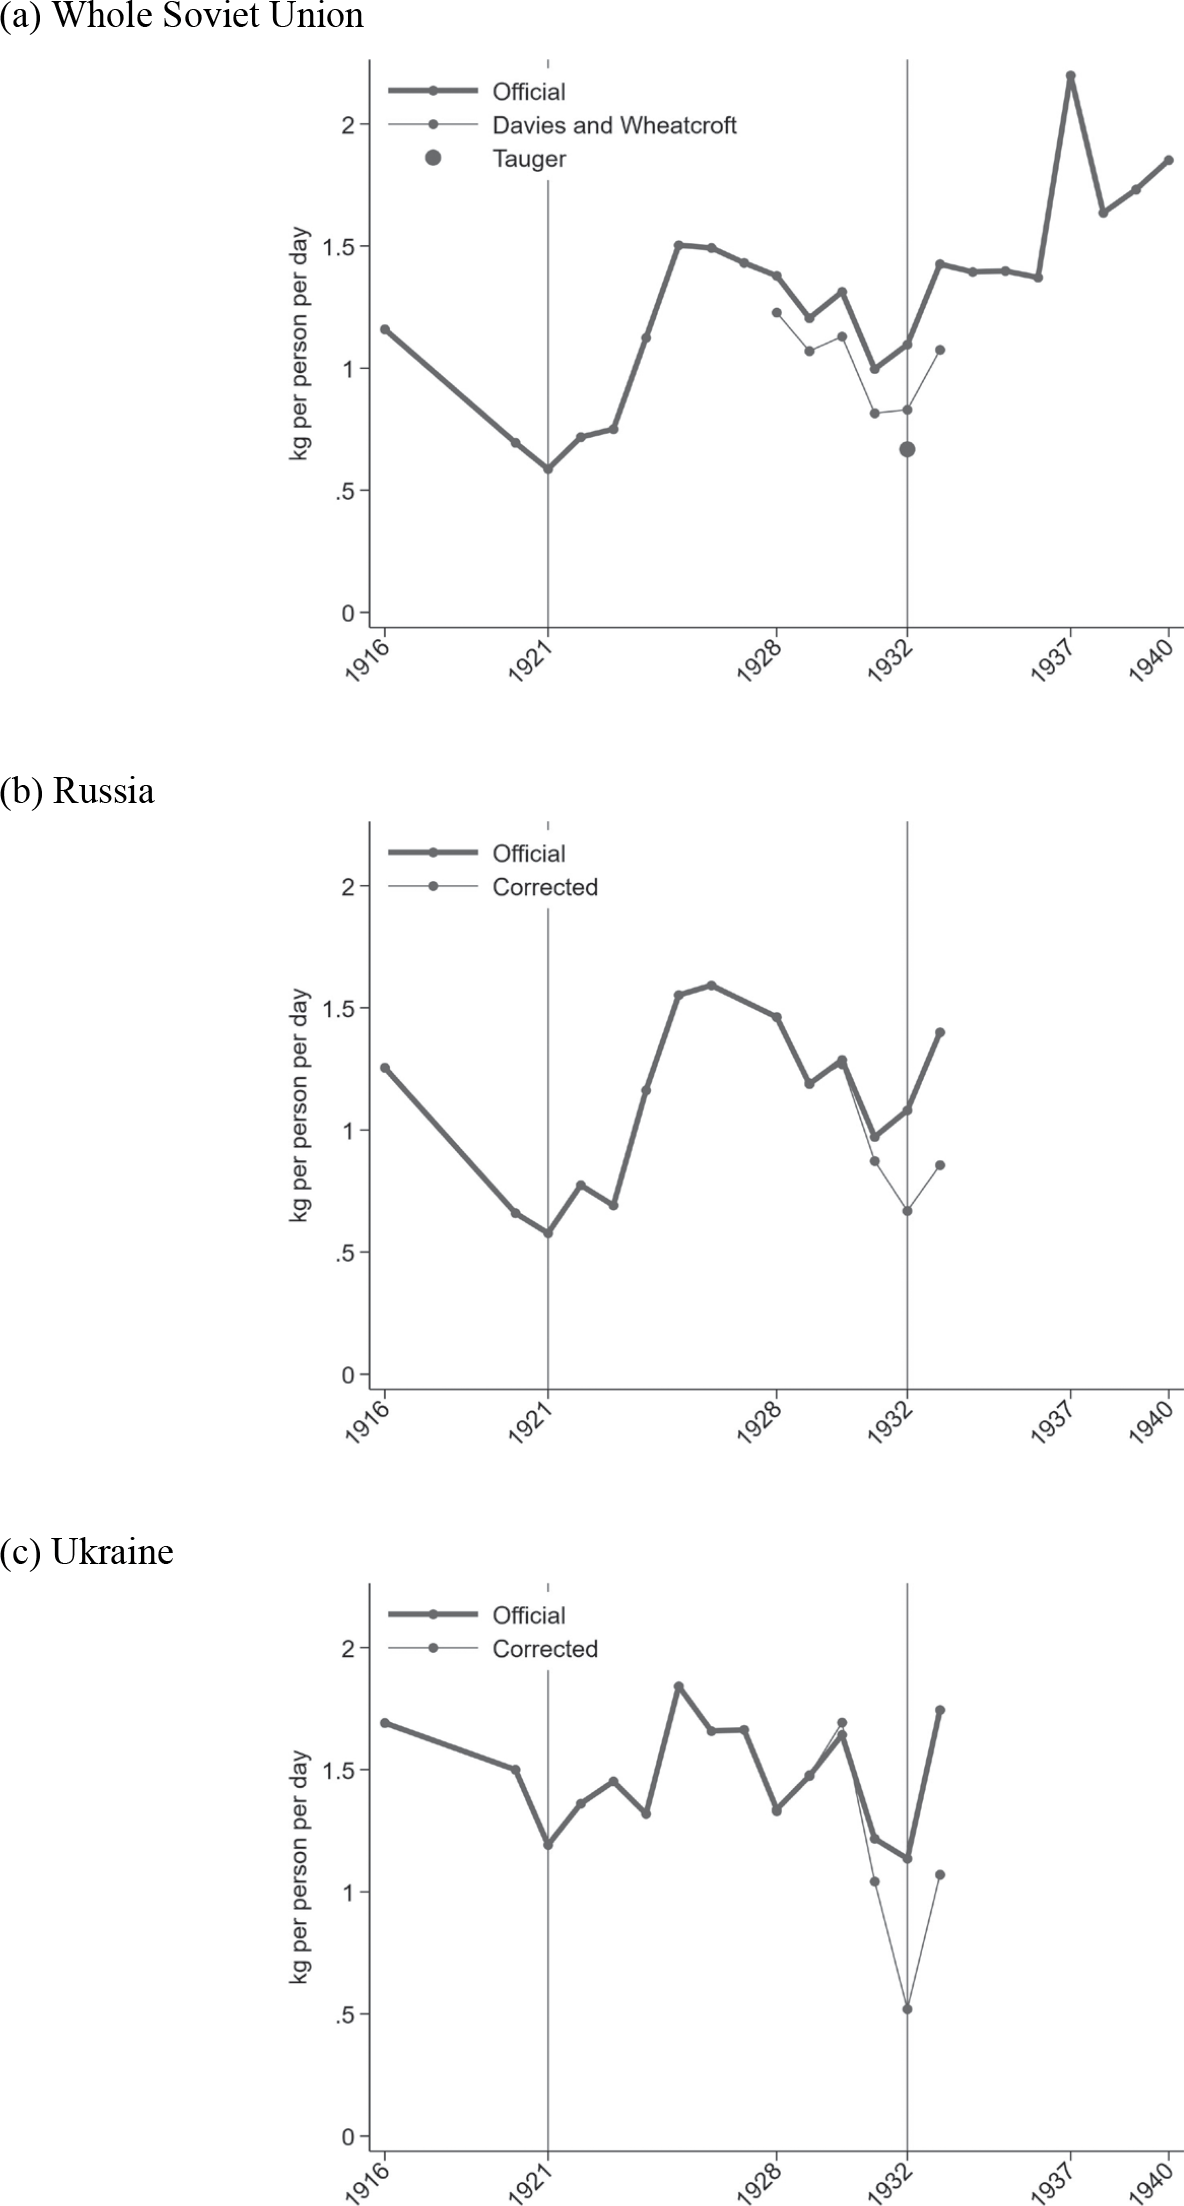
Most 1933 famine victims lived in the countryside. Figure 4 shows official 1916–1940 rural grain retention (harvest minus procurement) in the whole Soviet Union, Russia, and Ukraine. Footnote 28 The 1922–1923 and 1933 famines provide a useful comparison with other years. Consistent with the 1922–1923 famine, 1921 rural grain retention is extremely low, 0.6 kilograms per person per day. The epicenter of the 1922–1923 famine was the Volga region of Russia; Russian rural grain retention was 0.6 kilograms per person per day. By contrast, Ukraine had much higher retention in 1921 (1.2 kilograms per person per day) and was much less affected.
RURAL GRAIN RETENTION
Source: See notes to Appendix Table E2.

By anecdotal accounts, the 1933 famine was comparable to or worse than the 1922–1923 famine. Yet officially reported rural grain retention in the Soviet Union was much higher in 1932 than in 1921, 1.1 kilograms per person per day. Moreover, the officially reported 1932 retention is inconsistent with the geography of the famine: in 1933, Ukraine suffered as much as North Caucasus and the Volga region in Russia, but the officially reported rural grain retention in Ukraine (1.1 kilograms per person per day) if far above the 1921 starvation level of 0.6 kilograms per person per day, incompatible with the loss of almost 10 percent of the Ukrainian population.
Davies and Wheatcroft (Reference Davies and Wheatcroft2004) and Tauger (Reference Tauger2001) therefore argue that the government inflated grain production figures and offer their corrections. Footnote 29 So, in addition to the official data, Figure 4a shows rural grain retention based on their harvest estimates. Footnote 30 Since Davies and Wheatcroft (Reference Davies and Wheatcroft2004) and Tauger (Reference Tauger2001) do not offer corrections for separate Soviet republics, I roughly follow Tauger and use available archival data to calculate corrected harvests for Russia and Ukraine. Figures 4b and 4c show corrected rural grain retention for Russia and Ukraine; notes to Appendix Table E2 describe my calculations. The corrected figures are more consistent with the severity and geography of the 1933 famine: the corrected 1932 rural grain retention is 0.7 kilograms per person per day in Russia and 0.5 kilograms per person per day in Ukraine, consistent with parts of Russia and most of Ukraine starving in 1933. All my corrections, however, are based on scant archival evidence; it is impossible to know how close they are to the truth.
Unlike in the early 1920s, the sown area did not decrease dramatically in the years preceding the 1933 famine. Footnote 31 Therefore, other factors must have generated the presumed gap between the officially reported harvest and the true harvest.
Davies and Wheatcroft (Reference Davies and Wheatcroft2004) argue that the official harvest estimates ignored bad weather. According to them, in 1931, spring was late and cold, and that there was a severe drought in June, especially in West Siberia, the Urals, and the Volga region of Russia. Footnote 32 The spring of 1932 was again late and cold, and June was too hot again, although probably less bad than the drought of 1931. Torrential rains occurred in the Kiev region in July 1932, undermining the harvesting of winter grains. By contrast, Tauger argues that precipitation in 1932 should have been beneficial for grain (Tauger Reference Tauger2001, p. 12), were it not for the widespread grain diseases and pests. He claims that rust, smut, ergot, locusts, meadow moths, and mice destroyed a large share of the 1932 harvest. Remarkably, the authors emphasize different negative factors as the main explanation of the presumed poor harvest. They also disagree on the true size of the 1932 harvest. This highlights how difficult it is to quantify the importance of different environmental factors from predominantly qualitative and narrative sources.
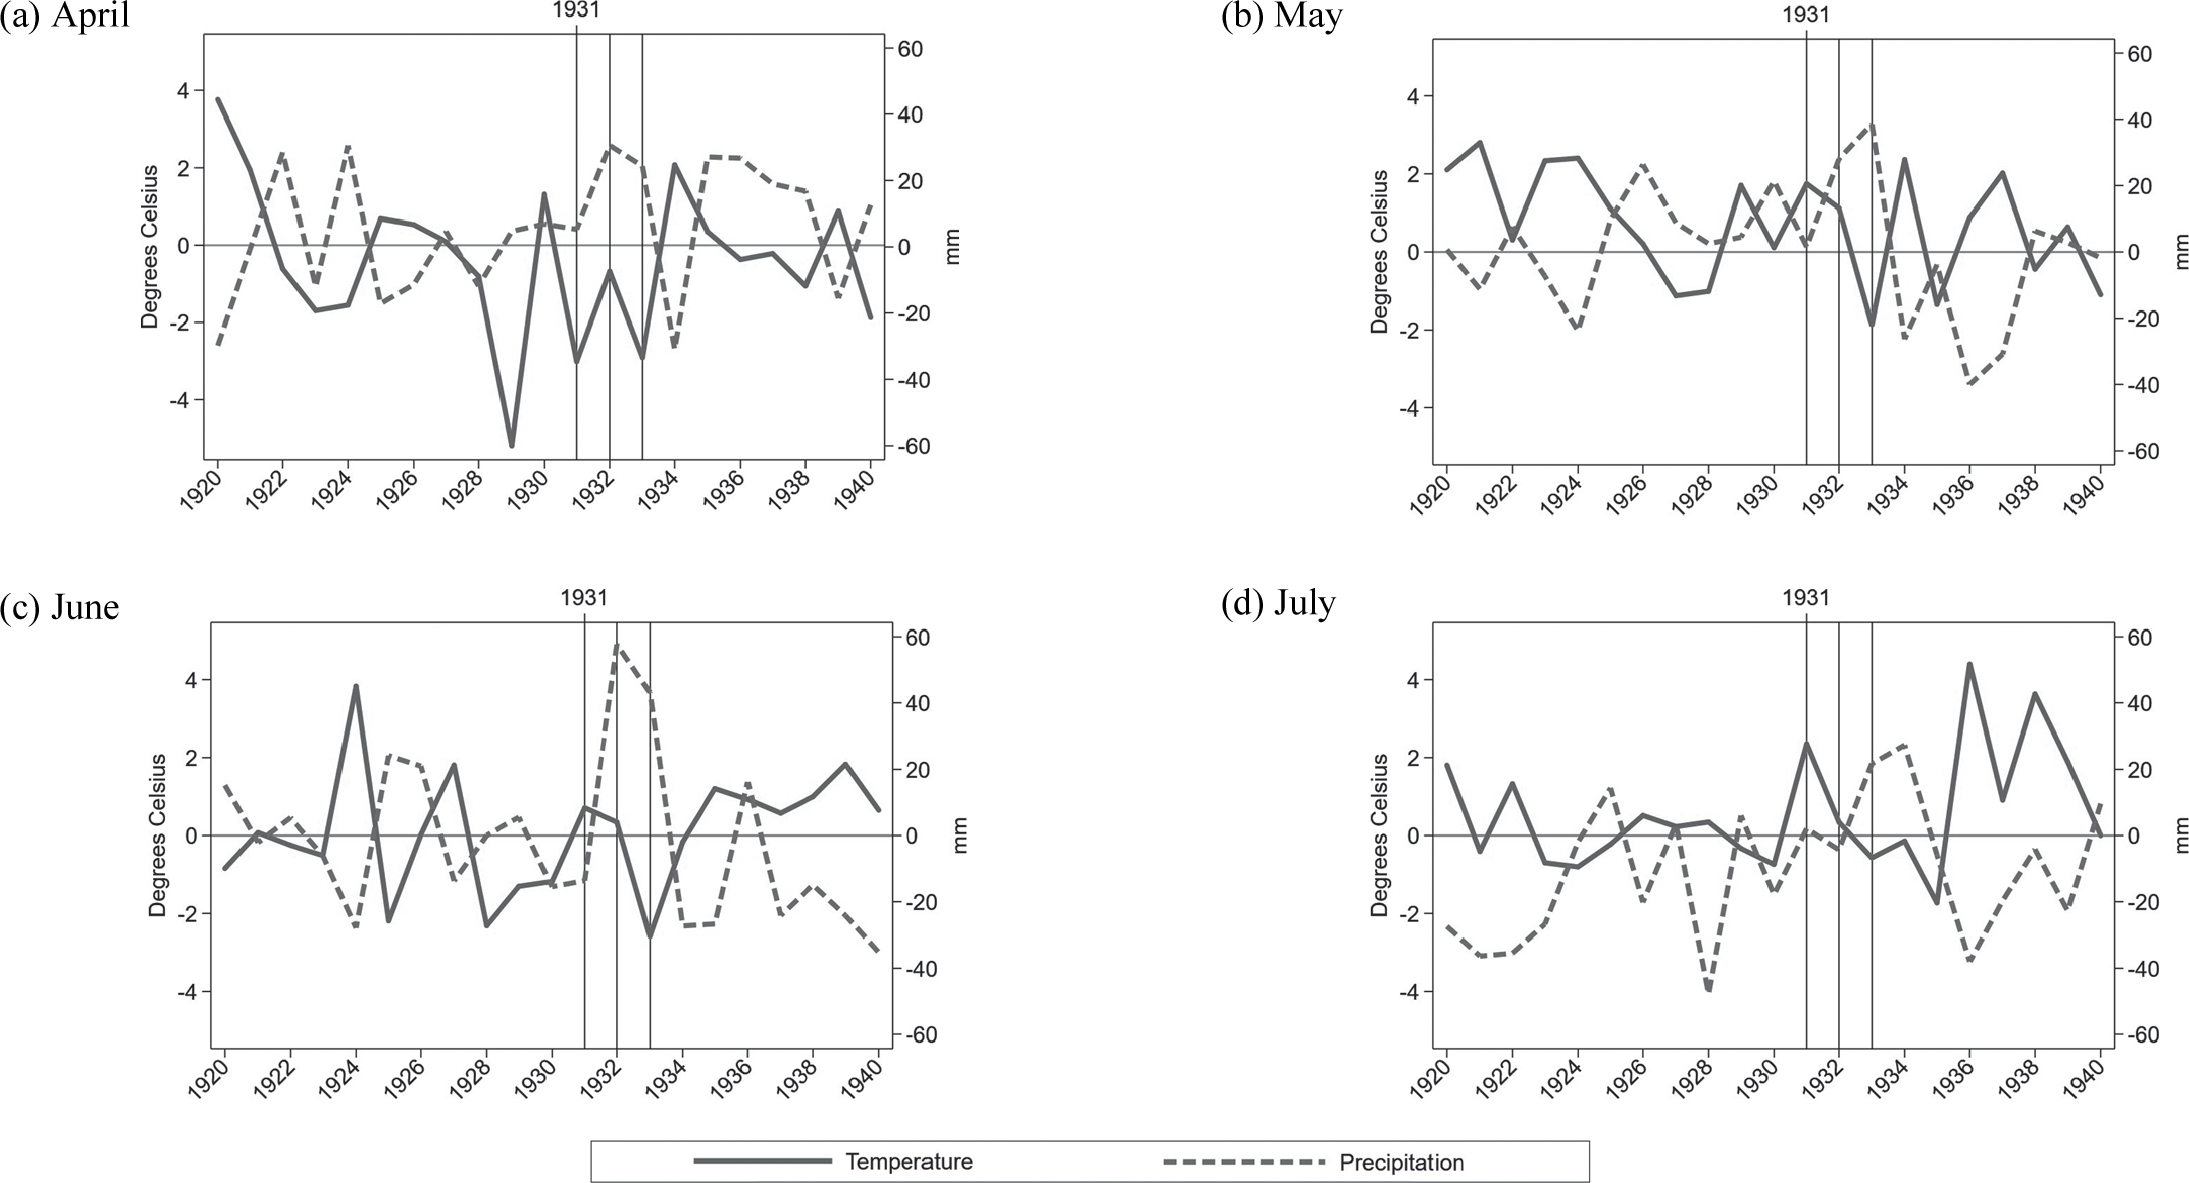
To see which of the above temperature and rainfall shocks occurred in Ukraine, I first look at monthly weather data. Figure 5 plots de-meaned temperature and precipitation from 1920 to 1940 for April, May, June, and July. That is, for each year from 1920 to 1940 for each month, it presents the difference between the month’s temperature and precipitation and the 1910–1950 average. Footnote 33 It demonstrates that 1931 and 1932 weather was close to average with one exception: in May and June 1932, rainfall was significantly higher than average. However, rainfall in May and June 1933 was similar to the 1932 levels (May 1933 slightly higher than 1932, June 1933 slightly lower), and historians (including Davies and Wheatcroft, although, remarkably, not Tauger) agree that the 1933 harvest was good. Footnote 34
DE-MEANED TEMPERATURE AND PRECIPITATION IN UKRAINE
Notes: De-meaned temperature (precipitation) is the difference between the reported temperature (precipitation) and the average temperature (precipitation) from 1910 to 1950. Appendix Figure B4 presents these data for all months of the year.
Source: Terre striai Air Temperature and Precipitation: 1900-2014 Gridded Monthly Time Series, Version 4.01, Matsuura and Willmott (Reference Matsuura and Cort2014).

One might argue that temperature and precipitation for all of Ukraine may not reflect the severity of the drought or rainfall if only a small share of the Ukrainian territory was affected by the presumed shock. In that case, temperature and precipitation would be close to normal and would not reflect the extent of the disaster. However, if only a small area was affected, then the impact on the total harvest should have been small as well. And, if much of the Ukrainian territory suffered, this should have been reflected in the temperature and precipitation figures.
Another concern is that the monthly temperature and precipitation figures could mask poor weather. For example, if half of June was extremely hot and dry, and the other half was very cold and rainy, then the reported monthly averages might look normal. To address this concern, Appendix B.3 studies available daily weather data. Overall, daily data are consistent with monthly averages.
It is, however, difficult to assess how good or bad the weather was from raw monthly averages: while no factor seems too extreme, maybe the combination was particularly bad for grain. Footnote 35 The best way to analyze the weather is to predict how much grain would have been produced in Ukraine had only the weather changed in 1931 and 1932 compared to the previous years, with no reforms affecting the rural economy. I use 1901–1915 weather and harvest data from 52 Russian provinces and estimate the relationship between province area, FAO GAEZ grain suitability index, fall (October–December), winter (January–March), spring (April–June), and summer (July–September) temperature and precipitation, their square terms and pairwise interactions, and harvest. I then predict how much grain should have been produced in Ukraine from 1916 to 1936. Thus, I estimate how good or bad the weather was, keeping all other factors fixed. Footnote 36
Figure 6 plots the reported and predicted Ukrainian harvests with a 95 percent confidence interval. Footnote 37 There are three important takeaways. First, starting in 1926, the reported harvest is very close to the predicted harvest. Thus, consistent with Gregory (Reference Gregory1994) and Markevich and Harrison (Reference Markevich and Mark2011), by the second half of the 1920s, agricultural production appears to have recovered from the shocks of WWI, the civil war, and the 1921–1923 famine. Moreover, Soviet statisticians appear to have taken the weather into consideration when they estimated harvest. Second, the predicted harvests in 1931 and 1932 are very close to the reported 1924–1929 average. 1931 seems similar to the 1926–1927, not too bad, not exceptionally great. 1932 seems more similar to 1928, not that good, but not exceptionally bad either. If anything, 1924 and 1934 seem worse, but no famines occurred after 1924 or 1934. Third, if there was a gap between the officially reported harvest and the true harvest (and there must have been, otherwise rural retention is too high), in Ukraine, this gap is not predicted by the weather. Footnote 38
REPORTED AND PREDICTED HARVEST IN UKRAINE
Sources: Reported harvest, see notes to Appendix Table E2. Predicted harvest, see Appendix Section Predicted Harvest.

Unfortunately, it is impossible to directly quantify the presumed damage from pests and grain diseases. To the extent that weather is conducive to their spread, the weather predicts harvest very close to the officially reported. If pests and diseases spread independently of weather, the available data do not allow quantification of the damage they caused. Instead, Appendix B.5 studies how often published archival documents discussed famine, weather, grain diseases and pests, and effort and organization. It shows that weather or pests were not discussed more than usual in the years leading up to the 1933 famine.
To conclude, the available weather data do not support claims of exceptionally poor weather in Ukraine. Grosfeld, Sakalli, and Zhuravskaya (Reference Grosfeld, Sakalli and Zhuravskaya2019) argue that the single best predictor of crop failure in the Russian Empire is exceptionally hot April–June weather. Similarly, Stephen Wheatcroft, in a series of books, papers, and talks, emphasizes the drought of 1931. Yet, there is no evidence of severe drought in Ukraine. There is also no evidence of exceptionally strong rains in July 1932. Precipitation was high in June, not July, but while the weather was not great in 1932 (the 1932 harvest is lower than the 1930 harvest), the predicted harvest alone is not bad enough to have generated a famine.
Government Policies
Since the aggregate weather does not seem disastrous enough to have caused the famine, next, I turn to government policies. I study three policies that could have affected food production, procurement, and distribution. First, to examine the impact on production, and ultimately on mortality, I consider the collectivization rate, that is, the share of rural households in collective farms in 1930. Second, since no reliable disaggregated procurement figures are available, I use distance to a railroad as a proxy for grain procurement. Presumably, the closer an area was to a railroad, the cheaper it was to extract grain from it. Third, to investigate how food distribution affected mortality, I study the relationship between the number of workers employed in Group A industries and mortality. Group A industries were the industries producing “means of production”: arms, coal, steel, and the like, as opposed to Group B industries producing consumer goods. Because Group A factories were deemed important for industrialization and implementation of the first five-year plan, they had a higher chance of being placed on a priority supply list.
Because 1933 mortality, policy measures, and prefamine characteristics are available for Ukrainian districts, but 1927 and 1928 mortality is available only for larger regions, two empirical approaches are possible: studying the relationship between policies and mortality on a crosssection of smaller districts, or using a difference-in-differences approach on a short panel of larger regions.
On the cross-section of 287 districts, I estimate the following specification:
 $$mortalit{y_d} = \beta polic{y_d} + {X'_d}\gamma + {\alpha _p} + {\varepsilon _d},$$
where d stands for district, p for province where the district is located, mortalityd for district mortality in 1933, policyd for measure of intensity of the government policy in district d, Xd for a vector of district-specific characteristics, αp for province fixed effect, and ɛd is an error term.
There are two main challenges to this specification. First, reverse causality—the observed relationship between policy and mortality may be a result of the famine, instead of policies increasing mortality. For example, the threat of famine could induce peasants to join collective farms. However, all policies are measured in 1930, when the famine was not yet anticipated, so this concern can be eliminated. A more serious problem is omitted variable bias: the relationship between policies and mortality may be driven by some omitted factor correlated with the intensity of the policy. For example, the government attempted to collectivize more productive and, therefore, richer rural areas first, so if wealth is not considered, the estimated relationship between collectivization and mortality may be biased downward. Footnote 39
To account for possible omitted variable bias, I control for prefamine characteristics that could have had a direct effect on mortality in 1933 and could have been correlated with the intensity of the policies: food sources (average grain production per capita in 1925, livestock per capita in 1925), and wealth and economic development (value of agricultural equipment per capita in 1925, rural literacy rate in 1927, urbanization in 1927, and rural population density in 1927). To account for varying agroclimatic conditions, I also include a Polissia region indicator in the controls.
Finally, to illuminate the contrast between policies and weather, all estimates control for de-meaned June 1931 temperature and de-meaned June 1932 precipitation. The identifying assumption is that, if not for varying exposure to government policies, districts with similar prefamine characteristics and similar weather should have had similar mortality in 1933.
For comparison, I also estimate the relationship between policies and mortality on the cross-section of regions. I do not include province fixed effects: there are just 38 regions in my sample, and regions do not fit into subsequently created provinces—many were split between two or three provinces.
Next, on the panel of regions, I estimate a difference-in-differences specification:
 $$mortalit{y_{i,t}} = \beta polic{y_i}I_t^{fam} + {X'_i}I_t^{fam}\gamma + {\alpha _i} + {\tau _t} + {\varepsilon _{i,t}},$$
where i stands for region, t stands for year (1927, 1928, and 1933), mortalityi,t is mortality in region i, in year t, policyiIt fam is a policy measure interacted with a famine indicator that equals one in 1933 and zero otherwise, X’iIt fam are region characteristics interacted again with a famine indicator, αi and τ i are region and year fixed effects, and ɛi,t is an error term. Region characteristics Xi are the same as district characteristics, except weather: I take advantage of the panel structure and control for twice lagged de-meaned June temperature and once lagged de-meaned June precipitation. The identifying assumption is that, if not for the difference in policy intensities, the change in mortality from nonfamine years to the famine year would have been similar among regions with similar characteristics and similar weather.
Nearby districts and regions share similar characteristics; this spatial correlation might inflate the statistical significance of the estimates (Conley Reference Conley1999). Kelly (Reference Kelly2019) argues that we should adjust for a larger spatial correlation than we used to. Therefore, in all estimates, I correct standard errors, allowing for spatial correlation within a radius of 700 kilometers, roughly the north-south distance of 1933 Ukraine, or more than two-thirds of the east-west distance.
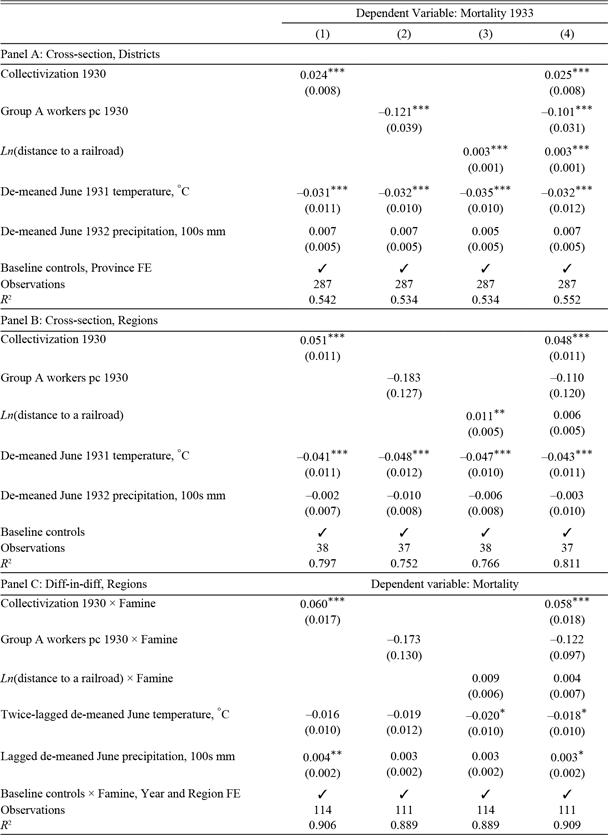
Table 1 Panel A reports the cross-section estimates of the relationship between government policies and mortality on a sample of districts using Model (1). Column (1) shows the relationship between the collectivization rate in 1930 and mortality in 1933. The collectivization coefficient is positive and highly statistically significant (p-value below 0.1 percent). Moreover, it is nontrivial in magnitude: one standard deviation increase in collectivization rate (22 percent increase) raises 1933 mortality by 0.14 of a standard deviation, or by 5.4 people per 1,000. This is a sizable effect, given that mortality in nonfamine years was around 18 per 1,000. Appendix Figure C1a plots conditional scatter plot and fitted values corresponding to the estimates in Column (1) and demonstrates that the relationship between collectivization and mortality is not driven by one observation or group of observations.
Table 1. Panel A Column (2) reports the relationship between Group A workers per capita in 1930 and mortality in 1933. More Group A workers per capita reduced 1933 mortality; the coefficient is highly statistically significant, and the magnitude is also not negligible: one standard deviation increase in the number of Group A workers per capita (32 more Group A workers per 1,000 people) reduces mortality by 0.10 of a standard deviation, or by 3.8 people per 1,000. Appendix Figure C1b plots the corresponding conditional scatter plot and fitted values and demonstrates that, unlike collectivization, the relationship between Group A workers and mortality is driven by the relatively few districts that had Group A workers. This is not surprising, given that most districts in the sample had no Group A industries.
Table 1. Panel A Column (3) estimates the relationship between log distance to a railroad and 1933 mortality. Surprisingly, the coefficient is positive—if anything, being located farther from a railroad increased famine mortality. Railroads played a dual role: on the one hand, they facilitated grain procurement, on the other—allowed starving peasants to escape, so the aggregated effect is ambiguous.
Finally, Table 1 Panel A Column (4) includes all three policy intensity measures on the right-hand side of the regression. The estimated coefficients are similar to the ones reported in Columns (1) to (3), in both statistical significance and magnitude: collectivization increases 1933 mortality, Group A workers decrease mortality, and distance to a railroad increases mortality.
Next, for comparison, Table 1 Panel B reports the estimates of the relationship between policies and mortality on a cross-section of regions. There are three important differences. First, the collectivization coefficient increases: one standard deviation increase in collectivization rate (18 percent increase) raises 1933 mortality by 0.33 of a standard deviation, or by 9 people per 1,000. There are two explanations for this increase: (1) without province fixed effects, there is more useful variation in collectivization rates and in baseline region characteristics, and (2) measurement error is smaller in larger regions. The second important difference is that Group A workers per capita coefficient loses statistical significance. Possibly, this is because few districts have many Group A workers, and when data are aggregated to regions, there is little variation in the industry composition. The third difference is that on the crosssection of regions, no strong relationship exists between distance to a railroad and mortality in 1933.
Finally, Table 1 Panel C presents the estimates using a difference-in-differences Specification (2). The collectivization coefficient is even larger than the one presented in Panel B: one standard deviation increase in collectivization rate (18 percent increase) raises 1933 mortality by 0.37 of a standard deviation, or by 10 people per 1,000. Appendix Figure C2 shows the relationship between collectivization and mortality for 1927 and 1928, and in 1933 conditional on baseline controls. It demonstrates that 1927 and 1928 mortality and future collectivization are not correlated and that a strong positive correlation exists between collectivization and 1933 mortality. The increase of the collectivization coefficient from the cross-section to difference-in-differences specification means that region fixed effects indeed help to better account for unobserved differences in wealth and economic development. Next, the Group A workers coefficient remains negative, and the distance-to-a-railroad coefficient remains positive, but neither is statistically significant. To conclude, the estimates obtained with the most demanding difference-in-differences specification suggest that collectivization had a large impact on famine mortality.
All estimates in Table 1 control for the reportedly bad weather: de-meaned June 1931 temperature and de-meaned June 1932 precipitation. In all specifications, higher June 1931 temperature is associated with lower famine mortality, demonstrating again that the presumed drought of June 1931 did not directly lead to higher mortality in Ukraine. Higher June 1932 precipitation does increase mortality—the coefficient is positive and marginally statistically significant in the difference-indifferences specification (Panel C). However, it is small in magnitude: one standard deviation increase in precipitation (increase by 23 mm) raises 1933 mortality by 0.02 of a standard deviation, or by 0.69 people per 1,000. Footnote 40,Footnote 41
I follow Meng, Qian, and Yared (Reference Meng, Qian and Yared2015) to estimate how many excess deaths are explained by government policies and the weather (Appendix Table C13 shows the estimates). First, deaths if no famine is the number of deaths in my sample if mortality was as in 1927–1928. Second, reported deaths is the number of reported 1933 deaths in my sample; and therefore, excess deaths is the number of deaths above the no-famine benchmark, the difference between reported deaths and deaths if no famine (not shown). Third, predicted deaths is the sum of predicted (from the models in Table 1 Column (4)) mortality rates multiplied by the 1933 population. Predicted deaths are close to reported deaths—the model fits the data well. Fourth, I construct alternative policy scenarios: (a) I predict mortality rates for a zero collectivization rate (thus calculating the number of deaths that would have occurred if the weather and all government policies were the same but agriculture was not collectivized), (b) I predict mortality rates if each district had 0.025 Group A workers per capita (thus calculating the number of deaths that would have occurred if there were more Group A workers but weather and all other policies were the same), and (c) I combine (a) and (b), predicting mortality for a zero collectivization rate and 0.025 Group A workers per capita. Footnote 42 The decrease in excess deaths in these alternative scenarios relative to the actual excess deaths is the share of excess deaths explained. As Table C13 shows, collectivization explains up to 52 percent of excess deaths, having few Group A workers explains up to 5.9 percent of excess deaths (but this depends on the random benchmark of 0.025 Group A workers per capita that I picked), and the two policies combined explain up to 57 percent of excess deaths.
I also consider how many deaths the weather can explain. Because the June 1931 temperature decreases mortality, to calculate the maximum possible impact of the weather, I concentrate only on June 1932 precipitation. I calculate how many deaths there would have been had the government policies remained unchanged, but June 1932 rainfall was equal to the long-term average (that is, de-meaned June 1932 precipitation was zero). Table C13 shows that rain explains up to 8.1 percent of excess deaths. Thus, the famine appears to be chiefly the result of government policies and not the weather.
Mechanisms: Why Collectivization Increased Mortality
There are two main (not mutually exclusive) potential mechanisms: the government might have extracted relatively more grain from collectives, and collective farms could have been less productive. Footnote 43
As the crisis unfolded, the quality of accounting and reporting deteriorated. So, unfortunately, little reliable disaggregated information on grain procurement is available. The one often cited archival document states that in Ukraine in 1930, 27.9 percent of the harvest was extracted from collectives and 30.3 percent from individual peasants; in 1931, 42.8 percent was extracted from collectives and 32.4 percent from individual peasants; and in 1932, 45.1 percent was extracted from collectives and 40.6 percent from individual peasants. Footnote 44 Thus, in the two years preceding the famine, a higher share of harvest was extracted from collectives.
At the same time, individual peasants were moved to the worst land and their sown area dropped disproportionally (in 1932, 69 percent of rural households were in collectives, but 80 percent of sown area was collectivized, Appendix Table E1). Therefore, while high procurement must have contributed to the famine, it is hard to tell if relatively more grain per capita was extracted from collective farm members or from the remaining individual peasants.
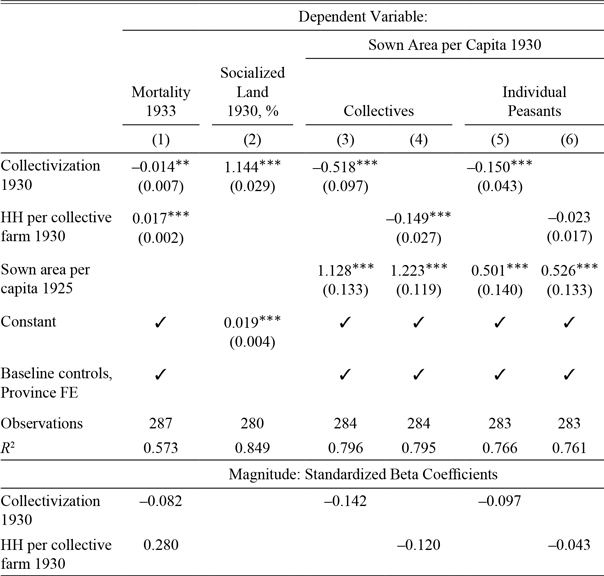
Next, I consider the impact of collectivization on production. Unfortunately, there is no disaggregated data on collective farms’ output, and even the available aggregate figures are debated among historians, so I must rely on indirect evidence. Collective farms varied in size, from just 14 households per farm to more than 500, so I investigate the relationship between collective farm size and mortality. Table 2 Column (1) estimates Specification (1) adding the average size of collective farms to the controls. The collectivization coefficient becomes negative and statistically significant, although small in magnitude. This may be because the government tried to collectivize wealthier, more productive areas first, and other crosssection controls do not fully capture the wealth. More important, the size of collective farms is what drives 1933 mortality up. One standard deviation increase in the collective farm size (66 more households per kolkhoz) increases mortality by 0.28 of a standard deviation, or by 11 people per 1,000. Footnote 45 One explanation is that the larger the collective, the more difficult it was to manage and monitor the effort and quality of the members’ work.
An alternative explanation is that the effect of collective farm size is driven by the members being crammed on a tiny plot of land. To investigate this, I regress the share of socialized land on the collectivization rate in 1930. Table 2 Column (2) reports the estimates. Footnote 46 If the land was divided proportionally among individual peasants and collective farm members, the constant should be zero, and the slope coefficient should be equal to one. However, the constant is positive, and the slope coefficient is statistically significantly larger than one. That is, collective farm members on average had 1.9 percent more land (the constant coefficient equals 0.019), and the higher the collectivization rate was, the more additional land collective farm members had (the slope coefficient is greater than one). Thus, the effect of collectivization on mortality cannot be explained by collective farm members having less land.
Next, although I do not have disaggregated data on collective farm yields, I observe the 1930 sown area. Table 2 Columns (3)–(6) study the impact of collectivization and collective farm size on the collective and individual sown area. All estimates control for sown area per capita in 1925 and all baseline controls. Columns (3) and (4) show that, on average, collective farms maintained or even increased 1925 sown area. By contrast, Columns (5) and (6) demonstrate that the remaining individual peasants cultivated approximately half the size of the 1925 sown area. On top of that, Columns (3) and (5) show that higher collectivization is associated with a decrease in the sown area of both collective farms and individual peasants. Columns (4) and (6) demonstrate that a higher number of households per collective is negatively associated with the collectives’ sown area while not affecting individual peasants’ sowing. Thus, there are two opposing effects: on average, collective farms increase per capita sown area relative to the 1925 level, but the higher the district collectivization rate, or the more households there are in the collective, the less advantage collectives had in sown area. The total 1930 sown area still increased (Appendix Figure B2), but collective farm size appears to be a disadvantage already in 1930. Footnote 47
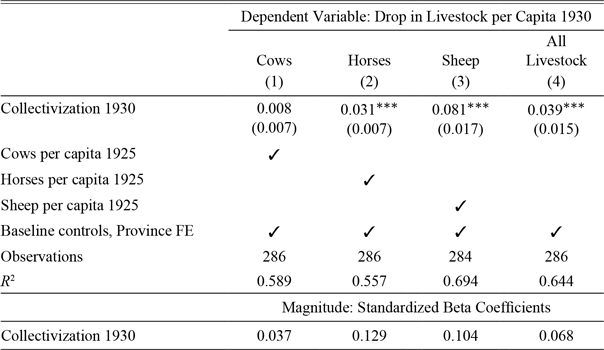
Finally, Table 3 investigates the impact of collectivization on the drop in livestock. Columns (1)–(4) report the relationship between the 1930 collectivization rate and, respectively, the drop in cows, horses, sheep, and all livestock per capita, controlling for all baseline controls and, respectively, cows, horses, and sheep per capita in 1925 (livestock is already in the baseline controls). Consistent with historical accounts, collectivization is associated with a drop in livestock: all coefficients are positive, although only the impact on a drop in horses, sheep, and all livestock is statistically significant. Thus, more collectivized areas had less draught power and fewer animals to rely on as an alternative to grain emergency food sources.
DROP IN LIVESTOCK: DISTRICT-LEVEL ESTIMATES

* = Significance at the 10 percent level.
** = Significance at the 5 percent level.
*** = Significance at the less than 1 percent level.
Notes: Standard errors are corrected for spatial correlation in a radius of 700 km. Baseline controls are average grain production per capita 1925, livestock per capita 1925, value of agricultural equipment per capita 1925, urbanization 1927, Polissia region indicator, rural literacy rate 1927, rural population density 1927, de-meaned June 1931 temperature, and de-meaned June 1932 precipitation.
Sources: Section Data provides details on data construction, Table A1 shows summary statistics, and Appendix Table E3 lists the exact source of every variable.
To conclude, available data show that collectivization is associated with a drop in livestock and that, consistent with larger collectives being less productive, larger collective farms drive famine mortality up.
Ethnic Composition and Mortality
No study of the Ukrainian famine can avoid the question of whether ethnic Ukrainians were discriminated against. Without other Soviet republics, Ukraine is not ideal for investigating this question because the counterfactual is limited: in my sample, more than 80 percent of the rural population are ethnic Ukrainians. Nevertheless, there is some variation in ethnic composition; Appendix Figure D1 shows four major ethnic groups on the map (Ukrainians, Russians, Germans, and Jews), and Appendix Figure D2 presents histograms of the share of the rural population belonging to these ethnicities. This section studies how famine mortality changed with rural ethnic composition.
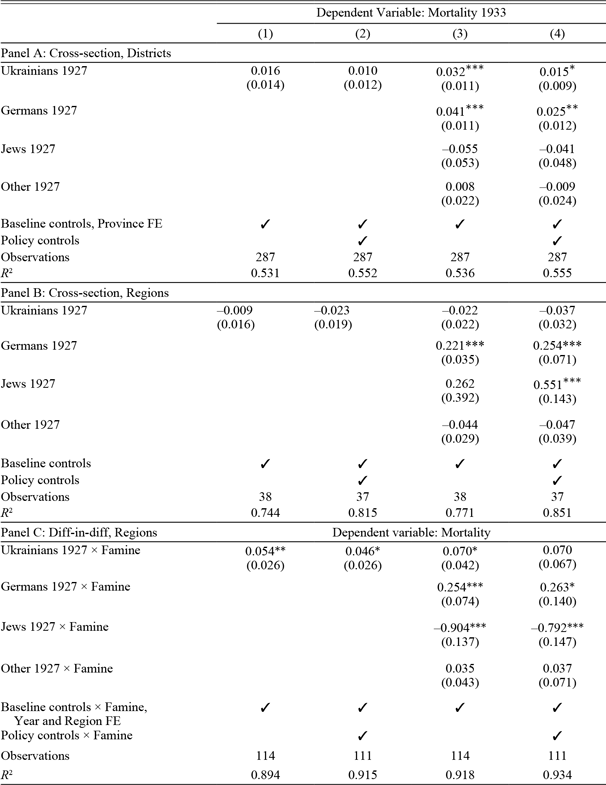
Table 4 presents the estimates of the relationship between ethnicity and mortality on the cross-section of districts (Panel A), the cross-section of regions (Panel B), and the short panel of regions (Panel C). As before, all estimates account for baseline controls (including weather), province fixed effects (Panel A), and year and region fixed effects (Panel C). Column (1) estimates the relationship between the rural share of ethnic Ukrainians and mortality in 1933 conditional only on baseline controls; the Ukrainian coefficient is positive but not statistically significant on the cross-section of districts, and positive and statistically significant when estimated using the panel of regions. Footnote 48 Column (2), in addition to baseline controls, also accounts for the exposure to government policies. The Ukrainian coefficient is still positive and marginally statistically significant when estimated on the panel of regions. Its magnitude reduces somewhat, but because the sample is small, the coefficients are not precisely estimated (the standard errors are large). I cannot reject the hypothesis that the coefficients in Column and Column (2) are equal.
ETHNIC COMPOSITION AND MORTALITY

* = Significance at the 10 percent level.
** = Significance at the 5 percent level.
*** = Significance at the less than 1 percent level.
Notes: Standard errors are corrected for spatial correlation in a radius of 700 km. Baseline controls are average grain production per capita 1925, livestock per capita 1925, value of agricultural equipment per capita 1925, urbanization 1927, Polissia region indicator, rural literacy rate 1927, and rural population density 1927. Cross-section specifications (Panels A and B) control for de-meaned June 1931 temperature and de-meaned June 1932 precipitation. Diff-in-diff specification (Panel C) controls for twice-lagged June temperature and lagged June precipitation. Policy controls are the collectivization rate 1930, number of Group A workers per capita 1930, and log stance to a railroad. In Columns (3) and (4), the omitted category is Russians.
Sources: Section Data provides details on data construction, Table A1 shows summary statistics, and Appendix Table E3 lists the exact source of every variable.
Table 4 Columns (3) and (4) add rural shares of ethnic Germans, Jews, and a synthetic group of all other non-Russian ethnicities, estimating how mortality in these groups compared to the mortality of ethnic Russians (omitted category). Ethnic Ukrainians and ethnic Germans appear to die at a higher rate than ethnic Russians: the coefficients in Column (3) Panels A and C are positive and marginally statistically significant. Appendix Figure D3 presents conditional scatter plots and fitted values of the Ukrainian and German coefficients corresponding to the estimates in Panel A Column (3) and shows that the sizes of the coefficients are not driven by the outliers, but once the outliers are removed, while the slope does not change, statistical significance disappears. Next, controlling for exposure to government policies in Panel A Column (4) makes the Ukrainian and German coefficients smaller though still positive and marginally statistically significant; in Panel C Column (4), the Ukrainian coefficient loses statistical significance, but I cannot reject the hypothesis that it is equal to the coefficient in Column (3)—the standard errors are too large. Overall, the estimates demonstrate that a positive though statistically weak relationship exists between the higher share of rural ethnic Ukrainians and ethnic Germans and 1933 mortality and that higher mortality in Ukrainian and German areas is not fully explained by exposure to the government policies. Footnote 49
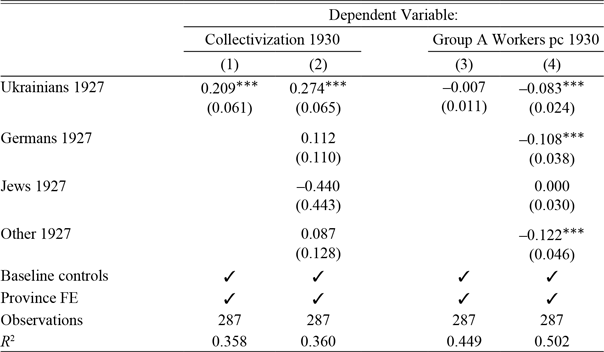
Next, because the Ukrainian and German coefficients decrease in magnitude (in Table 4 Panel A) and lose statistical significance (in Table 4 Panel C) after controlling for government policies, Table 5 investigates the relationship between ethnic composition and exposure to policies. I concentrate on two policies that have been shown to affect mortality: collectivization and the lack of favored industries. Column (1) demonstrates that a positive and statistically significant relationship exists between the rural share of ethnic Ukrainians and the 1930 collectivization rate (conditional on all baseline controls and province fixed effects): one standard deviation increase in ethnic Ukrainians (18 percent increase) raises 1930 collectivization by approximately 0.17 of a standard deviation, or by 4 percent. Appendix Figure D5 presents corresponding conditional scatter plot and fitted values and show that the relationship between ethnic Ukrainians and collectivization is not driven by one observation or a group of observations. Next, Column (2) adds other ethnic groups (Germans, Jews, and all other non-Russians) and demonstrates that ethnic Ukrainians were more collectivized than ethnic Russians. The German coefficient, while positive, is not statistically significant, so there is no strong evidence that ethnic Germans were more collectivized.
EXPOSURE TO THE GOVERNMENT POLICIES: DISTRICT-LEVEL ESTIMATES

* = Significance at the 10 percent level.
** = Significance at the 5 percent level.
*** = Significance at the less than 1 percent level.
Sources: Standard errors are corrected for spatial correlation in a radius of 700 km. Baseline controls are average grain production per capita 1925, livestock per capita 1925, value of agricultural equipment per capita 1925, urbanization 1927, Polissia region indicator, rural literacy rate 1927, and rural population density 1927. In Columns (2) and (4), the omitted category is Russians. Section Data provides details on data construction, Table A1 shows summary statistics, and Appendix Table E3 lists the exact source of every variable.
Ethnic Ukrainians could have voluntarily collectivized more than other ethnic groups. To address this, I study the relationship between ethnicity and collectivization in 1928, when it was not yet forced. Footnote 50 Only region-level collectivization data are available for 1928, so with region data, I estimate the relationship between the share of rural ethnic Ukrainians and collectivization rates in 1928 and 1930 conditional on all baseline controls except the weather. Appendix Table D5 shows that in 1928 fewer ethnic Ukrainians were collectivized, while in 1930, the relationship flipped. Thus, higher collectivization rates of ethnic Ukrainians cannot be explained by their voluntary preference for collectivization.
Table 5 Columns (3) and (4) show that ethnic Ukrainian and ethnic German districts had fewer Group A industries relative to ethnic Russian districts. Appendix Figure D6 shows that this relationship is not driven by just one district or a small subset of districts. However, industry location was mainly determined by the resource endowment (e.g., coal in the Donbass area) and by historical reasons (e.g., arms-producing factories in Kiev). So, while Ukrainians and Germans were unlucky to have had fewer well-supplied industries, this fact cannot be interpreted as proof of government intent. Footnote 51
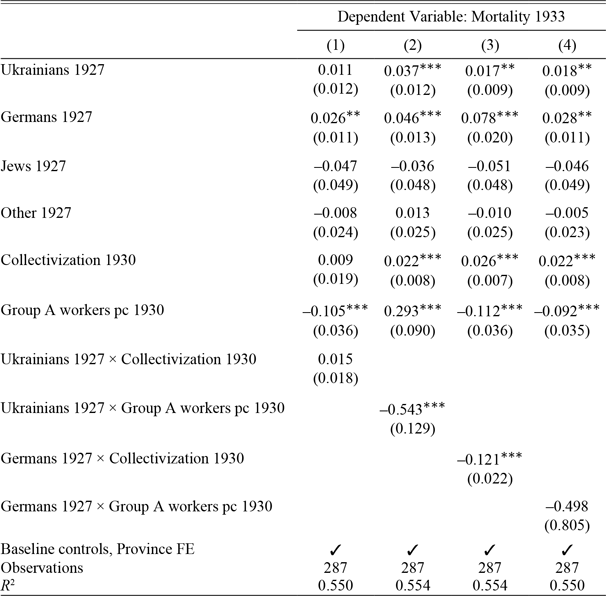
Finally, Table 6 investigates how enforcement of government policies varied with ethnic composition. I estimate how 1933 mortality is affected by the ethnic composition, exposure to government policies (collectivization and Group A workers), and the interactions between the shares of ethnic Ukrainians and ethnic Germans and the government policies. If collectivization was more harshly enforced on Ukrainians or Germans, the interaction coefficient between Ukrainians (or Germans) and collectivization should be positive. If favored industries were treated worse in ethnic Ukrainian or German areas, the interaction coefficient between the share of Ukrainians (or Germans) and the number of Group A workers per capita should be positive. Column (1) shows that the interaction coefficient between the share of ethnic Ukrainians and collectivization is positive but not statistically different from zero. Column (3) shows that the interaction coefficient between the share of ethnic Germans and collectivization is negative. Column (2) demonstrates that the interaction coefficient between Ukrainians and Group A workers is negative and statistically significant, while Column (4) demonstrates that the interaction coefficient between ethnic Germans and Group A workers is negative, although not statistically different from zero. No strong evidence exists that government policies were enforced more harshly on ethnic Ukrainians or Germans.
ENFORCEMENT OF THE GOVERNMENT POLICIES: DISTRICT-LEVEL ESTIMATES

* = Significance at the 10 percent level.
** = Significance at the 5 percent level.
*** = Significance at the less than 1 percent level.
Notes: Standard errors are corrected for spatial correlation in a radius of 700 km. Baseline controls are average grain production per capita 1925, livestock per capita 1925, value of agricultural equipment per capita 1925, urbanization 1927, Polissia region indicator, rural literacy rate 1927, rural population density 1927, de-meaned June 1931 temperature, and de-meaned June 1932 precipitation. Sources: Section Data provides details on data construction, Table A1 shows summary statistics, and Appendix Table E3 lists the exact source of every variable.
To conclude, there are indications that ethnic Ukrainians and ethnic Germans were discriminated against: they die more, even after controlling for exposure to government policies (although this result is underpowered), and ethnic Ukrainians were more collectivized. This is not proof of genocide. To prove genocide, one would have to show that Stalin knew collectivization would fail several years before the famine, and that, he therefore disproportionally exposed ethnic Ukrainians to it.
CONCLUSION
Weather and environmental factors have always been blamed for famines in command economies: drought in the Soviet Union, insects (Dikötter Reference Dikötter2010) or drought (Chen and Yang Reference Chen and David2019) in China, and floods and droughts in North Korea. By contrast, in the twentieth century, no famines occurred during peacetime in market economies. Either nature hates totalitarian regimes, or it is time to put the blame where it belongs: government policies that make food supply susceptible to a disaster when environmental conditions are less than perfect.
In this paper, I study the three most popular explanations of the 1933 famine in Ukraine: weather, government policies, and genocide. I argue that weather explains up to 8.1 percent of excess deaths, while collectivization explains up to 52 percent of excess deaths, so weather cannot be the main cause of the famine. I also find some evidence that ethnic Ukrainians and ethnic Germans were discriminated against: they were more likely to die, even after accounting for government policies, and ethnic Ukrainians were more collectivized.
While this paper makes progress toward a better understanding of the 1933 famine, at least three important questions are not addressed in this work. First, grain procurement. This paper only has data on aggregate procurement in Ukraine; we need to better understand the procurement system and its impact on the population. Second, ethnicity and famine mortality. While ethnicity likely played a role, Ukraine alone is not suitable for addressing the ethnic question because it lacks sufficient variation in ethnic composition. The question of whether different ethnic groups were discriminated against because of central government policy or local tensions remains open. Third, the 1933 famine became the Famine in the post-Soviet territory—it is one of the most traumatic events of the twentieth century. More work is necessary to understand its consequences.