


INTRODUCTION
Tropical rivers are, at all scales, highly complex and multifaceted ecosystems. Unravelling their way of functioning is still a challenge to the scientific world. Most investigations focus on single aspects of tropical river ecology. There are, for example, numerous studies of hydrological processes (Ataroff & Rada Reference ATAROFF and RADA2000, Bruijnzeel Reference BRUIJNZEEL2001, Reference BRUIJNZEEL2004; Buytaert et al. Reference BUYTAERT, WYSEURE, BIEVRE and DECKERS2005, Perrin et al. Reference PERRIN, BOUVIER, JANEAU, MENEZ and CRUZ2001) or of biogeochemical issues (Aucour et al. Reference AUCOUR, TAO, MOREIRA-TURCQ, SEYLER, SHEPPARD and BENEDETTI2003, Bücker et al. Reference BÜCKER, CRESPO, FREDE, VACHE, CISNEROS and BREUER2010, Elsenbeer et al. Reference ELSENBEER, LACK and CASSEL1995). Others have tried to combine the effect of hydrology and biogeochemistry to gather more profound information on tropical catchment processes (Biggs et al. Reference BIGGS, DUNNE and MURAOKA2006, Borbor-Cordova et al. Reference BORBOR-CORDOVA, BOYER, MCDOWELL and HALL2006, Boy et al. Reference BOY, VALAREZO and WILCKE2008a, Bruijnzeel Reference BRUIJNZEEL1991, Elsenbeer & Lack Reference ELSENBEER and LACK1996, Lesack & Melack Reference LESACK and MELACK1996, McDowell & Asbury Reference MCDOWELL and ASBURY1994, Salmon et al. Reference SALMON, WALTER, HEDIN and BROWN2001). Virtually all studies face the problem of the interplay of too many factors (climate, geology, topography, anthropogenic influence, vegetation etc.) to derive general conclusions on the drivers of catchment functioning. In this respect, the forested mountain ranges of the Andes present an interesting opportunity for investigations on the effect of human disturbance on catchment processes. Montane headwater areas are different to other stream networks in the respect that they often lack a well-defined riparian zone. The steep, rocky relief and rather narrow valley bottoms can lead to relatively fast surface or subsurface flows (Tsujimura et al. Reference TSUJIMURA, ONDA and ITO2001). The impact of slow, groundwater-dominated processes are mostly of minor importance, and the streams are characterized by close terrestrial-aquatic linkages near to and over the soil surface. Because of these close linkages, such headwaters tend to be very sensitive to any natural or anthropogenic disturbance (Lowe & Likens Reference LOWE and LIKENS2005).
Deforestation and conversion to pasture or agriculture is one of the major disturbances in neotropical montane forests and the impact on the terrestrial part of the ecosystem can be dramatic (Bubb et al. Reference BUBB, MAY, MILES and SAYER2004). Changes in stream nutrient concentration and composition can impact ecological functioning such as in-stream productivity and changes in the community composition of the aquatic fauna. To be able to predict the impact of these disturbances on the stream flora and fauna it is thus vital to investigate and quantify nutrient and water flow under different vegetation cover and land-management systems. Moreover, there is an urgent need to improve our knowledge of Andean solute fluxes to downstream areas, for the reason that they exert a strong influence on the ecology and productivity of Amazonian lowland rivers and floodplains (Buytaert et al. Reference BUYTAERT, CÉLLERI, BIEVRE, CISNEROS, WYSEURE, DECKERS and HOFSTEDE2006, McClain & Naiman Reference MCCLAIN and NAIMAN2008, Saunders et al. Reference SAUNDERS, MCCLAIN and LLERENA2006). Many fish species, for example, rely on the productivity of Andean tributaries (McClain & Naiman Reference MCCLAIN and NAIMAN2008).
Most studies reporting export values for tropical rivers only look at either forested or deforested sites (Biggs et al. Reference BIGGS, DUNNE and MURAOKA2006, Boy & Wilcke Reference BOY and WILCKE2008, Liu et al. Reference LIU, FOX and XU2003, McDowell & Asbury Reference MCDOWELL and ASBURY1994, Newbold et al. Reference NEWBOLD, SWEENEY, JACKSON and KAPLAN1995, Yusop et al. Reference YUSOP, DOUGLAS and NIK2006). Thus, there is a notable shortage of studies investigating both tropical pasture and forested catchments at the same time. The authors are aware of only two comparative studies reported from Brazil (Germer et al. Reference GERMER, NEILL, VETTER, CHAVES, KRUSCHE and ELSENBEER2009, Neill et al. Reference NEILL, DEEGAN, THOMAS and CERRI2001) which were conducted in the Amazon at 143 m asl and 200–500 m asl respectively and where differences in hydrologic fluxes and solute concentrations were investigated for undisturbed forest and pasture sites. Neill et al. (Reference NEILL, DEEGAN, THOMAS and CERRI2001) detected lower concentrations of NO3, but higher total N, as well as PO4 and particulate organic matter concentrations in pasture streams. Germer et al. (Reference GERMER, NEILL, VETTER, CHAVES, KRUSCHE and ELSENBEER2009) observed no change in SO4 export, but an increase in NH4, Cl and K and a decrease of NO3, Na and Ca export after deforestation and conversion to pasture.
The objective of this study was to examine several high-elevation (1800–3100 m asl) montane streams in terms of differences in nutrient fate and export between forested and deforested sites. By combining hydrological and biogeochemical measurements we aimed to improve our knowledge on catchment processes of montane streams and on the possible impact of land-use change on nutrient export. Our hypotheses were that (1) stream solute concentrations and export rates increase with an increasing proportion of deforested catchment area, (2) flow paths of solute transport in disturbed sites are dominated by surface pathways while subsurface flow dominates in forested sites.
METHODS
Study site
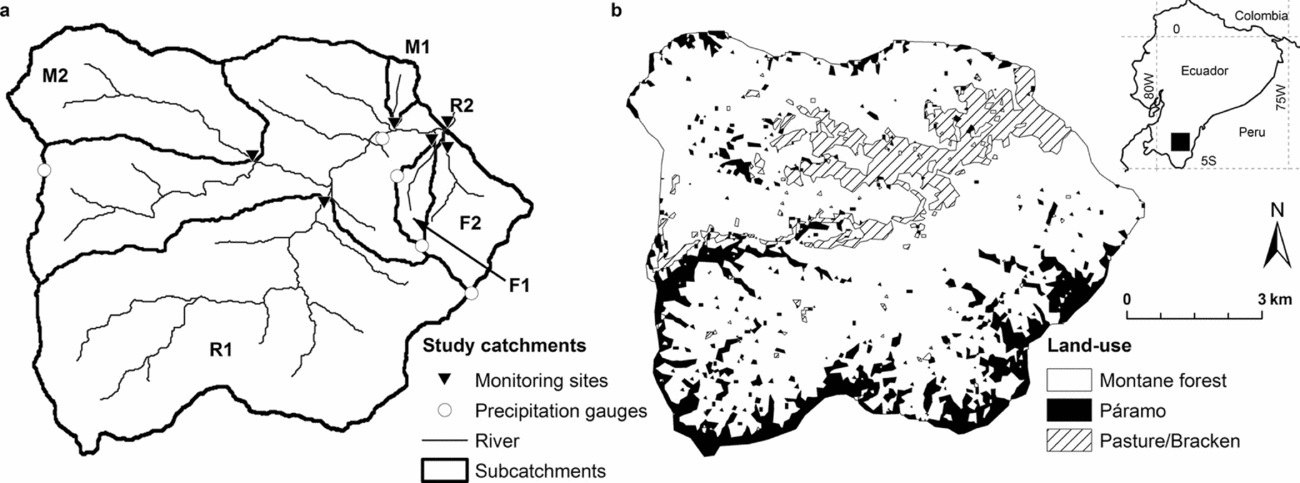
The San Francisco catchment (3°58′30″S, 79°4′25″W) drains a 75-km2 area at the eastern slopes of the Andes in South Ecuador (Figure 1). Elevation ranges between 1800 to 3140 m asl, with steep slopes of on average 25°–40° over the entire watershed. The river divides the catchment into a northern and southern section with distinct differences in land use. To the south, the northern border of the Podocarpus National Park touches the study area and the slope is covered by an almost pristine cloud forest with tree heights of up to 20 m. Dominant plant families are the Lauraceae, Euphorbiaceae, Melastomataceae and Rubiaceae. The northern slopes are characterized by deforestation, mainly at lower elevations, and consist of patches of pasture (Setaria sphacelata Schumach.), bracken fern (Pteridium aquilinum L.), pine plantations (Pinus sp.) and secondary forest (Figure 1b). The pastures were created around 12–30 y ago by slash-and-burn and by planting Setaria turfs. After some years of use, a lot of pastures are overgrown by bracken fern. If this occurs, they are either burned again, or abandoned (Werner et al. Reference WERNER, HOMEIER and GRADSTEIN2005). On both slopes, the crest regions are covered by a neotropical alpine grassland/shrubland (páramo) and an evergreen elfin forest. Both ecosystems are composed of plant species that are adapted to higher wind speed, lower temperatures and lower nutrient availability compared to lowland sites (Beck et al. Reference BECK, MAKESCHIN, HAUBRICH, RICHTER, BENDIX, VALAREZO, Beck, Bendix, Kottke, Makeschin and Mosandl2008).
Overview of the study area (75 km2) with subcatchments (a) and land use (b). Land use data from Landsat ETM+ satellite images were provided by Dietrich Göttlicher (Göttlicher et al. Reference GÖTTLICHER, OBREGÓN, HOMEIER, ROLLENBECK, NAUSS and BENDIX2009).
Annual precipitation amounts are dependent on altitude and vary between 2000 and 5000 mm, with higher altitudes receiving more rain. Also, cloud and fog water inputs contribute significantly to total water input, especially during the drier period between September and February (Bendix et al. Reference BENDIX, ROLLENBECK, RICHTER, FABIAN, EMCK, Beck, Bendix, Kottke, Makeschin and Mosandl2008). Due to the Andes acting as a western barrier, the catchment's climate regime generally originates from the east. Predominant rock types on both slopes are semipelites, phyllites and quartzites (Litherland et al. Reference LITHERLAND, ASPDEN and JEMIELITA1994), all belonging to the Chiguinda Unit of the Zamora Series. Soils in the study area range from Cambisols (below 2100 m) with a moderate organic layer, to Histosols (above 2100 m) with an increasing organic layer thickness (Wilcke et al. Reference WILCKE, YASIN, SCHMITT, VALAREZO, ZECH, Beck, Bendix, Kottke, Makeschin and Mosandl2008). More information on physical and geological characteristics of the study area can be found in Bücker et al. (Reference BÜCKER, CRESPO, FREDE, VACHE, CISNEROS and BREUER2010).
Sampling scheme
We sampled six subcatchments equipped with automatic gauging stations (Figure 1a). Two gauging stations were located in tributaries draining subcatchments in the north with mixed land-use (M1 and M2), two in tributaries draining primary forest in the south (F1, F2) and two points in the main river (R1, R2). For more information on the different subcatchments see Table 1.
Overview of the land-use characteristics of the study catchments (F1, F2, M1, M2, R1 and R2). Acronyms indicate gauging station in tributaries with forest dominated land use (F1, F2), mixed land use (M1, M2) or stream sections in the river (R1, R2). Data from Landsat ETM+ satellite images kindly provided by Göttlicher et al. (Reference GÖTTLICHER, OBREGÓN, HOMEIER, ROLLENBECK, NAUSS and BENDIX2009).

Water samples were taken over 1 y (April 2007–May 2008, exception M1) at different flow regimes spanning from low flow conditions to peak flows on a weekly to fortnightly schedule. The sampling in M1 began in September 2007. Investigated parameters included NO3, PO4, SO4, NH4, total organic carbon (TOC), Ca, Mg, Na and K. Samples were taken with pre-washed PE bottles directly in the field and were immediately stored cool (Ca, Mg, Na, K) or frozen (TOC, NO3, PO4, SO4) until analysed. We tested for ammonium directly in the field using a quick test (Aquaquant 1.4428, Merck, Darmstadt, DE) which revealed, that concentrations were below the detection limit of 0.025 mg l−1. Concentrations of NO3, PO4 and SO4 were determined by ion chromatography with detection limits of 0.1 mg l−1 for NO3 and SO4 and 0.5 mg l−1 for PO4 (DX-120, Dionex Corporation, CA, US). Every sample value represents the mean of two consecutive measurements of the same sample. PO4 was found to be below the detection limit in all samples and was therefore excluded from our analysis. TOC concentrations (calculated as total carbon minus inorganic carbon) were quantified by high-temperature oxidation as requested by European DIN norms (EN1484) using a LiquiTOC analyser (elementar analytics, Hanau, DE). Detection limit for TOC was 0.3 mg l−1. Element concentrations of Ca, Mg, Na and K were analysed by inductively coupled plasma-mass spectrometry (ICP-MS, Agilent 7500ce, Agilent Technologies, Böblingen, DE). Detection limits were 0.06, 0.01, 0.09 and 0.05 mg l−1 for Ca, Mg, Na and K, respectively.
Hydrological measurements began at the same time as the sampling period. Water-level sensors were installed at the outlet of F1, F2, M1, M2, R1 and R2. Stage data were collected every 5 min (ODYSSEY water level loggers, Dataflow Systems PTY LTD, NZ). At all points discharge measurements were made, with a mean of 36 measurements per gauging station, using a digital flow-meter (FLO-MATE, Marsh-McBirney Inc., Maryland, US) and a flow probe (FP101, Global Water Inc., California, US) to set up stage-discharge curves. At site M1 we were able to install a V-notch concrete weir, for the other stations we used natural stream transects.
Nutrient export calculation
Because water sampling was done at a much lower frequency than discharge measurements, nutrient export had to be approximated by interpolation or regression. Schleppi et al. (Reference SCHLEPPI, WALDNER and STÄHLI2006) compared three possible methods, namely (1) using the mean or flow-weighted mean concentration values for a distinct period, (2) linear interpolation for the interval between measurements and (3) regression of nutrient concentration with discharge. Schleppi et al. observed, that if concentrations were discharge dependent, methods (1) and (2) could generate strongly biased results towards under- or overestimation of nutrient export. According to Schleppi et al. (Reference SCHLEPPI, WALDNER and STÄHLI2006), the regression-based calculation is the best approach. To be as accurate as possible in the export calculation we tested three possible concentration dependencies (time-, discharge-dependent, no relation) separately for all measured parameters (NO3, SO4, TOC, Ca, Mg, Na and K) and for each station.
Concentration dependent on time
We started our analysis by testing for time-dependence of nutrient concentrations. For this test, samples were bulked into seven periods for each station: (1) April/May 2007, (2) June/July 2007, (3) August/September 2007, (4) October/November 2007, (5) December 2007/January 2008, (6) February/March 2008 and (7) April/May 2008. We aggregated two months' data for this analysis because our sampling scheme implied two to four samples per month. Means of element and nutrient concentration (with n = 4–8) were compared between groups using a t-test and α = 0.01. For those parameters exhibiting time-dependent changes we calculated monthly and annual export by multiplying the sum of the monthly discharge with the mean of the two-monthly concentration.
Concentration dependent on discharge
For all parameters not showing time-dependent changes we tested for concentration relations with discharge. These were obtained by determining instantaneous discharge at the time of sampling and regression analysis of instantaneous discharge versus instantaneous concentration. The following curve adaptations for concentration-discharge regressions were tested: (1) Hyperbolic function, (2) exponential function, (3) linear function with or without logarithmic transformation. We started the analysis by testing all three fitting procedures and used the one with the best fit (R2), respectively the smallest sum of residuals. Additionally we checked for bias in residuals with discharge. After finding the best adaptation for the data, choosing either (1), (2) or (3), the significance of the regression was tested. Only significant regression coefficients (α = 0.01) were retained. All statistical analyses were conducted using the STATISTICA 6.0 package by StatSoft®. (1) The hyperbolic function was proposed by Johnson et al. (Reference JOHNSON, LIKENS, BORMANN, FISHER and PIERCE1969) and has been used by various authors (Aulenbach & Hooper Reference AULENBACH and HOOPER2006, Salmon et al. Reference SALMON, WALTER, HEDIN and BROWN2001, Stelzer & Likens Reference STELZER and LIKENS2006). It was found to fit better than other models. It is also more process-oriented, presenting a two-compartment mixing model, with c = [1/(1 + β × Q)] × cδ + cα and cδ = c0 − cα where c is the modelled concentration of the solute, cα is the concentration of the solute in the solution added to the prior solution, c0 is the concentration of the solute in the prior solution, cδ is the difference between prior and added solution, Q is discharge and β is a constant (Johnson et al. Reference JOHNSON, LIKENS, BORMANN, FISHER and PIERCE1969). The model parameters c0 and cα were adapted to obtain the best fit for the data. (2) The exponential function has the common form c = a × e(b × Q) where c is the modelled concentration of the solute, Q is discharge and a and b are fitting parameters. (3) A linear adaptation was tested with and without logarithmic transformation. The common form of a linear function c = a × Q + b was taken, with a and b as model parameters, c being the modelled concentration and Q the discharge.
No dependence
If concentrations were neither time, nor discharge-dependent (i.e. both the temporal analysis and the regression were not significant) we calculated export as the median concentration times the monthly discharge. The median was preferred to the mean to account for extreme values and outliers.
Nutrient input via precipitation
For a first estimation of nutrient input via precipitation, rain samples (n = 19) were collected at the lowermost precipitation station (Figure 1a) on an event basis and were analysed for the same chemical constituents as stream water. TOC could not be analysed, though, because not enough rain water was available for the analysis. Quantitative total precipitation data were available for five stations situated in our study area at different altitudes (Figure 1a). These daily pluviometric data were kindly provided by Rütger Rollenbeck and Thorsten Peters on the project website database (www.tropicalmountainforest.org).
Due to the high dependence of precipitation amount on altitude, we computed the yearly amount of rainfall for each subcatchment by using Thiessen polygons. For this, rainfall data of four meteorological stations were used to derive precipitation lapse rates, and the average precipitation for each of the subcatchments in the station was calculated using area weighted elevation corrections. For more information on Thiessen polygons and interpolation methods see Goovaerts (Reference GOOVAERTS2000), Hartkamp et al. (Reference HARTKAMP, BEURS, STEIN and WHITE1999) and Vicente-Serrano et al. (Reference VICENTE-SERRANO, SAZ-SÁNCHEZ and CUADRAT2003). Nutrient input was calculated as the median of the concentration data for rain samples times the amount of yearly precipitation in each subcatchment.
RESULTS
Chemistry of stream water
Stream chemistry in the San Francisco catchment was clearly dominated by Na, as can be seen in Figure 2, where mean molar concentrations of the four investigated cations are aggregated for each subcatchment. Under mixed land-use and in the main river, Ca was the second most abundant cation, whereas in forested streams, Ca, K and Mg were equally important. Cation concentrations in the forested streams were generally much lower than in catchments with mixed land-use, although K concentrations were comparable between streams. NO3 concentrations were below the detection limit of 0.1 mg l−1 in stream M1 (Table 2), and we subsequently used a hypothetical value of half the detection limit for NO3 export calculations in this subcatchment. Concentrations of SO4 were elevated in both mixed catchments, with M2 having the highest values of all streams (Table 2).
Overview of the flow-weighted mean (FWM) concentrations (mg l−1), nd = not detectable. Acronyms indicate gauging station in tributaries with forest-dominated land use (F1, F2), mixed land use (M1, M2) or stream sections in the river (R1, R2).

Stacked bar chart of mean molar concentrations of the investigated cations in the subcatchments. Acronyms indicate gauging station in tributaries with forest-dominated land use (F1, F2), mixed land use (M1, M2) or stream sections in the river (R1, R2).

Time-dependent changes in stream nutrient concentration
The test on time-dependence revealed significant temporal concentration changes for NO3 and SO4 in all six subcatchments (Figure 3). SO4 concentrations were constant from April to December 2007, with higher concentrations in the mixed catchments (M1, M2) and at the outlet (R2), and the lowest in the forested streams F1 and F2. During the second half of the study period, starting in December 2007/January 2008 concentrations started to decrease at all stations. For NO3, concentrations were comparably high throughout the catchment (~1100 μg l−1) in April/May 2007 but thereafter declined consistently to ~300 μg l−1 until April/May 2008.
Daily precipitation input at 1800 m asl (a), daily discharge at the catchment outlet R2 (b), daily west wind frequency (c), and boxplots of sulphate (d) and nitrate (e) concentration in stream water during April 2007–May 2008. For each boxplot all water samples taken in 2 months were aggregated. Wind data kindly provided by Thorsten Peters (FOR816 database, www.tropicalmountainforest.org). Acronyms indicate gauging station in tributaries with forest-dominated land use (F1, F2), mixed land use (M1, M2) or stream sections in the river (R1, R2). Note that NO3 concentrations for M1 are not shown because they were always below the detection limit of 0.5 mg l−1.

Discharge-dependent changes in stream nutrient concentration
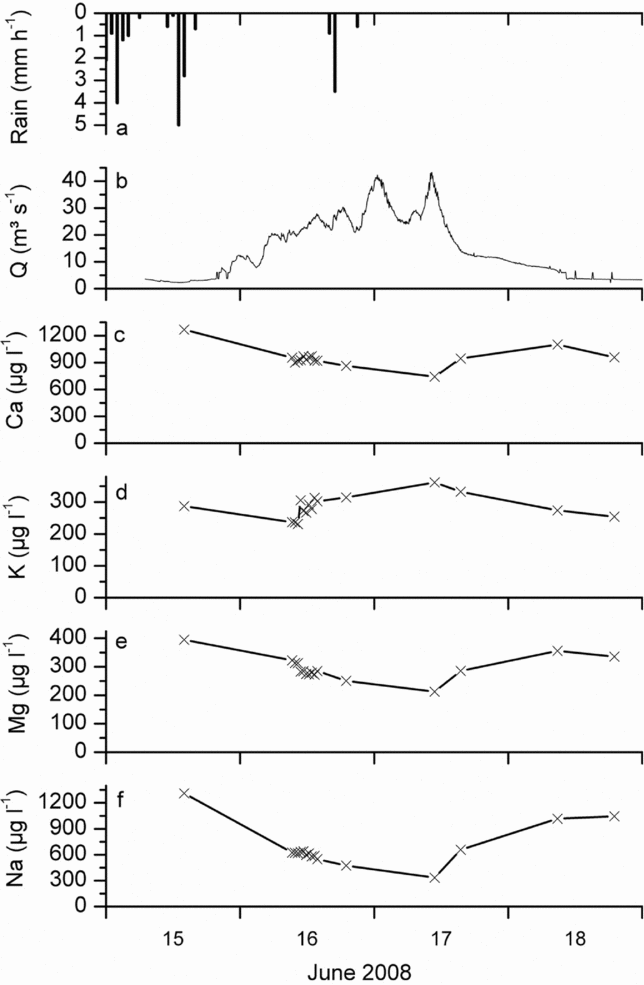
For most of the remaining parameters (Ca, K, Mg, Na and TOC) the test on concentration-discharge relation was significant. Na and TOC were always significantly related to discharge, while for Ca, Mg and K differences among the catchments occurred (Table 3, Figure 4). Where significant, Ca, Na and Mg decreased and TOC increased with discharge. For K we observed no relation to water flows, with the only exception in subcatchment M2, where K concentration increased with higher discharge. In forested creeks F1 and F2 no relation to discharge for Ca, K or Mg was observed. The behaviour of the cations during storm events can also be observed in Figure 5, where concentration changes during a major event in June 2008 are depicted for the catchment outlet R2.
Information on discharge-concentration relations of the study catchments (F1, F2, M1, M2, R1 and R2). Acronyms indicate gauging station in tributaries with forest dominated land use (F1, F2), mixed land use (M1, M2) or stream sections in the river (R1, R2). R2 values of significant relations in brackets. Exp = exponential relation, Hyp = hyperbolic relation, Lin = linear relation, ln-ln = linear relation with logarithmic transformation, all significant at α = 0.01, M = median value – taken when no other adaptation proved significant.

Concentration-discharge relations of Ca, K, Mg, Na and TOC for two of the six study catchments, one forested catchment F2 (a–e) and one catchment with mixed land-use M1 (f–j). If the relation is significant, the R2 values are given. Thin lines represent the 95% confidence intervals of the regression.

Precipitation amount (a), discharge (b) and nutrient concentration (c–f) during a storm in June 2008 at the catchment outlet (R2).
Nutrient export
For the calculation of annual nutrient export we needed continuous discharge time series. Data gaps in the time series were filled by regression with discharge data from the outlet, R2. Gaps in R1 (11.5%, sensor failures), M1 (50% which corresponds to the period April to September 2007), F1 (21%, sensor failures) and F2 (12%, sensor failures) were refilled with the following regression coefficients: F1–R2: R2 = 0.63; F2–R2: R2 = 0.70; R1–R2: R2 = 0.80 and M1–R2: R2 = 0.43. In Figure 6 yearly export values with 95% confidence intervals are depicted. For Ca, Mg, K, Na, NO3 and SO4 annual export values and confidence limits seemed to be fairly robust. SO4 and NO3 exports were lowest in the pasture creek M1 (6.0 kg ha−1 y−1 and 0.3 kg ha−1 y−1 respectively), which additionally was the one with the lowest specific discharge (Figure 6). Although M2 also showed low specific discharges, the export values for SO4 and NO3 were in the range of the other subcatchments (18.7 kg ha−1 y−1 and 13.8 kg ha−1 y−1 respectively), and for Ca, Mg and Na the export values were slightly higher. Forested streams F1 and F2 revealed notably low export values for Ca, and for Mg and Na the values were also at the lower end. At the outlet (R2) however, export of nutrients and elements was generally high. For TOC, confidence intervals were large, and export calculation therefore uncertain. No clear pattern for land-use dependence on TOC export could thus be discerned.
Boxplots of mean daily specific discharge (a), with percentiles (box), median (horizontal line), mean value (asterisk), and bar charts of calculated annual nutrient export with confidence intervals (b–h). Acronyms indicate gauging station in tributaries with forest dominated land use (F1, F2), mixed land use (M1, M2) or stream sections in the river (R1, R2).

Precipitation inputs
For a first estimation of nutrient budgets in montane tropical cloud forest streams we calculated the contribution of rain water to the nutrient budget. When only wet input by rain was considered, the net nutrient budget of the subcatchments was negative (= net export) for most of the parameters (Figure 7). For Ca, the budget was almost neutral in forest creeks F1 and F2. A net accumulation in all subcatchments was found for K.
Solute export compared to input by precipitation for all study catchments during the study period April 2007–May 2008. Note that due to the lack of dry deposition inputs and of inputs by fog water the nutrient budget is not complete. Acronyms indicate gauging station in tributaries with forest dominated land use (F1, F2), mixed land use (M1, M2) or stream sections in the river (R1, R2).

DISCUSSION
Chemistry of stream water
Meybeck & Helmer (Reference MEYBECK and HELMER1989) distinguish different stream types with respect to their dissolved major elements (SiO2, Ca, Mg, K, SO4) as well as pH and electric conductivity. According to their distinctions our forested waters are closest to pristine Amazonian clear waters.
The overall median molar ratio of Na:Cl in stream water in our study area was 3.1 for baseflow and 2.4 for fast flow during 2007/2008 (Bücker et al. Reference BÜCKER, CRESPO, FREDE, VACHE, CISNEROS and BREUER2010), which differs considerably from the maritime (precipitation) ratio of 0.86 (Keene et al. Reference KEENE, PSZENNY, GALLOWAY and HAWLEY1986). The high Na concentrations in the water therefore do not seem to originate from atmospheric input (sea spray) but rather from mineral weathering. This is also confirmed by much higher Na concentrations in the A, B and C horizon compared to the organic layer, as was found for forested microcatchments located within the R2 catchment (Boy et al. Reference BOY, VALAREZO and WILCKE2008a). For Mg and Ca, Boy et al. (Reference BOY, VALAREZO and WILCKE2008a) report higher concentrations in the organic layer, compared to deeper layers. According to the same study, K concentrations are increasing with depth, but elevated K concentrations can as well be found in throughfall, stem flow and litter leachate. Hence, for Ca and K a combination of atmospheric and weathering input is most likely. For K, exchange reactions with the biosphere might contribute to the observed patterns in addition to atmospheric and weathering inputs (Johnson & Lehmann Reference JOHNSON and LEHMANN2006).
Catchment M1 is primarily used as an extensive pasture, with 66.7% of its area covered by pasture grass (Setaria) or bracken (Pteridium). The discovery, that tropical pasture streams exhibit lower NO3 concentrations compared to forested catchments has also been published by Neill et al. (Reference NEILL, DEEGAN, THOMAS and CERRI2001), who attribute this to higher NO3 production, connected to N mineralization and net nitrification in forest soils compared to pasture soils. Peterson et al. (Reference PETERSON, WOLLHEIM, MULHOLLAND, WEBSTER, MEYER, TANK, MARTI, BOWDEN, VALETT and HERSHEY2001) state that in headwater streams, NO3 removal occurs either through biological assimilation or denitrification. Faster biological assimilation could occur in pasture stream M1 through algae growth, which is considerably larger in M1 due to elevated light input as noted during our field observations. A third explanation for the observed NO3 pattern comes from Biggs et al. (Reference BIGGS, DUNNE and MURAOKA2006), who describe the decomposition of leaf litter as one important pathway of N input into forest catchments, which is clearly reduced in pasture streams. Lastly, Rhoades et al. (Reference RHOADES, ECKERT and COLEMAN1998) investigated soil N availability in Setaria pasture on the western slope of the Andes and discovered that Setaria reduces soil N concentrations to <20% of that in intact montane forests. Experiments with N-fixing (Inga sp.) and non-N-fixing (Psidium sp.) pasture trees revealed that the tree species were responsible for the observed changes in soil-N and not the changing temperature regime. However, in the San Francisco catchment it has not been ascertained up to now how N-fixing soil organisms are influenced by deforestation and conversion to pasture (S. Setaro pers. comm.). A combination of several factors is probable, though.
SO4 input into our study catchment can occur through atmospheric dry deposits which originate from volcano eruptions or biomass burning and through fog water (Bendix et al. Reference BENDIX, FABIAN and ROLLENBECK2004). Because the formation of pasture land is achieved by cutting down and burning the forest trees (Makeschin et al. Reference MAKESCHIN, HAUBRICH, ABIY, BURNEO, KLINGER, Beck, Bendix, Kottke, Makeschin and Mosandl2008), elevated SO4 concentrations in disturbed catchments can be explained by the history of land-conversion in our area. The higher export value in M2 compared to M1 probably originates from a combination of higher fog water input and the input of ash via burning. A higher fog water input in M2 compared with M1 is reasonable, if forest cover and therefore cloud interception is higher.
Time-dependent changes in stream nutrient concentration
The decrease of SO4 concentrations coincides with an increase in west wind frequency in our catchment (Figure 3c). Atmospheric nutrient input for our study area predominantly originates from the east (Boy et al. Reference BOY, ROLLENBECK, VALAREZO and WILCKE2008b, Fabian et al. Reference FABIAN, KOHLPAINTNER and ROLLENBECK2005). Bendix et al. (Reference BENDIX, FABIAN and ROLLENBECK2004) state that SO4 concentrations are elevated in total precipitation during special events such as volcano eruptions or increased biomass burning in the Amazon. If these inputs are reduced by a change towards west-wind-dominated weather patterns, concentrations in the streams are likely declining as well. The change in wind direction was probably connected to a weakening of the La Niña event, starting at the end of 2007, which caused an increase in sea surface temperature along the Niño regions 1 and 2 (i.e. the Ecuadorian pacific coast) (Climate Prediction Center/NCEP/NWS 2008). Observations made by Savoie et al. (Reference SAVOIE, PROSPERO and SALTZMANN1989) at Barbados support our assumption of correlations between predominant wind pattern and SO4 and NO3 inputs. They detected significant correlations of both NO3 and non-sea-salt SO4 concentrations with those of Saharan dust, demonstrating that substantial fractions of both can be transported by easterly winds across the tropical North Atlantic in association with the dust. Also, Douglas et al. (Reference DOUGLAS, MEJIA, ORDINOLA and BOUSTEAD2009) talk about west-wind anomalies and El Niño phenomena in Ecuador and Peru. The abruptness of the decrease in SO4 concentrations in December 2007/January 2008 and contrasting to this, the steady decrease in NO3 concentrations over the whole study period, are still a matter of further research, though. Additionally, longer time series are needed to more thoroughly address seasonal patterns and to confirm our short-term findings.
Discharge-dependent changes in stream nutrient concentration
A variety of studies report decreases in Ca, Mg and Na concentration with increasing discharge (Anderson et al. Reference ANDERSON, DIETRICH, TORRES, MONTGOMERY and LOAGUE1997, Elsenbeer et al. Reference ELSENBEER, WEST and BONELL1994, Grimaldi et al. Reference GRIMALDI, GRIMALDI, MILLET, BARIAC and BOULEGUE2004, Tsujimura et al. Reference TSUJIMURA, ONDA and ITO2001). Furthermore McDowell & Asbury (Reference MCDOWELL and ASBURY1994) and Newbold et al. (Reference NEWBOLD, SWEENEY, JACKSON and KAPLAN1995) describe decreasing concentrations with increasing discharge for Ca, Na and Mg and no relation of K with discharge, as was also observed in the present study. Goller et al. (Reference GOLLER, WILCKE, FLEISCHBEIN, VALAREZO and ZECH2006), Newbold et al. (Reference NEWBOLD, SWEENEY, JACKSON and KAPLAN1995) and Townsend-Small et al. (Reference TOWNSEND-SMALL, MCCLAIN, HALL, NOGUERA, LLERENA and BRANDES2007) also observed clear increases in organic carbon concentration during rain events. In general, decreases in concentrations during storm flows are mostly ascribed to a dilution of stream water with less concentrated water, such as rain, whereas an increase of concentration during storm flow is ascribed to a flushing of accumulated material (Elsenbeer et al. Reference ELSENBEER, WEST and BONELL1994).
According to Boy et al. (Reference BOY, VALAREZO and WILCKE2008a) Na inputs to forested streams in the R2 catchments are likely due to chemical weathering of deeper subsurface layers. Our data strongly support these findings. A decrease in the contribution of deeper water sources to total flow would therefore explain the observed pattern of decreasing concentrations during storm flow (see also Bücker et al. Reference BÜCKER, CRESPO, FREDE, VACHE, CISNEROS and BREUER2010). This pattern applies to all investigated subcatchments and is obviously not land-use dependent. However, the reaction of Mg, K and Ca concentration varied between land-uses and might be explained by slightly different flow paths. Our conceptual understanding is that during a rain event, storm flow in the forest originates predominantly from the organic layer, with low Na concentration but moderate Ca and Mg and high TOC concentrations. For K, Boy et al. (Reference BOY, VALAREZO and WILCKE2008a) found that concentrations are low in the solid phase of the organic layer, but that it is highly concentrated in throughfall and litter leachate. For TOC, Schrumpf et al. (Reference SCHRUMPF, ZECH, LEHMANN and LYARUU2006) observed a concentration increase from rain to throughfall to litter percolate, with rapid decreases in the mineral soil.
Due to the lack of an organic layer in the pasture, the storm flow here probably originates from the rooted surface layers and the humic A horizon, but a portion of the rain also enters the stream as overland flow. According to Makeschin et al. (Reference MAKESCHIN, HAUBRICH, ABIY, BURNEO, KLINGER, Beck, Bendix, Kottke, Makeschin and Mosandl2008) the upper 0–30 cm of pasture soil exhibit lower concentrations of K, Mg and Ca than the organic layer of the forest. The decreasing concentrations of Mg and Ca in the pasture stream during storm flow are thus explained. High levels of K, which might be deposited on, or leached by the pasture vegetation, could lead to the observed pattern of increased or steady state condition of K during high flows, even though K concentrations in the soil are not high (Elsenbeer et al. Reference ELSENBEER, WEST and BONELL1994).
Nutrient export
Nutrient export did not increase with deforestation, as was found by Likens et al. (Reference LIKENS, BORMANN, JOHNSON, FISHER and PIERCE1970) and Williams & Melack (Reference WILLIAMS and MELACK1997). The subcatchment with the highest degree of deforestation (M1) only showed slightly higher export values for Ca. For all other parameters export in M1 was similar to (Mg, Na) or lower than (K, NO3, SO4, TOC) in the forested catchments. However, discharge data in M1 had to be refilled in the period from April to August 2007 which of course could have led to a false estimation of export. We therefore also calculated export values only for the time period where measured stage data for M1 were available (September 2007–April 2008) and compared those again between stations. The same patterns (lowest export values in M1) remained and we are therefore convinced that a possible underestimation of discharge does not explain the overall low yearly export values of M1. Mixed catchment M2 seemed to be special in having high Ca, Mg and Na export values. One reason for this might be that stream M2 was used for gravel excavation during the sampling period just upstream of the road, close to where water samples were taken. The excavation activity might have increased the solute load of the river and contributed significantly to the export due to the otherwise low concentrations of montane stream waters. Another possible explanation is the difference in specific discharge. From September 2007 until May 2008 the specific discharge of M2 was three times higher (mean of 51.6 m3 ha−1 d−1) compared with M1 (19.0 m3 ha−1 d−1). With equally high nutrient concentrations in the stream water, export in M2 should therefore be roughly three times that of M1. This holds true for Ca and SO4 (export ratio M2/M1 was 3.0 and 3.1 respectively), and partly also for K, Mg and Na (1.6, 2.0, 1.8 respectively). We assume that the low specific discharge directly resulted from less precipitation over the northern slopes (in subcatchment M1). Unfortunately, due to the lack of precipitation gauging stations in the M1 catchment, our assumption of low precipitation inputs cannot be validated here. Other explanations could be diffuse stream losses to groundwater or interbasin transfer of water, but the steep slopes of the catchment as well as the hard bedrock most probably impede deep percolation.
Interestingly we could observe that NO3 export seemed to be positively related with forest cover in our study catchment (R2 = 0.93, n = 6). This finding confirms the study of Rhoades et al. (Reference RHOADES, ECKERT and COLEMAN1998) who state that under Setaria pasture soil-N is decreasing.
However, we could not analyse nutrient export of catchments M1 and M2 before conversion to pasture, and our results on the influence of land-use on nutrient export therefore have to be taken with care. Nonetheless, our values on nutrient export from forested streams F1 and F2 fall within the range reported for other (montane) forested watersheds, with the exception of McDowell & Asbury (Reference MCDOWELL and ASBURY1994) and Newbold et al. (Reference NEWBOLD, SWEENEY, JACKSON and KAPLAN1995) who report extremely high export values for Costa Rican and Puerto Rican montane forest catchments, respectively (Table 4).
Overview of literature values for nutrient export in tropical forests. Loads which were given as NO3-N and SO4-S were converted to NO3 and SO4 loads. Values from Boy & Wilcke (Reference BOY and WILCKE2008) and Germer et al. (Reference GERMER, NEILL, VETTER, CHAVES, KRUSCHE and ELSENBEER2009) are taken from bar charts. Values from Lesack & Melack (Reference LESACK and MELACK1996) are converted from equivalents ha−1 y−1.

Input–output budgets
We calculated nutrient input through rain to get a rough estimate of the current state of the ecosystem and to be able to evaluate the impact of land-use change on downstream areas. Our results on K, Na and NO3 budgets are similar to those of Lesack & Melack (Reference LESACK and MELACK1996), who describe a net accumulation of K in small forested watersheds in central Amazonia, as well as a net export of Na and NO3. For forested catchments in Brazil, Germer et al. (Reference GERMER, NEILL, VETTER, CHAVES, KRUSCHE and ELSENBEER2009) observed a net export in Na and K, a near neutral condition for Mg and a net accumulation in SO4 and NO3. In the same study, the net export of K and of Mg increased with deforestation, the latter of which coincides with our data. Boy & Wilcke (Reference BOY and WILCKE2008) reported for forested microcatchments within the R2 catchment a largely neutral to negative budget for Mg during the years 1998–2003 and positive to neutral budgets for Ca, as well as a net accumulation of K during the same period, all of which was also found for our forested catchments F1 and F2. The negative budgets for Na can be explained by weathering inputs, as was described earlier. For Mg and Ca dry deposition inputs which are derived from Sahara dust have been proposed by Boy & Wilcke (Reference BOY and WILCKE2008).
Due to the lack of sufficient data on fog nutrient concentration and input amount, and on dry deposition inputs two important pathways for nutrient input had to be omitted. Nutrient budgets will likely look different if all input pathways can be included in the budget calculation. The budgets for NO3 and SO4 for example, both of which are found in much higher concentrations in fog than in rain in our study area (Beiderwieden et al. Reference BEIDERWIEDEN, WRZESINSKY and KLEMM2005) might change if significant amounts of fog water contribute to total precipitation. Values for fog water contribution in cloud forests range from 3% (Hafkenscheid et al. Reference HAFKENSCHEID, BRUIJNZEEL, DE JEU and BINK2001) and 9% of total precipitation (Ataroff Reference ATAROFF and Gladwell2001, Ataroff & Rada Reference ATAROFF and RADA2000) to 16% (Eugster et al. Reference EUGSTER, BURKARD, HOLWERDA, SCATENA and BRUIJNZEEL2006) and 20% or even more (Bendix et al. Reference BENDIX, ROLLENBECK, RICHTER, FABIAN, EMCK, Beck, Bendix, Kottke, Makeschin and Mosandl2008, Bruijnzeel Reference BRUIJNZEEL2004). More data on dry deposition and fog water contribution are needed to draw final conclusions on the state of the study ecosystem.
In this study we investigated solute dynamics and export values of pristine and disturbed tropical mountain streams. We observed differences in the concentration-discharge relations of forested and disturbed streams and attributed these to varying flow paths. By calculating rain nutrient inputs we provided a first estimation of nutrient budgets in montane cloud forests. In this context, events such as El Niño and La Niña, which determine the direction of the weather regime in our study area also appear to be important, as can be seen by the SO4 and NO3 stream concentrations which were changing according to the predominant wind direction. Due to the extremely low nutrient concentrations in forested streams, changes in nutrient inputs and stream nutrient concentration most likely also entail changes in in-stream ecology (algal growth, macro-invertebrate feeding guilds). Preliminary data indicate a strong shift in macro-invertebrate species composition when these streams are disturbed, for example, by deforestation (A. Bücker unpubl. data). This issue definitely deserves further investigation.
In general, 1 y of data might seem too little to derive general conclusions on catchment functioning and seasonal patterns. Nevertheless the objective of this study was to investigate the differences of nutrient budgets among catchments of different land cover and hence the focus was on spatial differences rather than on closing the long-term nutrient budget. The present data provide a solid base for future studies, which may then together with long-term investigations lead to an improved understanding of the ecological interaction of land-use, stream flow and nutrient budgets of montane tropical rain forests.
ACKNOWLEDGEMENTS
We sincerely thank the Deutsche Forschungsgemeinschaft (DFG) for funding this project (FOR816 subproject B3.2, BR2238/4-1). We are indebted to Nature and Culture International (NCI) in Loja for providing research facilities and access to the area. Furthermore, we thank Thorsten Peters from the University of Erlangen for contributing unpublished meteorological data. The help of Beate Lindenstruth, Nelly Weis, Heike Weller and Dorit Zörner with the chemical analyses is appreciated. Lastly, we are grateful to Diego Mejia Veintimilla for his dedicated assistance in the hydrological measurements and sample collection.



