Introduction
There has been interest in the course and outcome of individuals with schizophrenia since Kraepelin (Reference Kraepelin1919) described the disorder as having a progressive downhill trajectory, a characteristic that he considered to be an integral feature of the illness. In his follow-up study, only 13% of subjects showed ‘recovery’. A meta-analysis by Hegarty et al. (Reference Hegarty, Baldessarini, Tohen, Watenaux and Oepen1994) of outcome studies by each decade since 1900 showed a disappointing lack of progress in improving outcome.
Long-term studies are of particular importance in advancing our understanding of the course and outcome of schizophrenia, but there are design issues that must be considered (McGlashan et al. Reference McGlashan, Carpenter and Bartko1988; Thompson et al. Reference Thompson, Newman, Orn and Bland2010). The period when the study is commenced is likely to affect the diagnostic criteria used and the treatments to which subjects are exposed. This has implications for the generalizability of findings. On methodological grounds, a cohort of incident cases is preferable to one comprised of prevalent cases, but the choice has implications for recruitment and sample size. Although a prospective design is more desirable than one that is retrospective, an extended period of observation brings with it an array of logistical problems as well as increased expense. A lengthy follow-up offers the opportunity to observe complex patterns of illness; however, there is a greater likelihood of drop-outs, with a resulting reduction in study power and an increase in random variation. It has been the practice in many studies to look at ‘outcome’ at a point in time. While this provides valuable information, it may miss features of the course of illness (Ciompi, Reference Ciompi1980; Carpenter & Kirkpatrick, Reference Carpenter and Kirkpatrick1988). Some long-term studies, for example, those by Vaillant (Reference Vaillant1964a , Reference Vaillant1978) and Stephens and colleagues (Stephens & Astrup, Reference Stephens and Astrup1963; Stephens et al. Reference Stephens, Richard and McHugh1997), searched for prognostic factors, with at least partial success, showing a better prognosis for those with a marked affective component or family history of affective disorder.
Jobe & Harrow (Reference Jobe and Harrow2005) reviewed the literature on the long-term outcome of individuals with schizophrenia, focusing on 11 studies with follow-up lasting a decade or more. Eight studies were from the USA (Vaillant, Reference Vaillant1964b ; Tsuang et al. Reference Tsuang, Woolson and Fleming1975; McGlashan, Reference McGlashan1984; Stone, Reference Stone1986; Harding et al. Reference Harding, Brooks, Ashikiga, Strauss and Breier1987; Carpenter & Strauss, Reference Carpenter and Strauss1991; Stephens et al. Reference Stephens, Richard and McHugh1997; Harrow et al. Reference Harrow, Grossman, Jobe and Herbener2005), two were from Canada (Bland et al. Reference Bland, Parker and Orn1976, Reference Bland, Parker and Orn1978; Bland & Orn, Reference Bland and Orn1978), and there was an international study conducted under the auspices of the World Health Organization (Harrison et al. Reference Harrison, Hopper, Craig, Laska, Siegal, Wanderling and Dube2001). Despite the difficulties involved in summarizing across investigations that sometimes used quite different methods, Jobe & Harrow (Reference Jobe and Harrow2005) were able to conclude that ‘patients with schizophrenia did not show a progressive downhill course’ and that ‘subgroups of schizophrenia patients had extended periods of recovery’, but overall ‘schizophrenia is nevertheless a disorder with relatively poor outcome’.
The above-noted Canadian studies considered by Jobe & Harrow (Reference Jobe and Harrow2005) were conducted by a single research group in the province of Alberta reporting on 10–14 years of follow-up. In this paper we examine the long-term course and outcome of schizophrenia through an extension of those studies to a follow-up of 34 years.
Material and method
Sample
We first describe the method used in the original Alberta studies. In the early 1970s, two retrospective cohorts were created using patient records from the psychiatric hospitals serving the province at that time – Alberta Hospital Ponoka (AHP) and Alberta Hospital Edmonton (AHE). Patients admitted to either of the two facilities for the first time in 1963 and receiving a diagnosis of schizophrenia according to DSM-II (APA, 1968) criteria were included in the cohort for that hospital. Patient records were carefully reviewed to exclude any cases where this was not a first lifetime admission, and to screen out those with psychotic affective disorder, an organic state, or any other condition felt to explain the clinical presentation. This yielded 137 cases (AHP 92, AHE 45). As there were very few general hospital beds in the province for psychiatric patients at that time, this method of recruitment encompassed virtually all hospitalizations for schizophrenia in 1963. Therefore, taken together, the AHP and AHE subjects are, for practical purposes, an incidence-by-first-admission cohort for the province (1963 population approximately 1.3 million).
In the earlier studies, 131 of the 137 cases were followed up retrospectively from 1963 until 1974–1975 (AHP) or 1977 (AHE). Information was collected directly from patients whenever possible, from as many relatives as could be contacted, and from all available medical records subsequent to the index admission. Evaluations were based on a composite of this information. Before follow-up was completed, developments in psychiatric research suggested that the use of diagnostic criteria more specific than those in DSM-II would be advantageous. Prior to the analysis of outcome data, 129 (AHP 86, AHE 43) of the 137 cases were re-evaluated. Since AHP and AHE cases were identified a few years apart, somewhat different approaches to reassessment were used for patients drawn from the two hospitals.
The 86 AHP cases were re-evaluated using Research Diagnostic Criteria (RDC; Spitzer et al. Reference Spitzer, Endicott and Robins1978) and a checklist for Schneiderian first-rank symptoms (Schneider, Reference Schneider1959). According to the RDC, 62 (72%) subjects had ‘definite schizophrenia’, 21 (24%) had ‘probable schizophrenia’, and three did not reach the threshold for a diagnosis of schizophrenia. Schneiderian first-rank symptoms were recorded in 46 (53%) subjects. The 43 AHE cases were reassessed using Feighner et al.'s (Reference Feighner, Robins, Guze, Woodruff, Winokur and Munoz1972) criteria, a checklist for Schneiderian first-rank symptoms, and the New Haven Schizophrenia Index (NHSI) (Astrachan et al. Reference Astrachan, Harrow, Adler, Brauer, Schwartz, Schwartz and Tucker1972). We used Feighner et al.'s item ‘a chronic illness with at least 6 months of symptoms prior to the index evaluation without return to the premorbid level of psychosocial adjustment’ to diagnose ‘probable schizophrenia’ (when it was not endorsed) rather than treating the item as an exclusion criterion. With Feighner et al.'s criteria modified in this way, 20 (44%) subjects had ‘definite schizophrenia’, 22 (49%) had ‘probable schizophrenia’, and one did not meet the threshold for a diagnosis of schizophrenia. Schneiderian first-rank symptoms were recorded in 33 (88%) subjects, and 42 (98%) had schizophrenia according to the NHSI.
For the present study, we extended the follow-up on 128 of the 131 subjects, taking the endpoint to be death or survival to 1997, whichever came first. This gives a period of observation of up to 34 years. All living patients who could be located were interviewed, as were family members of both living and deceased cases. To the extent possible, hospital files and other treatment records were accessed. Every effort was made to conduct interviews in person, often necessitating hundreds of attempts to contact an individual informant. The data on each case was reviewed by the project manager and one of us (R.B.) before being finalized.
Considerable effort was devoted to tracing patients who had moved out of the province, which accounts for our high rate of follow-up (98%, 128/131). Patients living in neighbouring provinces were followed up in the same way as those who remained in Alberta. For one individual who had returned to Denmark, we were able to directly interview him and his caregivers at both follow-up periods. For another patient who had returned to the former Yugoslavia and died by suicide, information was obtained from family members. It is notable that all interviews for the present study were conducted by the same project manager who had worked on the earlier Alberta studies.
Symptom severity scale
For each subject, symptom severity was quantified using a scale with the following anchor points: 0, psychiatric symptoms absent; 1, psychiatric symptoms present, but ordinarily no formal intervention other than perhaps outpatient counselling; 2, verifiable psychotic episode diagnosed by a physician, psychiatrist or other mental health professional, but no hospitalization; 3, hospitalization due to mental illness.
Typically, scores were assigned so as to reflect symptoms for each year of follow-up, but in certain years multiple scores might be given depending on events. On the other hand, when a report from the subject or family member covered several years, or when there were no significant departures from ongoing psychiatric status, several years in succession might be assigned the same score. As appropriate, intermediate scores between anchor points were assigned based on the subjective judgement of the project manager. Accordingly, scores fall in the range 0 to 3. The scores for each subject were plotted as a function of follow-up time, and the resulting points joined with line segments to produce a life-course curve. For descriptive purposes, we label scores <1.0 as ‘mild’, those ⩾1.0 to <2.0 as ‘moderate’, and those ⩾2.0 as ‘severe’.
Indices
To describe the course of illness, we defined a number of indices aimed at capturing the essential information in the life-course curves. For a given curve, the overall (average) score was defined to be the average height of the curve, obtained by dividing the area under the curve by the length of follow-up. The change in score was defined to be the average score over the second and third years of follow-up minus the average score over the last 2 years of follow-up. We dropped the first year of follow-up from the calculation to avoid the time period immediately after the acute hospitalization. Change in score was not defined for subjects followed for less than 5 years. A positive value on change in score indicates improvement from early in the course of illness to the end of follow-up. For each subject we also calculated the percent of person-years of follow-up lived with mild, moderate and severe symptoms.
The long-term course of schizophrenia can be quite variable. We wanted an index that would capture the extent to which the severity of symptoms fluctuated over the course of follow-up. A number of possibilities were considered that involved measurements on the height of peaks and the depth of valleys in a life-course curve, along with their steepness. Ultimately we settled on a computationally straightforward approach, defining the undulation index to be the average distance traced by the curve divided by the largest such value for the cohort, with the resulting magnitude expressed as a percent. The average distance traced by a curve equals the sum of the lengths of its constituent line segments divided by the number of years of follow-up. The motivation for the definition of undulation index rests on the observation that each change in direction (undulation) in a life-course curve necessarily increases its length compared to a flat trajectory, and the larger the distance from a peak to a valley, the greater the length of the curve.
Social functioning and loss of productive time
We included two measures of social functioning, both scored in reference to the end of the period of observation, i.e. just prior to death or the 1997 interview. The WHO Psychiatric Disability Assessment Schedule (WHO/DAS; WHO, 1988) is an interview schedule that is intended for use with key informants in conjunction with case records. It focuses on persistence and duration of dysfunctional behaviours. Individual items are rated on a 6-point scale ranging from no dysfunction (0) to maximum dysfunction (5). The Social and Occupational Functioning Assessment Scale (SOFAS) is a subscale of the Global Assessment of Functioning (GAF), the latter appearing as part of DSM-IV (APA, 1994). The SOFAS has anchors similar to the GAF, with scores ranging from 0 to 100.
Based on information from the patient and key informants, we estimated the loss of productive time by tallying the time spent in hospital for schizophrenia (including the index hospitalization) plus time lost due to non-hospitalized psychiatric morbidity during the follow-up period, with the result presented as a percentage of person-years since first admission.
Ethics
The study was approved by the Research Ethics Board of the University of Alberta, and by Alberta Hospital Edmonton and Alberta Hospital Ponoka.
Results
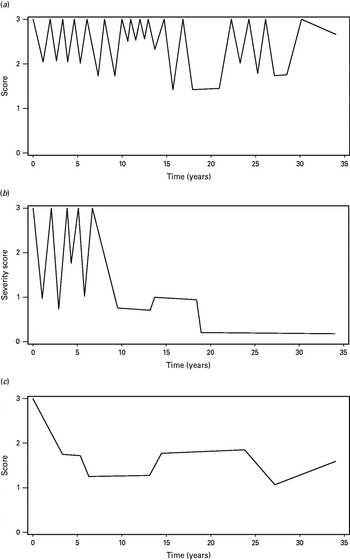
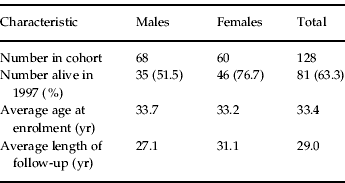
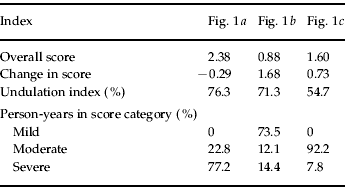
There were 128 subjects in the cohort – 68 men and 60 women, of whom 35 (52%) and 46 (77%), respectively, were alive in 1997 (Table 1). Average age at enrolment in 1963 was 33.4 years, and the average length of follow-up was 29.0 years. For illustrative purposes, Fig. 1 show three representative life-course curves, and Table 2 gives the corresponding values of the symptom severity indices defined above. The complete set of 128 curves is available as Supplementary material. Even a casual glance at this series demonstrates the remarkable diversity of experiences among those diagnosed with schizophrenia. Some individuals had a clearly chaotic course with ongoing and severe symptoms, as in Fig. 1 a, while others showed gradual improvement over time after a difficult initial period, as in Fig. 1 b. Some authors have suggested that schizophrenia can stabilize, and when it does, it tends to remain so for an extended period (Canadian Psychiatric Association, 2005 a, b). Our reading of the life-course curves is that there were only a few patients who exhibited ‘stability’ such as that shown in Fig. 1 c.
Three representative life-course curves for schizophrenia patients. (a) Chaotic course showing ongoing and severe symptoms. (b) Gradual improvement over time following a difficult initial period. (c) Relative stability over the course of illness.

Characteristics of cohort

Values of indices for Fig. 1(a–c)

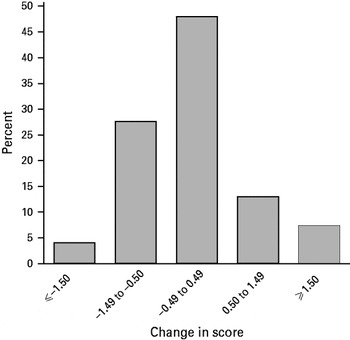
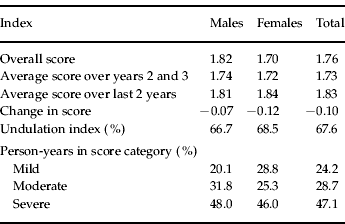
Table 3 gives the average values of the symptom severity indices across the entire cohort. The results for men and women are very similar, so we comment on the cohort as a whole. The average score over the last 2 years of follow-up (1.83) did not differ appreciably from the average over the combined second and third years (1.73). A modest association (Pearson's R=0.37, p<0.0001) was found between average scores over the second and third years of follow-up and average scores over the last 2 years of follow-up, demonstrating that consistency of symptom severity over the life-course, although positive, was not high. On average, 47% of time following initial hospitalization was lived with severe symptoms, while 29% and 24% of follow-up was spent with moderate and mild symptoms, respectively. Fig. 2 shows the distribution of change in score. Although many subjects showed little overall change, some improved, while others exhibited a worsening over time.
Distribution of change in score.

Average values of indices for entire cohort

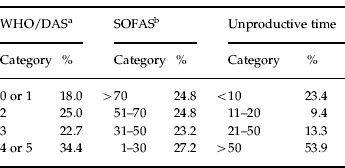
Table 4 gives results on WHO/DAS and SOFAS scores, and on loss of productive time (as a percent of time following initial hospitalization). Approximately one-fifth to one-quarter showed a good outcome on each of the scales (WHO/DAS 0 or 1, 18%; SOFAS >70, 25%; <10% loss of productive time, 23%). There is less consistency in the worst outcome group, with 34% scoring 4 or 5 on WHO/DAS, 27% with a score of 1–30 on SOFAS, but just over half (54%) showing a loss of productive time of more than 50% from first admission to follow-up.
Distribution (%) of WHO/DAS, SOFAS and unproductive time around the time of death or at the end of follow-up

a 0, No dysfunction; 1, no or minimum dysfunction; 2, obvious dysfunction; 3, serious dysfunction; 4, very serious dysfunction; 5, maximum dysfunction.
b >70, High function; 51–70, mild-moderate dysfunction; 31–50, severe dysfunction; 1–30, inability to function.
Discussion
We conducted a retrospective cohort study in which 128 subjects with schizophrenia were followed for up to 34 years. In this series, subjects suffered from severe symptoms nearly half of the time, and had moderate symptoms about one-quarter of the time. This, coupled with the lack of improvement in symptom severity over the life-course, paints a rather bleak picture of life with schizophrenia. Tempering this is the finding that some subjects showed improvement over the course of their illness, as can be seen in the Supplementary material.
As discussed above, conducting a long-term follow-up of individuals with schizophrenia raises a number of challenging design issues. The present study has several strengths in this regard. Subjects were effectively a 1-year incidence-by-first-admission cohort for the province of Alberta in 1963. Schizophrenia was diagnosed retrospectively using rigorous criteria that were current at the time the study was initiated. The follow-up period of up to 34 years is one of the longest to be found in the literature, and the rate of patient retention from the first assessment (at 10–14 years) to the end of the follow-up period was very high (98%). Time-series data on symptom severity were summarized using defined indices and computer-based algorithms, thereby ensuring complete reliability at the data summary stage. Some of the symptom data were gathered from archival material, and we relied on ‘best estimate’ information from multiple sources, including the patients, their relatives, and various medical records. All follow-up information was collected by a single interviewer with decades of experience conducting psychiatric studies. Whether this approach to data collection is superior to administering standardized questionnaires to only one or two informants is an open question.
The scale for rating symptom severity that we developed for the present study is admittedly not a sophisticated psychometric instrument. There were no tests of reliability or validity, and the scoring scheme is based on the untested assumption that the ‘distance’ between anchor points is uniform. Furthermore, the ratings may be confounded due to changes in the mental health system in Alberta during 1963–1997. Over that time period, there was a shift from hospital treatment to community care of the mentally ill, and with that a decline in the number of psychiatric beds per population. This means that towards the end of the period of follow-up, subjects were less likely to enter hospital than before, and so less likely to receive a score of 3. As a result, recent scores may be biased downwards relative to earlier scores, and as a consequence the overall change in score (which is a small negative number) might underestimate the true value.
Another methodological issue is the extent to which subjects were able to avail themselves of healthcare services. Since the mid-1960s, medical care in Canada has been socialized, with universal coverage of all residents. This means that psychiatric and other forms of care were available equally to all patients throughout the study period. This minimizes potential confounding due to differential access to healthcare, but on the other hand limits the generalizability of our findings to jurisdictions that have similar mechanisms of healthcare provision.
It is disappointing that the encouraging outcomes reported in the earlier Alberta studies do not seem to have been sustained through the longer follow-up. Information from patients and families suggest that during the early years after diagnosis, patients struggle with the illness, but the constant effort gradually takes its toll. With increasing age, the battle becomes less sustainable, leading to psychological demoralization and deterioration, and with that a decline in social functioning. The WHO/DAS and SOFAS results are consistent with this qualitative observation.
In summary, the findings of the present study generally support the conclusions of Hegarty et al. (Reference Hegarty, Baldessarini, Tohen, Watenaux and Oepen1994) and Jobe & Harrow (Reference Jobe and Harrow2005) that there has been little change in the prognosis for schizophrenia, and that overall it is a disorder with a relatively poor outcome.
Supplementary material
For supplementary material accompanying this paper, please visit http://dx.doi.org/10.1017/S0033291712000177.
Acknowledgements
The study was funded by grants from the Alberta Heritage Foundation for Medical Research, Alberta Mental Health Research Fund and the Medical Research Council of Canada.
Declaration of Interest
None.