This paper presents a sociolinguistically grounded examination of the role of regional dialect experience in shaping speakers' evaluation of vowel quality. Through the administration of the matched guise vowel perception test using synthesized vowel tokens, an earlier study (Fridland et al., Reference Fridland2004) investigated whether Southerners from Memphis, TN, found vowel formant positions associated with the changes affecting Southern dialects (the Southern Vowel Shift [SVS]) as more Southern sounding than nonshifted variants and whether, due to the apparently divergent nature of vowel changes across regions, front vowel positioning was more salient as a regional identifier than back vowel positioning. A follow-up study (Fridland et al., Reference Fridland, Bartlett and Kreuz2005) measuring how Memphians perceived speakers of these variants on pleasantness and education scales suggested that the greater the recognition of the variant as Southern, the lower its ratings on pleasantness and education scales. Overall, results from this work suggest that the ability of participants to accurately rate differences between vowel variants depends on whether the local community speech norms involve those particular variants and whether those variants are shared with other regions. Vowel dynamics also appeared to be a factor in whether Memphians recognized shifted variants as Southern, with long glided vowels increasing a vowel's potential for Southern association. The study clearly indicated that some shifts emerge as more salient regional markers than others, even when there is also widespread productive use of other localized shifts in the community. Both dialect exposure and mechanical linguistic factors played a role in which shifts were most readily assigned social significance.
Such results bring up the question of how speakers from outside the South would perform on the same test. Without similar dialect exposure, would listeners show less sensitivity to the “localness” of variants in their ratings and would different linguistic experiences alter the type of linguistic cues relied on to make such decisions? To approach these questions, speakers from Reno, NV, were given the same synthesized vowel token test used in the previous study. Comparing the Reno results to those found in Memphis, the study examines whether differences in regional vowel norms affect how Westerners rate Southern-shifted and non-Southern-shifted vowel variants on Southernness, competence, and solidarity scales. The study also looks at how Reno raters interpreted shifted back vowel variants, found productively in their local community, compared to front vowel shifts found exclusively in the South. Finally, the paper explores how the results suggest that regional dialect exposure attunes listeners to attend to different aspects of vowel quality than listeners from outside the region.
VOWEL CHANGES IN THE U.S.
Although American dialects generally share the same vocalic inventory, they differ substantially in terms of the phonetic range in which vowel tokens are realized within these prescribed categories. Much work in the variationist paradigm has focused on describing and instrumentally measuring the productive changes affecting the vowels in a variety of American dialects. A recent wealth of such work has lead to a very clear picture of regional differences and similarities, including some fairly dramatic shifts in the relative position of vowels in all three major dialect regions—the North, South, and West. (See work by Clarke et al., Reference Clarke, Elms and Amani1995; Eckert, Reference Eckert1988, Reference Eckert2000; Evans, Reference Evans2001; Feagin, Reference Feagin and David1986; Fridland, Reference Fridland2000, Reference Fridland2001, Reference Fridland2003a, Reference Fridland2003b, 2006; Gordon, Reference Gordon1997; Labov, Reference Labov and Penelope1991, Reference Labov1994, Reference Labov, Sharon, Cynthia, Thomas and Robin2000; Labov et al., Reference Labov, Ash and Boberg2006; Thomas, Reference Thomas1997, Reference Thomas2001).
The changes affecting front vowels in the three main dialect areas appear to be creating greater regional differentiation, with the high and mid-front system effectively moving in opposite directions across dialects. Acoustically, the formant structure of the realigned front vowels is associated with changes along both the first and second formants, F1 and F2, respectively (roughly, along the height and advancement dimensions). In the South, the most prominent change in the front system is the reversal in acoustic position of the /ey/ (bait) and /e/ (bet) class, with the nucleus of /ey/ appearing lowered and centralized and /e/ becoming higher and peripheral relative to /ey/. The position of /iy/ (beat) and /i/ (bit) is also similarly affected in some Southern dialects. In the Western and Northern systems, the front tense system retains its position at the front edge of the acoustic vowel space (although other vowel shifts affect and differentiate these two regions).
Contrasting the regionally distinguishing front vowel system, a number of similar changes affecting the back vowels, namely the fronting of /uw/, /u/, and /ow/, have been reported for all major dialect regions (Ash, Reference Ash and Arnold1996; Fridland, Reference Fridland2001, Reference Fridland and Bartlett2006; Hagiwira, Reference Hagiwara1997; Labov, Reference Labov1994; Luthin, Reference Luthin and Denning1987). In all these dialects, /uw/ and /u/ are the first back vowels to be affected by change, with /ow/ showing some shift in more advanced (and generally younger) systems, though shift in this class is much less common. The linguistic contexts for fronting also appear quite uniform (Fridland & Bartlett, Reference Fridland and Bartlett2006). In general, compared to the divergent regional trends affecting front vowels, the pressure toward back vowel fronting is more globally affecting American dialects.
Based on these convergent and divergent tendencies across regional dialects, the current study measures how these differences in regional dialect experience affect how listeners perceive and evaluate regionally unique vs. regionally shared vowel shifts. Certainly, a number of studies have suggested that speaker dialect affects vowel categorization tasks. Early studies such as Willis (Reference Willis1972) and Janson (Reference Janson, John and Jeri1986) showed that dialect experience indeed influences speakers' perception of vowel categories. Janson found differences in /a:/-/o:/ phoneme classification across two generations within the same community in Sweden, suggesting that changes in progress could be discerned by perceptual tests. Willis found differences in phoneme categorization for speakers from Buffalo, NY, compared to speakers from Fort Erie, ON, for the /e/-/æ/, /æ/-/ /, and /o/-/u/ oppositions. The current study, rather than focusing on whether phoneme classification is affected by participation in regional shifts, attempts to get at the social meaning, if any, such shifts carry and whether there is a difference in the recognition of global (shared) vs. localized changes.
This research joins a growing body of work examining the social meaning assigned to vowel differences. Niedzielski (Reference Niedzielski1999) used recordings of a Detroit speaker's raised /aw/ variant that she alternately introduced to raters as produced by either a Canadian or Michigan speaker to show that speech stereotypes play a role in the selection of the /aw/ variant listeners believed they had heard. Clopper and Pisoni (Reference Clopper and Pisoni2004) used sentences solicited from young men from regionally diverse dialect areas of the U.S. to measure how well listeners were able to identify the sentence producer's regional affiliation. They then acoustically measured how certain stereotypical regional variants such as /ay/ monophthongization were correlated with the sentences rated most accurately by region, suggesting that those variants are most responsible for triggering regional association. These studies suggest that speakers do use phonetic cues in classification of sounds and social traits, revealing that we are perceptually aware of this phonetic variation and its related social embedding and use it to organize our experience. Labov and Ash (Reference Labov, Sharon, Cynthia, Thomas and Robin1997) examined the role of regional sound changes on listener identification of Southern vowels using real speech data from young speakers in Birmingham, AL. In the controlled vowel identification and gating tests, they found speakers surprisingly bad at correctly identifying what words they heard, even when they were from the same dialect as the target speaker. However, Birmingham listeners did show greater ability than nonlocals to change their initial misidentification using context as cue. Such results suggested their possible acoustic range for a particular vowel was more fluid, having been exposed to advanced and less-advanced tokens of vowels involved in the sound change. In addition to those cited here, Thomas (Reference Thomas2002) provides a comprehensive overview of other recent studies that explored the importance of perception to sociolinguistic research.
In general, this previous work attempts to better understand how vowel differences become social resources for speakers and the role such social factors may play in the process of language change. These types of studies recognize the importance of examining not just speech production but speech perception from a sociolinguistic perspective and point to an emerging and promising area of research. The move toward integrating the study of perception with work measuring the productive patterns found in local communities might begin to successfully address some of the larger questions about the origin and diffusion of sound change that have preoccupied sociolinguists over the last several decades. Within this context, the current paper explores how perception research might be used to provide insight into the formation of the meaning-making processes used by speakers to approach the task of unraveling the social import of the speech surrounding them.
PREVIOUS WORK IN MEMPHIS
The earlier research in Memphis consisted of three parts: a production study, a perception study, and a folk dialectology study. The production study (Fridland, Reference Fridland2000, Reference Fridland2001, Reference Fridland2003a, Reference Fridland2003b) measured the participation of Memphians in the SVS, the series of phonetic changes affecting the high and mid-front vowels in Southern speech. For Memphians, this shift is most prominently realized in the /ey/ and /e/ classes, with complete reversal the norm for most speakers, both White and Black. High front vowels retain their traditional relationship, although they are much more closely aligned than is found elsewhere. While /ey/ centralization remained fairly robust in the Memphis system for all speakers, /e/ peripheralization was much less vigorous, particularly among younger speakers. A later study (Fridland & Bartlett, Reference Fridland and Bartlett2006) examined the degree to which back vowel fronting had affected the Memphis system. This research showed an extreme shift present for Memphians in both the /uw/ and /u/ classes. Shift in the mid-back /ow/ class was much less advanced, with younger speakers showing significantly more shift in /ow/ than older speakers (F[32] = 4.69, p < .05). This research provided the description of community norms on which the subsequent perception study was based.
The perception study (Fridland et al., Reference Fridland, Bartlett and Kreuz2004, Reference Fridland, Bartlett and Kreuz2005) was designed to determine the degree to which Memphis speakers recognized these shifts occurring in their regional vowel system as local variants. Results showed Memphians were more likely to recognize different degrees of shift in the front vowels as signaling increasing Southernness than different degrees of shift in the back vowels, even though Southerners have been reported to be quite advanced in back vowel fronting (Labov, Reference Labov1994, Reference Labov2000; Thomas, Reference Thomas2001). Vowel length and diphthongization also appeared to be a factor, with short front vowels showing the lowest amount of perceptual recognition. For example, the /i/and /e/ tokens were the only token types to show accuracy rates less than chance. Memphians performed much better on vowels with more complex and longer trajectories, suggesting that such information was useful in interpreting the social information carried by vowel variants.
However, structural differences did not fully account for the ratings given to the different vowel classes involved, as subjects did not consistently rate all long vowels with the same degree of accuracy. Results also suggested that the recognition of variants seemed to be tied to community vowel norms, with listeners showing greater accuracy in recognizing shifts found uniquely as Southern variants compared to shifts found in many U.S. dialects, such as fronted high back vowels. Participants' performance on the “Southernness” test suggested that local norms are perceptually available to listeners, with acoustic and structural effects mediating the recognition of such norms. A follow-up study (Fridland et al., Reference Fridland, Bartlett and Kreuz2005) measured how Memphians perceived these same Southern-shifted vs. nonshifted variants on pleasantness and education scales. Results from this task suggested that the more the token had been shifted toward SVS norms, the lower the token was ranked on education and pleasantness.
This research seems to suggest that local dialect experience did play a role in how participants perceived the vowel variants on a number of social dimensions. To further assess the impact of productive dialect patterns on listeners' recognition and evaluation of local and nonlocal speech samples, this study administers the same test outside the region, in an area that clearly involves different dialect exposure than that in the South. Running the same studies in a region that does not share some of these local changes can lend insight into whether this earlier study really showed any local advantage in perception and how these shifted variants are comparably evaluated by those not using them productively. Reno speakers, in contrast to Memphis speakers, maintain the traditional alignment of the high and mid-back classes, with /iy/and /ey/ remaining along the front periphery of vowel space. (J. H., a young Reno native, provides a sample Reno system in Appendix I.) Although not as advanced as most Memphians, Reno speakers share the tendency toward back vowel fronting, most extensively in the /uw/ and /u/ classes. So, by administering the perception test performed in Memphis in a region showing both distinct and similar trends, we can examine how much local dialect experience affected Memphians' recognition of shifted vowel variants.
METHODOLOGY
The current study replicates the study performed in Memphis using the same stimulus and testing materials. An abbreviated methodological description follows. Full description of synthesis procedures and study methodology appears in Fridland et al. (Reference Fridland, Bartlett and Kreuz2004, Reference Fridland, Bartlett and Kreuz2005).
The perception study was administered to 230 subjects native to Reno, NV. As the study participants were recruited at a university, the vast majority of participants were between the ages of 18 and 25, similar to the Memphis administration. The study was designed as a matched guise test using synthesized vowel tokens manipulated roughly by intervals of 25 to 50 Hz on vowel height frequencies (F1) and vowel front/back advancement frequencies (F2), respectively. Participants were played two of these slightly altered versions of the same monosyllabic word presented in a two-word set, with each member of the pair having been altered along the first formant and/or second formant dimension.
Each token pair presented two versions of the same vowel in three possible contrasts along a shifted Southern to non-Southern continuum: two Southern-shifted variants, with one version exhibiting a greater degree of the same shift, one Southern- shifted and one non-Southern variant, or two non-Southern variants, with one variant more traditionally positioned than the other variant. Target values for synthesized tokens were based on the frequency ranges for vowel trajectories observed in earlier work on the realization of the SVS (Fridland, Reference Fridland2000, Reference Fridland2001, Reference Fridland2003a, Reference Fridland2003b) and on the mean frequency ranges provided for American speakers by a number of different researchers, summarized in Kent and Read (Reference Kent and Charles2002).
After hearing the token pair, the participants were asked to determine which pronunciation of the word was the most “Southern” sounding. In calculating the results, participants were considered accurate in their selection of the most Southern token when they selected the token exhibiting the most Southern shift or the least non-Southern shift.
Following this part of the study, participants were asked to rate a subset of these tokens on education and pleasantness scales. The /ey/, /e/, /uw/, and /ow/ tokens were selected out of the larger set used for the Southernness study, as these tokens are the most commonly or uniquely affected vowels in the Southern system. This test used a three-point scale from one (least) to three (most). Paired comparisons t-tests were run within each regional sample and independent t-tests were used to compare the results across the regional samples.
RESULTS AND DISCUSSION
Reno participants' Southerness ratings
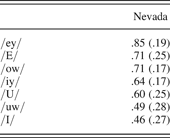
Table 1 presents the results by descending mean score within the Nevada sample. Clearly, the /ey/, /e/, /ow/, and /iy/ classes are the most salient to Reno raters as recognizable Southern markers. Although Reno participants performed significantly better than chance in recognizing Southern variants of /u/ (t[230] = 6.17, p < .01), the /uw/ and /i/ classes were accurately rated just at or less than chance, respectively. In general, Southern-sounding front vowels were more easily recognized than Southern-sounding back vowels, with the exception of the /ow/ class. The increased awareness of shifted variants in this class, however, is not surprising considering such shift, although it does mildly affect the Nevada system, seems to be less advanced than shift in either high back vowel (and, as will be discussed later, similar /ow/ salience was found for Memphis speakers). Although /uw/ and /u/ shift in an analogical pattern (Labov, Reference Labov1994), it is less clear that shift in /ow/ involves the same underlying drift mechanism, and it is predominately found in younger speakers' systems, suggesting an incipient shift compared to that found in the high back vowels. In addition, close proximity to California, where /ow/ fronting carries an association with “Valley girl” talk may also make /ow/ shift more salient than the more progressed and widely distributed shifts affecting other back vowels. In this task directing their attention to perceiving Southern speech patterns, any marked shift, as /ow/ appears to be, may be heard as Southern to Reno listeners. On the other hand, shift in the /uw/ and /u/ class is widespread productively in the Reno area, explaining the difficulty in picking out Southern- vs. non-Southern-soundig variants.
Reno raters' descending mean accuracy scores for selecting the most Southern-shifted token in each token pair
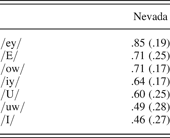
Note: ( ) Indicates standard deviation.
Why the /i/ shift was difficult, however, is not clear, particularly because all the other front vowels were quite salient for participants. Vowel trajectory information does not appear to make much of a difference in terms of Nevadans' ability to recognized Southern-sounding variants, as there was no real pattern to the results by vowel length or gliding. If short vowels were somehow less accessible to listeners, then /e/ and /u/, which show accuracy rates significantly better than chance, t(230) = 12.51, p < .01 and t(230) = 6.17, p < .01, respectively, should also show similarly low accuracy rates. These results suggest that, in fact, Reno respondents are fairly accurate in recognizing Southern-sounding vowel realizations, regardless of vowel complexity. Moreover, these vowel distinctions are particularly salient for front vowels and the /ow/ vowel. What Nevadans are using as an internal guide in making Southern judgments is less clear. It is doubtful their ratings are a result of much exposure to Southern speakers, as few of the subjects report much travel experience outside the West. In addition, no significant differences were found in rating trends between participants who had traveled outside of the West and those who had not. Instead of Southern exposure, Reno participants must be relying on some type of internal model of vowel space that maps the fit with the acoustic vowel position most familiar to them, that is, that found in their own dialect. Vowel variants that sound closest to their own would be a less likely candidate for a Southern token than variants that are less familiar.
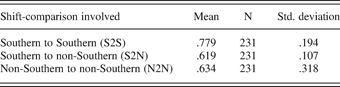
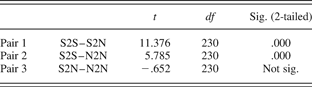
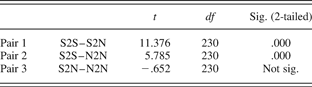
When looking at the results (Table 2) in terms of what type of contrast was involved in the token pair, Reno raters appeared to be better at selecting the most Southern-shifted token in token pairs where the contrast between the two pronunciations was a matter of degree of Southern shifting (e.g., a mild Southern shifting compared to more extensive Southern shifting). In fact, they performed significantly better when such pairs where involved than when the token pairs involved either Southern to non-Southern pronunciations or non-Southern to non-Southern pronunciations (Table 3). Such results are interesting as it would seem that token pairs involving Southern-shifted tokens compared to nonshifted tokens would make the Southern articulation more salient. However, in contrast, hearing two tokens exhibiting different relative degrees of the same shift actually made it easier for Reno participants to pick up on the more shifted token. Such results are not so surprising when formant normalization effects such as those found in Lagefoged and Broadbent (Reference Ladefoged and Broadbent1957) are considered. In that study, the researchers found that speakers were able to meaningfully perceive low-level variation in vowel quality by using internally constructed default settings if given no additional information to help them analyze the acoustic range used by a speaker. However, when played a phonetically altered unambiguous sentence before hearing a target sentence, participants seemed to analyze the acoustic range used for vowels exhibited in the priming sentence to determine the proper vowel quality of the selected vowels in the target sentences. It appears that something similar may be at work here, with participants using the relative degrees of shift to determine more and less extreme vowel differences.
Mean scores by token pair shift-comparison type
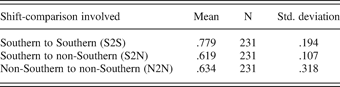
T-tests comparing Reno raters accuracy by shift-comparison type
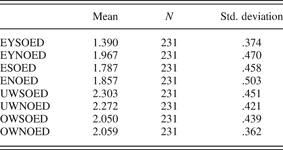
Reno participants' education and pleasantness ratings
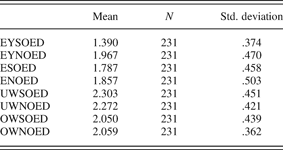
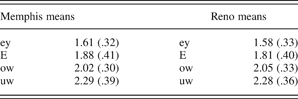
Table 4 shows the Reno results for rating perceived speaker education levels for a subset of the tokens used in the Southerness test (/ey/, /E , /uw/, /ow/). Southern shifted tokens (SOED) receive lower ratings on education, but only when they involved the front vowel classes. When Southern shifted back vowels were compared to their nonshifted (NOED) back token counterparts, education ratings did not seem to be affected. For the front vowels, however, education ratings were pulled down by Southern shifting. This rating difference was significant for the /ey/ class (t[230] = 17.11, p < .01) and near significance for the /e/ class (t[230] = 1.95, p < .053), but neither back vowel class showed any significant difference in ratings between Southern- and non-Southern-shifted tokens.
Reno education ratings by vowel class ad regional shift type
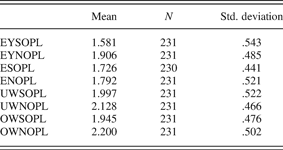
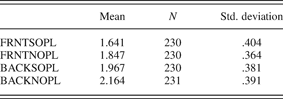
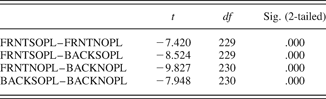
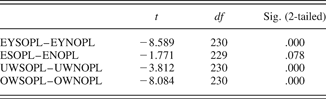
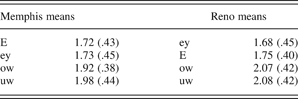
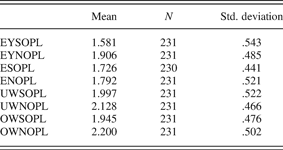
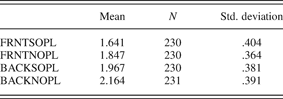
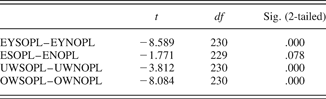
Compared to education ratings, pleasantness ratings were more consistent across vowel class by regional variant type (Table 5). Reno raters found all Southern-shifted tokens, regardless of front or back association, significantly less pleasant than nonshifted tokens, although they still found back vowels significantly more pleasant than front vowels, regardless of shift type (Tables 6 and 7). As can be seen in Table 8, this difference in ratings was also significant within vowel classes with the exception of the shifted /e/ tokens, which, although not significant, still received lower mean scores for Southern-shifted variants. Clearly, less familiar or nonlocal variants are not as well received on solidarity scales regardless of how they fared on competence scales. In fact, comparing mean scores in Tables 4 and 5, most tokens received lower pleasantness scores than education scores regardless of shift type, suggesting that even the less educated sounding tokens did not receive the benefit often accrued by nonstandard variants on solidarity scales.
Mean pleasantness ratings by vowel class and vowel shift type
Mean pleasantness ratings by vowel subsystem and regional shift type
Comparison of pleasantness ratings by vowel subsystem and regional shift type
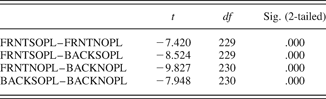
Comparison of pleasantness ratings by vowel class and regional shift type
Memphis and Reno participant comparison for Southerness ratings
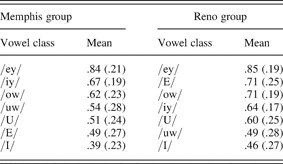
Table 9 compares descending mean scores for accuracy for the Memphis and Reno samples, respectively. Memphis participants were accurate at identifying which word was the more Southern-shifted token at an overall rate of 58% (t[140] = 10.02, p < .01), significantly better than chance, with accuracy rates for individual vowels varying from 84% to 39%. Surprisingly, Reno participants were significantly better overall than Memphians at identifying the more Southern-shifted token in the test as a whole (t[437] = 5.51, p < .01), performing at an overall rate of 63% and they also had a slightly smaller (and higher) range for rating individual vowel classes, from 85% to 46%.
Descending Southernness test mean accuracy scores for Memphis run compared to Reno run

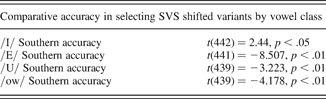
Looking at their comparative results, some similarities and contrasts emerged in the two regional samples' rating trends. First, the vowel subsystem appears to make a difference in rating accuracy for both groups. As in Memphis, Reno raters also appeared to respond to the salience of front vowels as Southern markers, with greater accuracy identifying Southern variants in the front subsystem compared to the back subsystem as a group (t[230] = 4.04, p < .01). Both the Memphis and Reno participants performed best when hearing the /ey/ vowel pairs, with both groups showing an accuracy rate over 80%. In addition, the short front vowel /i/ was the most difficult for listeners in both groups, where they both performed significantly below chance, t[212] = 5.67, p < .01 and t[230] = 2.51, p < .05 for Memphis and Reno raters, respectively. The two regional groups were statistically identical in determining which member of the two-token pair was more Southern for the /iy/, /ey/, and /uw/ classes, but were significantly different in which token was heard as more Southern in the /i/, /e/, /u/, and /ow/ classes. Surprisingly, it was Nevada speakers that were significantly better at picking out the most Southern variant in all four of these classes (Table 10).
Memphis to Reno comparisons

Interestingly, most of these significant differences between the groups revolved around short vowel classes. A strong influence on Memphians' ability to select the most Southern-shifted token appeared to be vowel length and gliding, with longer more dynamic vowels serving more often as salient cues to a token's potential for making Southernness. Reno raters, on the other hand, did not appear to show more sensitivity to long tense vowels, as they showed comparatively high rates of accuracy for short vowels, with both /e/ (t[230] = 12.51, p < .01) and /u/ ratings (t[230] = 6.17, p < .01) significantly above chance and short vowel accuracy rates dispersed across their ratings range. When comparing the Southern pronunciations, Reno raters seem to be using their own vowel formant ranges as the default or prototype, making F1 and F2 positions outside that range more salient, rather than length and gliding. Such a pattern-matching approach to speech perception has been widely discussed, particularly by Massaro (Reference Massaro1987), as the Fuzzy Logical Model of Perception (FLMP). Particularly important in such a model is the integration of multiple cues that are used to arrive at a decision in the processing and categorizing of speech input, with all features contributing to the ultimate outcome but to differing degrees. Such a model that assumes that a variety of factors influence participants' input processing suggests that such cues or features could have relative rankings of importance to different participants, depending on experience. Thus, the reliance of Memphians but less so of Reno raters on length and gliding, common features in Southern speech, becomes not so surprising. Reno participants, with little first hand experience, rely more on F1 and F2 difference from their own dialect (which presumably provides their prototype experience).
Clearly, Memphis and Reno raters are using different cues in interpreting what sounds Southern and what does not, with vowel dynamics a much more important cue for Memphians. Still, for both groups, formant differences in the front tense vowel subsystem are the most marked for Southern/non-Southern association, suggesting that these vowels in particular serve as indicators for Southernness for groups inside and outside the South. Shift in the /ow/ class, occurring less often and predominately in young speakers' systems, also carries Southern (or nonstandard) salience. On the other hand, fronted high back vowels, a shift shared by both the Memphis and Reno speakers, are less often recognized as markers of Southernness by both groups than these other vowels. However, shift in the short front subsystem only signals a Southernness association for Nevadans. Memphians' recognition of Southern variants appears to occur only for tense vowels, suggesting that, for Memphians, duration and gliding make vowels relevant as Southern variants, leading them to look for salient formant differences.
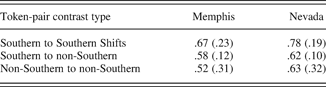
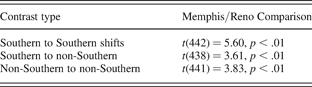
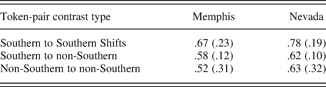
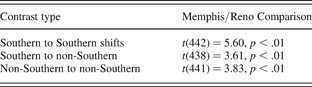
Looking at their comparative performance based on token-pair contrast type, both groups were more accurate in selecting the most Southern pronunciation when the token-pair contrast involved mild/moderate Southern shift to more extreme shift (Table 11). For all contrast types, Reno participants performed significantly better than Memphians (Table 12), echoing their generally more accurate ratings by vowel class discussed above. These results lead to two observations: (a) formant normalization effects are at work here regardless of regional background and (b) having default settings for the vowels that differed from the test dialect (e.g., Western norms) aid speakers in recognizing formant contrast. In other words, Nevadans perform better at selecting the most Southern-shifted vowels because they can use distance from their own vowel system to help guide them. This strategy results in Reno participants' better overall performance, particularly when rating the short vowel subsystem. Using their own system as a guide, Reno participants were fairly good at picking out the contrasting Southern variant in short and long vowels alike, whereas Memphians, using local norms for Southernness as a guide, performed well only on the long tense vowels, in which shifts were more often heard as Southern features.
Memphis to Reno comparisons for overall shift-type categories
T-test comparisons for Memphis to Reno results
Comparison of education and pleasantness ratings
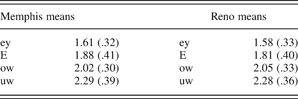
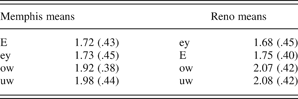
Tables 13 and 14 provide increasing mean scores by vowel class for education and pleasantness ratings for the Memphis and Reno groups, respectively. The mean education score ordering was identical for both Memphis and Reno raters, with /ey/ class tokens sounding the least educated and /uw/ class tokens sounding the most educated. Front vowels were clearly heard as less educated than back vowels. There was more contrast between the groups in terms of pleasantness scores, but both groups still found front vowels less pleasant than back vowels.
Increasing education mean scores by vowel class
Increasing pleasant mean scores by vowel class
CONCLUSION
Based on the findings reported above, it appears the salience of Southern speech and Southern speech markers has traveled far outside the South. Both Reno and Memphis raters show higher rates of recognition for Southern formant positions when the vowels involved the long front vowels and the mid-back vowel /ow/. The high back vowels showed lower rates of Southernness accuracy in both the Reno and Memphis samples. Regional uniqueness seems to be at work here as the vowel shifts found in the South but not shared by Reno speakers showed higher recognition rates than shifts in the /uw/ and /u/ classes that are more widespread.
Although raters in both regions showed several of the same trends in terms of what sounded most Southern, Memphis and Reno raters appear to use different criteria to help them judge the Southernness of tokens. For Reno raters, distance from their own system seems to determine which classes were most salient, and vowel dynamics did not appear to be much of a factor. On the other hand, for Southerners, vowel trajectory appeared to play a very important role in denoting Southernness. It is not that longer more dynamic vowels are necessarily more likely to shift, as short front vowels also have shifted variants, but that shifts affecting tense vowels are more likely to be attended to in terms of this social marking, and shifts affecting short vowels appear off the social radar. Clearly, dialect stereotypes that recognize a Southern drawl feature make reference to this perceptual acuity for longer diphthongal vowels. What is surprising is that Reno raters and Memphis raters do not rely on vowel dynamics to the same degree and that Reno raters are actually more attuned to formant shifts that are unique to the South, as evidenced by their greater accuracy in placing Southern shifted /e/ and /i/ tokens. In fact, their overall greater accuracy in this task, regardless of vowel class, suggests that, when forced to base decisions on internalized norms, speakers perform better when the dialects involved are different from their own.
Based on the results of this study, it appears that a number of different factors both mechanical (vowel dynamics, type of formant change) and social (shift uniqueness, dialectal difference) influence the meaningfulness of vowel change with the aspects most salient varying by community. In addition, local dialect experience does not necessarily increase speakers' ability to recognize their own productive norms. Such results suggest that researchers must be careful when making generalized claims about what features are salient markers of various social facts such as gender, region, or ethnicity and the degree to which speakers attend to them. Clearly, community and speaker group differences go well beyond altering only productive resources to in fact even altering what linguistic cues are relied on in making perceptual distinctions on speech input.
APPENDIX I
Sample Reno Speaker system (J. H., a younger White female)