Introduction
These days, people are commonly affected by diseases such as diabetes, strokes, uric acid, high cholesterol level in blood, kidney failure, and many more because of taking food containing impurities in it. Some of these diseases occur due to the intake of excessive sugar, salt, or oil in their diet. Therefore, a consumer should be aware of these ingredients in their diet before consuming it. Many methods have been proposed to detect such contents in food [Reference Celik, Gagarin, Huang, Iskander and Berg1, Reference Shaji and Akhtar2]. One such method has been reported to measure the salt content in soil [Reference Gartley3]. Another method proposed for measuring dielectric concentration of starch using an open-ended coaxial probe [Reference Bircan and Barringer4]. These procedures are considered to be complex and time-consuming as well as their system development cost is very high [Reference Ansari, Jha and Akhtar5–Reference Silavwe, Somjit and Robertson7]. To prevail over these problems, microstrip-based technology is being used as it is widely profitable in recent era in the number of fields such as agriculture, medical, communication, etc. [Reference Cheng, Fareq, Afendi and Seng8–Reference Ghretli, Khalid, Grozescu, Sahri and Abbas10]. Nowadays, dielectric-based sensors are being widely used which depends upon physical as well as dielectric properties of the material [Reference Barakat and Ndagijimana11, Reference Alahnomi, Hamid, Zakaria, Sutikno, Azuan and Bahar12]. Such sensors are used for measuring moisture content, temperature, fuel adulteration, etc. [Reference Khalid13–Reference Kakani, Chandu and Karthikeyan15]. For instance, a microstrip patch antenna (MPA) is developed for measuring the moisture content of hevea rubber latex [Reference Yahaya, Abbas, Ismail and Ali16]. Furthermore, an MPA is developed for measuring the sugar salt content in water at 2.45 GHz with relatively large antenna size [Reference Rahman, Islam and Samsuzzaman17]. Reflection methods and waveguide probes have been used for medical diagnostics [Reference Zajıcek, Smejkal, Oppl and Vrba18]. The ridged waveguide technique has been developed for determining moisture content in oil palm fruits [Reference Abbas, Mokhtar, Khalid, Hashim and Aziz19]. An imaging system with high performance ultra-wideband has been used for medical diagnosis [Reference Mahmud, Islam and Samsuzzaman20]. Further for humidity sensing a polymer-loaded ultra-high frequency radio-frequency identification antenna has been developed [Reference Manzari, Occhiuzzi, Nawale, Catini, Natale and Marrocco21].Various methods that are reported in literature until now for determining the moisture content and soluble solid material in agricultural products are quite time consuming and cause measurement errors [Reference Azaryan, Batouritski, Budagov, Demyanov, Karpovich, Liubetski, Maximov, Rodionova and Shirkov22–Reference Tiwari, Singh, Mondal and Akhtar24]. Therefore, to overcome such problems a cost-effective, novel, and simple method is required to determine the adulteration more economically. Further to improve spatial resolution and penetration depth a wider bandwidth and higher frequency is preferred [Reference Zhaozong, Zhipeng and John25].
In this article, a simple and novel rake-shaped microstrip antenna sensor with high spatial resolution is presented to detect the presence of foreign substances in liquid samples. The suggested antenna is used as a liquid sensor to detect the adulteration in liquid by demonstrating the relationship between concentration, shift in resonance frequency, and variation in reflection coefficient in order to show the applicability of the proposed approach.
Antenna design and fabrication prototype
Antenna design
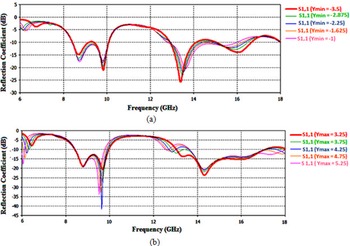
The structure of the proposed rake-shaped microstrip antenna used as a liquid sensor is reported in Fig. 1. The antenna has a compact size of 30 × 27 mm2. The top and bottom views of the proposed antenna in Computer Simulation Technology Microwave Studio (CST MWS) are shown in Figs 1(a) and 1(b), respectively. The microstrip patch radiator is printed on one side of an FR4 substrate with relative permittivity (εr) of 4.4, thickness 1.57 mm, and loss tangent 0.0025. Furthermore, on opposite side of the FR4 material a slotted defected ground structure is represented. The rake-shaped radiating patch has been used to achieve maximum bandwidth. The resonance characteristics of radiator are controlled by the structure and size of microstrip patch which is influenced by the coupling between radiating patch and slotted partial ground. For perfect impedance matching, the radiating patch is being fed by a 50-Ω transmission line using the microstrip feeding technique. This feed strategy utilizes a conducting strip that is specifically associated with the edge of radiating patch. This feeding method is simple, easy to fabricate, and gives high impedance. Hence, the proposed geometry of the microstrip sensor is considered keeping in mind the size constrains, bandwidth, coupling effects, and reflection coefficient. Figure 2 presents the parametric sweep of “Ymin” for slot 7 (S 7) in radiating patch and “Ymax” for reduced ground plane that contributes in attaining desired resonant frequency. The optimized geometrical parameters of the proposed antenna are depicted in Table 1. The performance of the microstrip sensor is affected by various factors such as patch size, location of feed point, and different shapes of patch. Thus, for optimum performance patch dimensions and feeding point location should be determined first.
Geometrical configuration of the proposed antenna as a liquid sensor: (a) top view in CST and (b) bottom view in CST.

Parametric sweep for (a) slot 7 in radiating patch and (b) reduced ground plane y-axis.

Optimized dimensions of proposed antenna as a liquid sensor

Fabrication prototype of proposed antenna
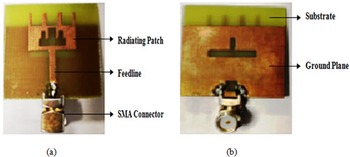
The proposed rake-shaped microstrip antenna sensor has been fabricated using wet-etching-based conventional photolithography technique for practical experiments and the fabricated prototype for the proposed antenna sensor is presented in Figs 3(a) and 3(b). The reflection coefficient of the antenna has been measured using the Agilent E5071C Vector Network Analyzer (VNA), with frequency range from 4 to 18 GHz. The simulated and measured results are plotted with the help of Microsoft Excel 2007. The experimental results have been performed in Antenna Research Laboratory at Electronics and Communication Engineering Department, Thapar Institute of Engineering and Technology, Patiala, Punjab, India.
(a) Top view of the fabricated prototype and (b) bottom view of the fabricated prototype with a four-hole SMA connector.

Selection of frequency
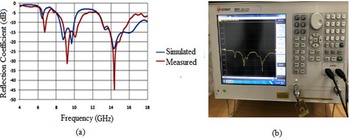
Figure 4(a) illustrates the simulated and measured reflection coefficient of the proposed antenna. In simulation, the antenna exhibits a dual-band response covering the bandwidths from 8.41 to 9.96 GHz and 13.03 to 17.1 GHz with −10 dB return loss generating three resonant frequencies 8.87, 9.68, and 14.31 GHz with reflection coefficients of −19, −20.7, and −23.7 dB, respectively. Furthermore, the measured results show a triple-band response covering the bandwidths from 6.53 to 7.11 GHz, 8.52 to 10.43 GHz, and 13.03 to 15.98 GHz with −10 dB return loss generating three resonant frequencies 6.89, 9.51, and 14.32 GHz with reflection coefficients of −15, −30.9, and −45 dB, respectively. The snapshot of the measured result with VNA for the proposed antenna is depicted in Fig. 4(b) which has been included here to support Fig. 4(a). The resonant frequency both in simulation and measurements is 14.3 GHz which is the highest among the mentioned frequencies and demonstrates the lowest reflection coefficient. Therefore, the frequency with a wider frequency range and the lowest reflection coefficient is preferred to justify the feasibility of the proposed antenna as a liquid sensor. Moreover, the measured results show better performance for reflection coefficient and resonant frequency compared to simulated ones. The proposed antenna shows the accuracy of 98% which is estimated by measuring gain, efficiency, Q-factor, and sensitivity of the proposed antenna [Reference Kunte and Gaikwad26, Reference Tiwari, Singh and Akhtar27]. The Q-factor is calculated using Q = f r/Δf, where fr is the resonant frequency and Δf is the bandwidth, so using the above formula the value of Q-factor is calculated as 485.
Fabricated prototype: (a) simulated and measured reflection coefficient of the proposed antenna and (b) snapshot of measurement with the VNA.

Antenna characterization
Gain and efficiency of proposed antenna
Figures 5(a) and 5(b) illustrate the simulated and measured gain and radiating efficiency of the proposed antenna. It is observed that the proposed antenna depicts the measured value for maximum gain and radiation efficiency as 6.81 dBi and 75%, respectively, which is nearly equal to the simulated value of gain and radiating efficiency of 6.54 dBi and 70%. These simulated and measured results demonstrate that the antenna works accurately and efficiently.
(a) Simulated and measured gain and (b) simulated and measured radiation efficiency for the proposed antenna.

Surface current distribution and radiation pattern for proposed antenna
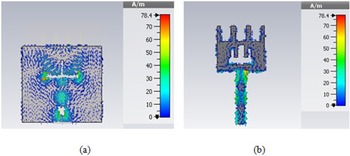
Figures 6(a) and 6(b) show the current distribution on the excited resonant modes of the proposed antenna at 14.32 GHz. Figure 6(a) presents the surface current distribution on the ground plane which depicts that the slots in the ground plane contribute to antenna performance. Furthermore, Fig. 6(b) illustrates the surface current distribution on the radiating patch which indicates that various slots and feedline position are responsible for resonant frequency at 14.32 GHz as well as for overall improvement in antenna performance characteristics.
Simulated surface current distribution at 14.32 GHz for the proposed antenna (a) on the ground plane and (b) on the radiating patch.

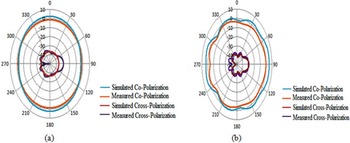
Figures 7(a) and 7(b) present the comparison of simulated and measured co and cross polarization for E and H planes at resonant frequency 14.32 GHz respectively. The cross polarization level obtained at the desired frequency is about −37 dB. The proposed antenna shows the close agreement between the simulated and measured results for the radiation pattern; however, the small variation in the pattern is due to the fabrication errors as well as other external reasons such as temperature. Depending upon various antenna performance characteristics the proposed antenna can be considered as a liquid sensor to analyze the quality of liquid samples.
Comparison of simulated and measured co and cross polarization at 14.32 GHz: (a) E-plane and (b) H-plane for the proposed antenna.

Proposed antenna as a liquid sensor
After verifying the performance characteristics of the proposed antenna, the fabricated design is deployed for the desired application which is to detect the adulteration in liquid samples. The ability of food products to store and dissipate electromagnetic energy is determined by material's dielectric properties. Therefore, the detection of adulteration in a solution is solely dependent upon the change in the permittivity value of the material which provides the variation in reflection coefficient and shift in resonant frequency.
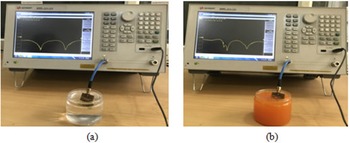
In this section, experimental validation of the proposed antenna-based sensor for detecting adulteration at different levels is carried out. In this work, we have opted for rake-shaped microstrip antenna sensor for detecting adulteration in water and juice by adding different adulterants to it. First step is to prepare a binary mixture of 50 g with different concentrations (20, 40, 60, and 80%) of adulterant. For instance, for 20% adulteration, salt and water is mixed together by gradually adding 10 g of salt to 40 g of water keeping the total volume 50 g and so on. After the dilution these samples are kept for about approximately 5 min to attain the equilibrium and to ensure that there are no air bubbles left. Second step is to immerse the sensor in the 50 g sample to measure reflection coefficient variation with respect to frequency range using the Agilent E5071C VNA as shown in Fig. 8. The sensor is dipped in the sample for about 2 min. Experimentally it has been found that this process becomes stable around 2 min after dipping; average of five readings are taken and a stable band is considered for adulterated sample from a large set of experiments that are observed up to 20 dipping. Similar steps are followed for analyzing different concentrations of adulteration in water and juice after a gap of 10 min. All the measurements are carried out at room temperature (25°C) and after each measurement the sensor is washed with normal water and wiped with dry tissue paper. Finally, all obtained results are observed and comparison graphs of the sample solution with different concentrations of adulterants are plotted.
Photograph of the experimental setup during measurement: (a) water and (b) juice of the proposed antenna as a sensor.

Sensitivity and dielectric permittivity analysis
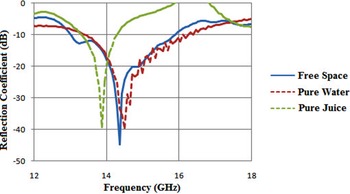
Different liquid samples (water and juice) have been investigated with varying different levels of contamination using the proposed antenna as a liquid sensor to indicate the applicability of recommended methodology. The liquid samples were differentiated using the sample's dielectric properties which can be determined through change in reflection coefficient and shift in resonant frequency. Figure 9 presents the variation of reflection coefficient as a function of frequency for pure water and pure juice in reference to the experimental results obtained with respect to the fabricated antenna in free space. Figure 9 depicts that the measured resonant frequency of pure water and juice sample is 14.54 and 13.86 GHz having reflection coefficient −40 and −39.4 dB, respectively, with respect to free-space sample considered as the reference sample having resonant frequency 14.32 GHz with −45 dB reflection coefficient. Furthermore, the sensitivity of pure water and juice sample is calculated which is defined as the change in resonant frequency for a unit shift in dielectric constant. The estimated value for sensitivity is 220 and 460 MHz for water and juice, respectively. On the other hand, the proposed antenna sensor shows a maximum sensitivity of 700 MHz. The adulteration detection in a solution is solely dependent upon the dielectric properties of the material; change in the permittivity value of the material provides variation in reflection coefficient and shift in resonant frequency. The measured dielectric permittivity of water and juice is 33.3 and 33.6 which is calculated mathematically using a second-order polynomial equation, with reference to Fig. 9 and is expressed as:

Variation in reflection coefficient (dB) in water and juice with respect to free space.

Table 2 shows the measured result for resonant frequency, dielectric permittivity, and sensitivity of material under test (MUT) i.e. water and juice.
Measured resonant frequency, dielectric permittivity and sensitivity of the MUT

Case 1: adulteration of water with salt, sugar, and glucose
The sensor has been first examined for adulteration in water using different concentrations of salt, sugar, and glucose which are considered as adulterants to be added in the pure sample (water). As the level of adulteration increases, free molecules in water decreases, hence the dielectric property of the material decreases and due to this reason load impedance increases and consequently reflection coefficient decreases.
For experimental purpose, salt, sugar, and glucose are added to water separately making 20, 40, 60, and 80% solutions, respectively.
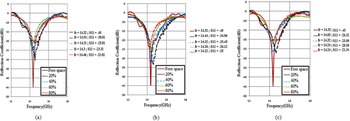
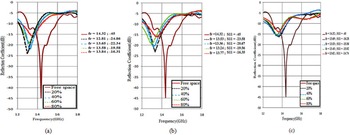
In Fig. 10(a) different concentrations of salt i.e. 20, 40, 60, and 80% in water shows the reflection coefficients −30.01, −25.01, −23.31, and −21.01 dB resonating at 14.54, 14.21, 14.3, and 14.46 GHz, respectively. Furthermore, Fig. 10(b) illustrates the variation in reflection coefficient −34.96, −33.45, −26.12, and −25 dB for 20, 40, 60, and 80% of sugar in water resonating at 14.44, 14.32, 14.26, and 14.22 GHz, respectively. Figure 10(c) illustrates the response for glucose concentration in water for 20, 40, 60, and 80% having reflection coefficient −26.32, −25.98, −23.56, and −21.34 dB resonating at 14.63, 14.32, 14.24, and 14.24 GHz, respectively. Figure 10 represents that all these three binary solutions i.e. salt–water, sugar–water, and glucose–water show high sensitivity for variations in reflection coefficient and resonant frequency, which indicates that as the level of adulterant increases in the pure sample (water) the dielectric properties of the material decreases which results in decrease of reflection coefficient and shift in resonant frequency. Furthermore, the reproducibility data and limit of detection (LOD) for various adulterants added to the pure sample are calculated and shown in Table 3 to check the accuracy and to estimate adulteration for the proposed antenna sensor.
Variation in reflection coefficient (dB) in water with different percentages of (a) salt, (b) sugar, and (c) glucose.

Reproducibility data and LOD for adulteration in water

Case 2: adulteration of juice with sugar, jaggery, and honey
A similar procedure is used for detecting adulteration in juice considering sugar, jaggery, and honey as adulterants in pure sample (juice). Figure 11 illustrates the estimation of adulteration with respect to reflection coefficient and shift in resonant frequency with percentage increase of sugar, jaggery, and honey in juice, considering free sample as a reference sample for adulteration detection having resonant frequency 14.32 GHz and reflection coefficient −45 dB. Figure 11(a) demonstrates that as the level of adulterant i.e. sugar increases in juice by 20, 40, 60, and 80% the reflection coefficient shows the variation of −24.86, −22.34, −19.58, and −16.31 dB having resonant frequency of 12.84, 13.65, 13.58, and 13.84 GHz, respectively. Furthermore, Fig. 11(b) illustrates the shift in resonant frequency and reflection coefficient with different percentages of jaggery in juice at 13.53, 13.36, 13.24, and 13.77 GHz having reflection coefficient −23.58, −20.67, −19.56, and −16.35 dB for 20, 40, 60, and 80% concentration of adulterant, respectively. Figure 11(c) shows the response of reflection coefficient and resonant frequency with different concentrations of honey in juice. For 20, 40, 60, and 80% of honey in juice, the reflection coefficients are −16.28, −15.56, −15.02, and −14.74 dB having resonant frequency 13.69, 13.53, 13.45, and 13.62 GHz, respectively. Thus, from the obtained results of resonant frequencies and reflection coefficients with respect to the free space in Fig. 11, it is concluded that as the level of adulteration increases in pure sample the dielectric constant of the material decreases which results in decrease of reflection coefficient and shift in resonant frequency. Furthermore, Table 4 illustrates the reproducibility data and LOD for various adulterants in pure juice sample.
Variation in reflection coefficient (dB) in juice with different percentages of (a) sugar, (b) jaggery, and (c) honey.

Reproducibility data and LOD for adulteration in juice

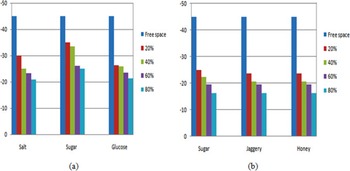
Figure 12 presents the bar graph to highlight the variation in reflection coefficient for water and juice samples adulterated with various adulterants at different levels of concentration. Furthermore, the proposed liquid sensor exhibits standard deviation less than the difference between unadulterated and adulterated values, giving resolution high enough to distinguish adulteration with an acceptable statistical accuracy, which further reduces the sensor size and penetration depth considerably.
Variation in reflection coefficient at 20, 40, 60, and 80% concentrations for (a) water with salt, sugar, and glucose and (b) juice with sugar, jaggery, and honey.

Results and discussion
The proposed rake-shaped microstrip antenna sensor for detecting adulteration is based on the methodology of food material's interacting with the electromagnetic field owing to shift in resonant frequency as a function of dielectric permittivity of the samples. The variability difference of the reflection coefficient at different levels of adulteration depends upon the permittivity of the material, which increases or decreases depending upon the type of adulterant and its concentration in the solution. The obtained results show good linearity among resonance frequency shift and reflection coefficient with respect to different adulterants at different levels of adulteration (20, 40, 60, and 80%). In aforementioned graphs it is clearly depicted that as the percentage of adulteration increases in the pure sample, the dielectric properties of the material decrease which results in decrease of reflection coefficient and shift in resonant frequency.
The proposed antenna sensor has a simple design and photolithography technique based on wet etching is opted for fabrication of the antenna-based sensor. Furthermore, the measured and simulated results demonstrate the good characteristic performance of the antenna sensor including accuracy, high sensitivity, Q-factor, gain, etc., which validates the proposed sensor as an effective tool to detect adulteration in liquid samples.
However, it is concluded from the experimental results that the proposed antenna sensor is capable of detecting different levels of adulteration but it cannot specify the type of adulterant present in the sample which is reported as a drawback of the proposed antenna sensor.
Table 5 illustrates a detailed comparison of proposed work with earlier reported works in terms of analytical performance.
Comparison of the proposed sensor with earlier reported work in terms of analytical performance

Conclusion
A novel rake-shaped sensor has been presented, fabricated, and experimentally assessed for detecting the contamination in liquid samples (water and juice) with various adulterants. The proposed sensor is fabricated on a low-cost FR4 substrate with relative permittivity 4.4 which gives satisfactory results in terms of antenna performance characteristics. The proposed sensor has high quality factor of 485 and shows a reasonable sensitivity of 700 MHz having an accuracy of 98% with improved spatial resolution and penetration depth owing to its wider bandwidth and higher frequency. Furthermore, the good agreement between simulated and measured results proves the proposed antenna sensor to be a sensible device for food assessment applications in liquid samples with respect to resonant frequency and reflection coefficient. For future work, more experiments are needed with different varieties of liquid material such as milk, oil, fuel, etc. and further with dry materials to upsurge the reliability of the device that can be considered as a good candidate for food industries.
Acknowledgements
The authors are highly grateful to TIET-VT Centre of Excellence for Emerging Materials (CEEMS) for their support in funding this project. We would also like to thank Mr. Hitendra, Ph.D. Scholar, Antenna Research Lab, ECED at TIET and Mr. Amandeep Singh, Lab Technician, Capstone Lab, ECED at TIET for their assistance in antenna measurements. We also thank Arianz India Pvt. Ltd. Mohali, Punjab, India for the smooth and timely fabrication of our proposed antenna.
Conflict of interest
There is no conflict of interest in this paper.
Ethical standards
On behalf of all co-authors, I, Nitika, declare that this article has not been published in or is not under consideration for publication elsewhere. All authors were actively involved in the work leading to the manuscript and will hold themselves jointly and individually responsible for its content.
 Nitika received her bachelor of technology in electronics and communication engineering from the Chandigarh Group of Colleges, Mohali, India in 2015 and her masters of engineering in wireless communication from T.I.E.T., Patiala, Punjab, India in 2017. Presently, she is pursuing her Ph.D. from T.I.E.T., Patiala. Her research interests emphasize on design and optimization of microstrip patch antennas using optimization algorithms such as differential evolution (DE) algorithm, genetic algorithm (GA), and particle swarm optimization (PSO) algorithm.
 Jaswinder Kaur received her bachelor of technology and master of technology in electronics and communication engineering from Punjab Technical University, Jalandhar, Punjab, India in 2005 and 2009, respectively. She received her Ph.D. degree from Thapar University, Patiala, Punjab, India in 2014. Presently, she is working as an assistant professor in the Department of Electronics and Communication Engineering, Thapar Institute of Engineering and Technology (T.I.E.T.), Patiala, Punjab, India. She has published several papers in various peer reviewed journals/conferences of national and international repute. Her research interests include the analysis and design of microstrip patch antennas for wireless communication, 5G MIMO antennas, CSRRs, flexible antennas, and antennas for biomedical applications.
 Rajesh Khanna received his BSc (Engg.) degree in electronics & communication in 1988 from Regional Engineering College, Kurukshetra, Haryana, India, and his M.E. degree in 1998 from the Indian Institute of Sciences, Bangalore, India. Presently, he is working as a professor and head of the Department of Electronics & Communication, Thapar University, Patiala, Punjab, India. He has published 80 papers in national and international journals/conferences. He has research projects worth Rs. 1.5 crores to his credit. His research interests include the analysis and design of antennas, wireless communication, multiple input multiple output (MIMO), and fractional Fourier transform-based wireless systems.