


1. Introduction
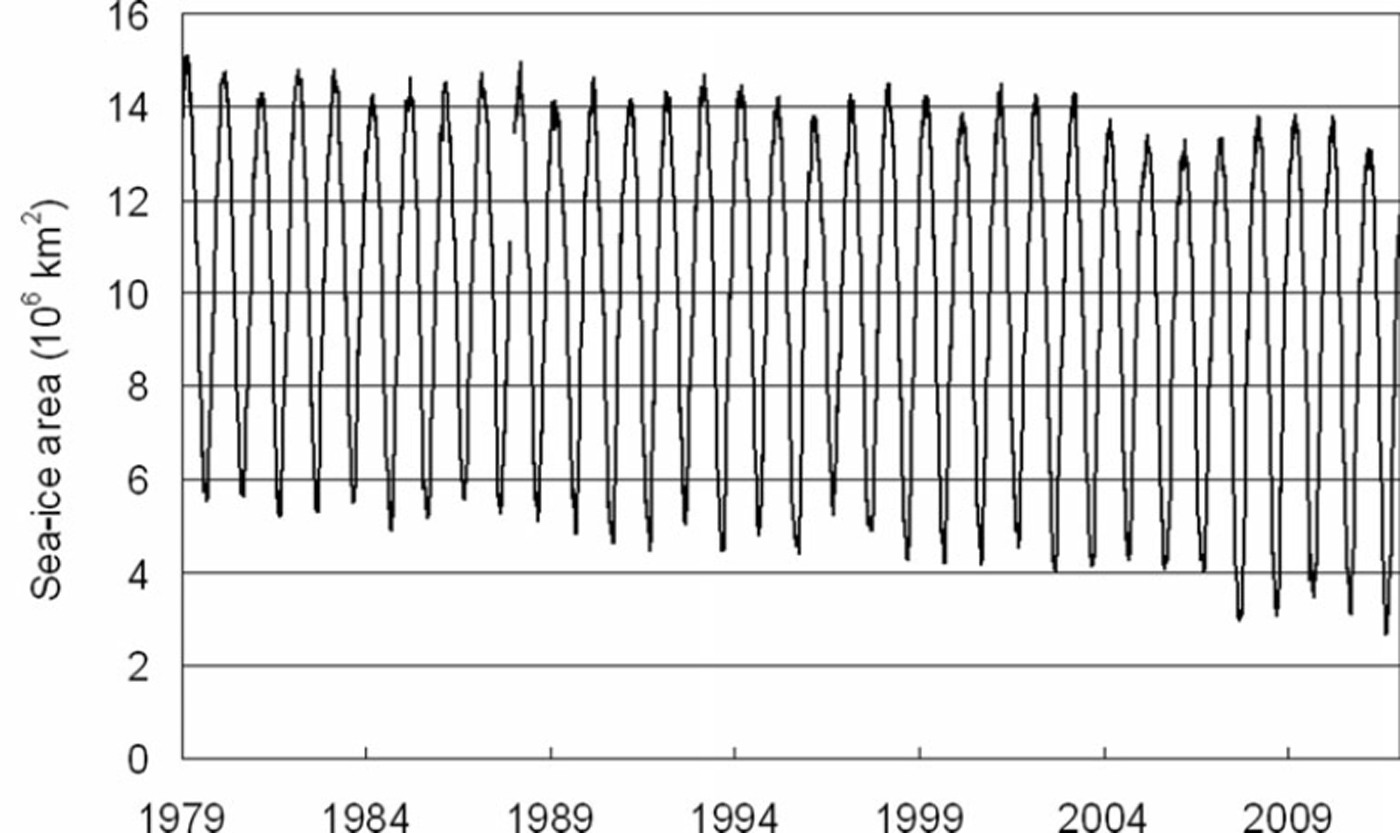
The amount of Arctic sea ice has decreased drastically in recent years. An extreme decrease took place during summer 2007 (Fig. 1), when sea-ice area plunged to its lowest level since satellite observations of sea ice began in the 1970s (Reference Zhang, Lindsay, Steele and SchweigerZhang and others, 2008). The decrease continued after 2007. In 2008, sea ice was thinner overall than it was in 2007 (Reference Kwok, Cunningham, Wensnahan, Rigor, Zwally and YiKwok and others, 2009). Sea-ice melt is occurring earlier, with open water areas developing sooner and becoming more extensive throughout the summer (Reference Markus, Stroeve and MillerMarkus and others, 2009). The acceleration of the decreasing trends of sea-ice extent and area applies to the entire Arctic Ocean. The decrease in ice coverage has shifted from about 2.23.0% per decade from 1979 to 1996 to about 10.1–10.7% per decade in the last 10 years, according to satellite passive-microwave data using the Bootstrap algorithm (Reference Comiso, Parkinson, Gersten and StockComiso and others, 2008). Analysis using the NASA Team algorithm for the 28 years 1979–2006 yields an overall trend of –45 100 ± 4600 km2 a−1 (–3.7 ±0.4% per decade) in the yearly averages, with negative ice extent trends also occurring every season and every month (Reference Parkinson and CavalieriParkinson and Cavalieri, 2008). Analysis for the 32 years 1979–2010 shows slightly decreasing trends compared with analysis for the 28 years 1979–2006. There is an overall yearly trend of –51 500±4100km2a−1 (–4.1 ±0.3% per decade) in sea-ice extent for the Northern Hemisphere (Reference Cavalieri and ParkinsonCavalieri and Parkinson, 2012). For September, Reference Meier, Stroeve and FettererMeier and others (2007) indicated a significant –8.4 ± 1.5% per decade trend of sea-ice extent from 1979 through 2005.
Average sea-ice area in the Northern Hemisphere from 1978 to 2011.
The decrease in sea ice offers opportunities for transportation routes and oilfield development. The Arctic Ocean has two main sea routes: the Northern Sea Route (NSR) and the Northwest Passage (NWP). We investigated the availability of the NSR, which follows the Siberian coast, whereas the NWP follows the northern coast of North America. The extensive sea-ice decrease along the NSR will likely affect human activities, such as navigation in the Arctic. If open, the NSR would be just 60% of the length of the conventional route between the Far East and Europe (Reference Kitagawa, Izumiyama, Kamesaki, Yamaguchi and OnoKitagawa and others, 2000). Previous multi-model simulations have shown that the free passage season will be prolonged by 3–6 months by the end of the 21 st century, according to the A1B scenario of the Intergovernmental Panel on Climate Change (Reference Khon, Mokhov, Latif, Semenov and ParkKhon and others, 2010). In 2011, Arctic voyages were conducted by 34 vessels, and 82 000 tons of cargo were shipped to and from Asian countries such as China, Korea and Thailand (Reference Otsuka, Izumiyama, Shibata and FuruichiOtsuka and others, 2012).
We researched the sea-ice area of the NSR by sea area segments. Understanding which segments of the NSR severely restrict navigation is important. Our objective was to investigate local ice conditions in each segment.
2. Data and Methods
We used ice concentration data obtained from the Scanning Multi-channel Microwave Radiometer (SMMR) on the Nimbus-7 satellite and from the Special Sensor Microwave Imagers (SSM/I) on the US Defense Meteorological Satellite Program’s (DMSP) F8, F11 and F13 satellites. Because microwave data are not affected by clouds or darkness, the sensors collect data regardless of weather or time. Ice concentration data were obtained from the SMMR between 1980 and 1987 and from the SSM/I between 1988 and 2011. The spatial resolution of the SMMR and SSM/I sensors is 25 km × 25 km. Sea-ice concentration data were derived from the US National Snow and Ice Data Center (NSIDC) releases and were calculated by the NASA Team algorithm (Reference Cavalieri, Parkinson, Gloersen and ZwallyCavalieri and others, 1996). This is the approach typically used by national ice services to provide seasonal and annual outlooks for the state of sea ice within particular regions of responsibility. From validation studies, comparison between sea-ice information estimated from high-resolution imagery and ice concentration derived from passive microwave data using the NASA Team algorithm generally shows agreement within ∼±4% in total concentration (Reference Cavalieri and CarseyCavalieri, 1992). Other researchers have reported greater differences during the summer melt season, when the sea surface melts, and in regions covered by large areas of newly formed ice (Reference Steffen and SchweigerSteffen and Schweiger, 1991).
Figure 2 shows the seven NSR sea area segments that we studied for ice conditions (Reference Kitagawa, Izumiyama, Kamesaki, Yamaguchi and OnoKitagawa and others, 2000). We calculated sea-ice areas in each of the seven sea area segments. The sea-ice area values represent the integrated sum of the area covered by sea ice having an ice concentration of >15%. The seven sea areas, covering the NSR from the Atlantic to the Pacific Ocean (except the Barents Sea), were the southwestern Kara Sea, northeastern Kara Sea, western Laptev Sea, eastern Laptev Sea, western East Siberian Sea, eastern East Siberian Sea and southwestern Chukchi Sea.
Map of the sea area segments: A. southwestern Kara Sea; B. northeastern Kara Sea; C. western Laptev Sea; D. eastern Laptev Sea; E. western East Siberian Sea; F. eastern East Siberian Sea; and G. southwestern Chukchi Sea. The dark gray area is the region around Severnaya Zemlya.

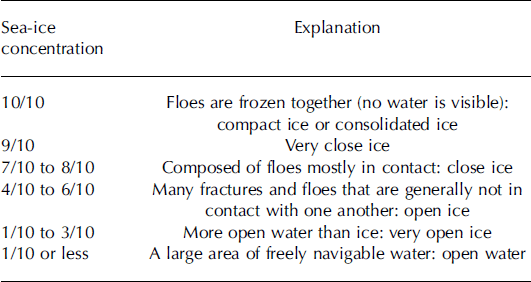
We analyzed sea-ice coverage for each area of Figure 2. We defined sea-ice coverage as the proportion of sea ice in each area. Briefly, sea-ice coverage indicates the average sea-ice concentration in each area. The World Meteorological Organization (WMO) has also expressed the relationship between sea-ice concentration and the state of the sea (Table 1; WMO, 1970). We defined the relationship between sea-ice coverage and navigation difficulty as follows: 70–100% coverage indicates very severe difficulty, 30–70% coverage indicates severe difficulty, and <30% coverage indicates easy navigation.
Stage of sea-ice concentration and state of the sea
3. Results
3.1. Ice-area trends in the summer
Table 2 shows the changes in Arctic sea-ice area in August for each sea. These changes can be expressed as a linear trend. The 1980–2011 data calculated in this paper are for sea-ice area. Long-term analysis from 1900 to 2000 is quoted from Reference Frolov, Gudkovich, Karklin, Kovalev and SmolyanitskyFrolov and others (2009), whose data were calculated by extent not area. Although detailed comparison of the data is difficult because of the difference between area and extent, we think that the trend can be grasped.
Changes in Arctic Sea ice area during the 20th century. S is area of sea (103km2), Δ L is sea-ice area change and a is standard deviation
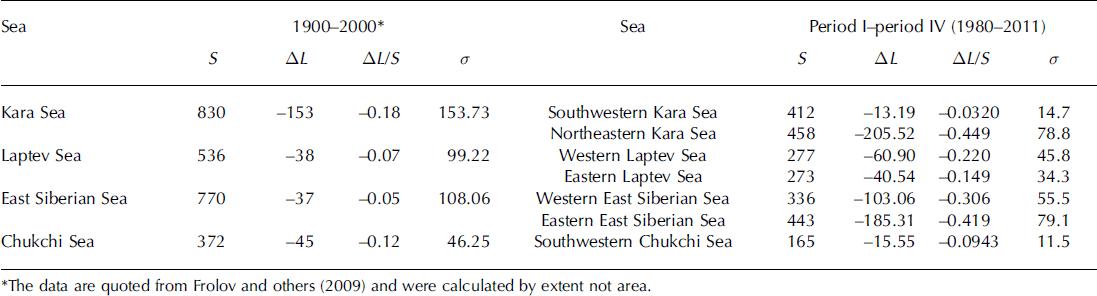
From 1980 to 2011, the largest changes described by linear trends are in the northeastern Kara Sea and eastern East Siberian Sea, which have lost >40% of their sea-ice area in the past 30 years, while the western East Siberian Sea has lost 30% or more. Comparing the 1900–2000 data with the 1980–2011 data shows the decrease in recent years has accelerated except in the southwestern Kara Sea and southwestern Chukchi Sea. During 1900–2000, these two sea areas lost proportionally more sea ice than the others. However, the opposite result occurred during 1980–2011. We assume that sea ice was already less in the southwestern Kara Sea and southwestern Chukchi Sea during the 1980s. On the other hand, a large amount of ice remained in other sea areas, and the decrease in sea ice in recent years appears remarkable.
3.2. Time-series segmentation
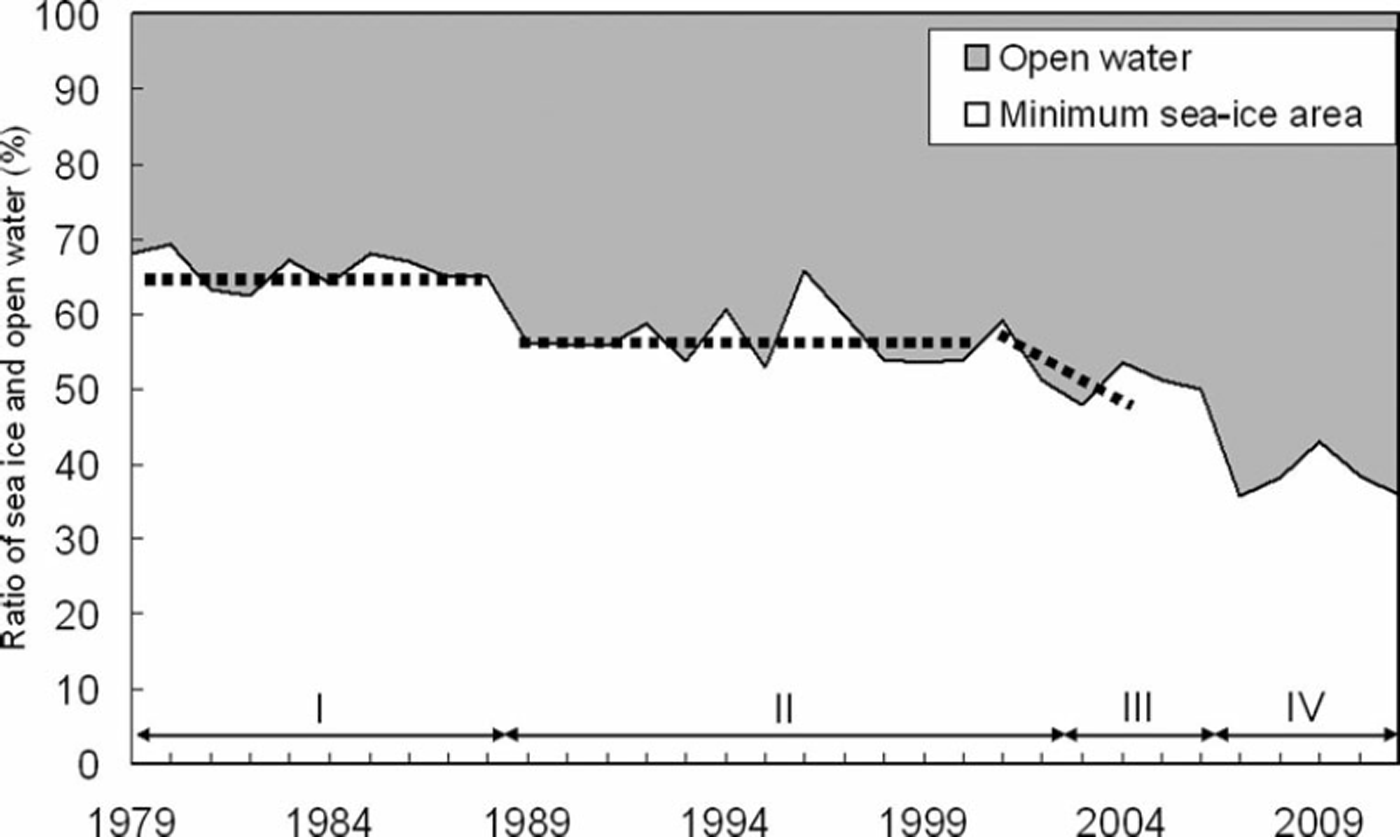
We divided the analysis into four periods based on sea-ice area changes. Figure 3 shows the ratios of sea-ice to open water areas in the Arctic Ocean at minimal sea-ice coverage. We define the Arctic Ocean as including the Beaufort, Chukchi, Laptev and Kara seas. In period I (1980–88) the sea-ice area was stable. The minimum sea-ice area decreased sharply in 1989. In period II (1989–2001) the minimum sea-ice coverage stabilized around 55%. In period III (2002–06) the sea-ice area began to decrease. Sea ice decreased drastically in 2007, during period IV (2007–11).
Minimum sea-ice area in the Arctic Ocean in periods I (1980–88), II (1989–2001), III (2002–06) and IV (2007–11).
3.3. Changes in sea-ice coverage
Reference OnoOno (1995) reported interannual changes in sea-ice extent along the NSR in spring to autumn (May–November) 1979–86 and showed that the potential for ice existence in the ice minimum season was high in two regions, 90–1108E and 160–1808 E in the East Siberian and Chukchi Seas, respectively. In our study areas, the region around Severnaya Zemlya between the western Laptev Sea and northeastern Kara Sea corresponds to the 90–1108 E region. The 160–1808 E region corresponds to the eastern East Siberian Sea.
In all seven sea areas, sea-ice coverage decreased sharply in period IV compared to coverage in period I. Figure 4 shows time curves of the sea-ice area in regions corresponding to those in Figure 2 and around Severnaya Zemlya (90–1108 E). In May, the sea-ice coverage differences between periods I and IV in the southwestern Kara Sea, northeastern Kara Sea, the region around Severnaya Zemlya and in the western Laptev Sea were 8% or more. A notable decrease in sea-ice coverage in these areas occurred in May. In contrast, changes in coverage in May in the eastern Laptev Sea, western East Siberian Sea, eastern East Siberian Sea and southwestern Chukchi Sea were small. In the southwestern Kara Sea and southwestern Chukchi Sea, where sea ice almost disappeared during the period I melt season, the melt period began earlier and the freezing period was delayed. Sea-ice coverage decreased in all the study regions. Minimum coverage decreased sharply in the northeastern Kara Sea and western East Siberian Sea. In period IV, coverage in all seven regions was 15% or less, and sea ice almost disappeared at its annual minimum.
Time curves of sea-ice coverage for each region and each period. The letters (A–G) correspond to those in Figure 2. Dates are month/day. In some areas, sea-ice coverage is constant at the minimum owing to the coastal mask correction.

Sea-ice coverage in the eastern East Siberian Sea decreased drastically. The eastern East Siberian Sea and the area around Severnaya Zemlya had extensive sea-ice coverage in period I, as also found by Reference OnoOno (1995), but low coverage in period III. In the region around Severnaya Zemlya, coverage decreased between period I and periods II and III, but remained at 28% or more. However, in period IV, coverage fell below 10%. While May sea-ice coverage in the eastern East Siberian Sea showed similar values in all periods, coverage around Severnaya Zemlya differed by 8% on 1 May between periods I and IV. From September to November, coverage recovered to 80% or more in both sea areas.
3.4. Sea-ice coverage anomalies
Figure 5 shows sea-ice coverage anomalies with reference to period I in the eastern East Siberian Sea and around Severnaya Zemlya. Coverage in periods II and III decreased greatly from that in period I in the eastern East Siberian Sea, changing at least 30% for each period. Anomalies for period IV changed ∼20% per month. Around Severnaya Zemlya, the anomaly maximized at 50%, with 10% changes per month from mid-July to October. The anomaly for period IV was highest during the minimum sea-ice season for both areas.
Sea-ice coverage anomaly in period I for (a) the region around Severnaya Zemlya (90–1108E) and (b) the eastern East Siberian Sea. Dates are month/day.

3.5. Analysis of local sea area conditions
We analyzed local sea-ice coverage in detail in the area around Severnaya Zemlya. We divided the Severnaya Zemlya sector into two subsectors at 1008 E. Figure 6 shows local coverage for the northeastern Kara Sea side and western Laptev Sea side around Severnaya Zemlya. Hereafter, we describe the northeastern Kara Sea side as ‘around Severnaya Zemlya A’ and the western Laptev Sea side as ‘around Severnaya Zemlya B’.
Time curves of detailed sea-ice coverage in Severnaya Zemlya: (a) the northeastern Kara Sea side and (b) the western Laptev Sea side. Dates are month/day.

Sea-ice coverage around Severnaya Zemlya A decreased to ∼30% in period III, then disappeared in period IV at minimum ice coverage. On the other hand, even at its lowest, coverage around Severnaya Zemlya B was 25%. Thus, the key area for navigating the NSR is the western Laptev Sea area around Severnaya Zemlya. On 1 May in period IV, coverage had decreased by 15% or more from the period I level in both regions.
3.6. Standard deviation of sea-ice coverage
Sea-ice coverage recovered greatly during October. Figure 7 shows the standard deviation for October sea-ice coverage in the eastern East Siberian Sea and around Severnaya Zemlya. In both regions, the average sea-ice area decreased in period IV compared with the previous periods, whereas the standard deviation increased. This result is important to consider for ship navigation, such as for predicting sea-ice conditions or establishing ship sailing plans. Sailing plans must recognize that sea-ice changes in October can differ vastly from year to year in areas such as the eastern East Siberian Sea and the region around Severnaya Zemlya.
Mean and standard deviation of sea-ice coverage from October 1980 to 2011 in (a) the East Siberian Sea and (b) the area around Severnaya Zemlya.

3.7. Interannual variability of sea-ice coverage
Sea-ice coverage in the NSR decreased greatly for the seven months. Figure 8 shows interannual changes in each sea-ice area in the NSR from May to November 1980–2011, based in part on Reference OnoOno (1995). We divided the NSR into 108 longitude sectors. On the left in Figure 8 is the southwestern Kara Sea, located to the west. On the right is the southwestern Chukchi Sea, located to the east. The dark gray areas indicate regions where sea-ice coverage is >70%, the light gray areas indicate 30–70% coverage and the white areas indicate <30% coverage.
Interannual variability of sea-ice coverage in seven months (May–November) from 1980 to 2010. Sea-ice coverage along the NSR coast is illustrated as follows: dark gray areas: >70%; light gray areas: 30–70%; and white areas, <30%. The southwestern Kara Sea is on the left (west) and the southwestern Chukchi Sea is on the right (east).

From 1980 to 2010, the light gray and dark gray regions decrease. During the 1980s, the potential for ice existence in the minimum ice season was high in two regions, 90–110˚ E and 160–180˚ E, as also reported by Reference OnoOno (1995). Additionally, two other regions, just west of 908 E in the northeastern Kara Sea and just east of 1108 E in the western Laptev Sea, had high potential for sea-ice coverage.
During the 1990s, sea-ice coverage was hardly ever >70% in August and September in any of the sea areas. During July, it was often <70% and sea ice often disappeared in the western East Siberian and eastern Laptev Seas. Coverage in the eastern East Siberian Sea hardly remained >70% in the melt season. In the southwestern Chukchi and southwestern Kara Seas, coverage was <30% in August and September in most of the 30 years.
After 2002, coverage was low, particularly in the eastern East Siberian Sea. During the melt season, sea ice in this region practically disappeared. After 2005, August–September sea-ice coverage was always <70% in all the sea areas. In addition, coverage in the sea-ice areas east of the western Laptev Sea, including the eastern Laptev Sea, western East Siberian Sea, eastern East Siberian Sea and southwestern Chukchi Sea, was almost as low as 20%. Sea ice often disappeared on the NSR, except around Severnaya Zemlya in September.
Low sea-ice coverage during August and September continued after 2002. If low ice coverage continues into the future, ships may be able to establish regular operations during the melt season. A stable, long navigable period would benefit commerce and travel.
4. Discussion
4.1. Change in ice type on the NSR
We define ice that survives the summer without melting as multi-year (MY) ice. Ridging/rafting can thicken first-year (FY) ice considerably. Also, FY ice in a very cold region may thermodynamically grow thicker than initially thin MY ice in relatively warmer conditions. However, MY ice is thicker than FY ice. The degree of navigational difficulty and the probability of damage to ships are higher for MY ice than for FY ice. Reference Kubat, Timco, Loeset, Bonnemaire and BjerkasKubat and Timco (2003) reported that the vast majority of damage events involve MY ice in the ice regime. To reduce the risk of structural damage, vessel class is defined in terms of various ice conditions, including the ice type, for both transit and icebreaking ships (ASPPR, 1989; Reference Timco and KubatTimco and Kubat 2009).
The Arctic and Antarctic Research Institute (AARI), Russia, releases ice chart data for the Siberian coast on its website (http://www.aari.nw.ru/clgmi/sea_charts/sea_charts_en.html) and on the NSIDC website (ftp://sidads.colorado. edu/pub/DATASETS/NOAA/G02176/). The ice charts include a variety of data, including ice concentration by ice type, information on the stage of ice development, and ice form. The charts are usually constructed from satellite and airborne reconnaissance data. In addition, observations from other sources such as polar meteorological stations and en route ships are used. The NSIDC website archives Arctic charts from 1933 through 2006, and AARI holds charts from 1997 through 2008. Ice type data, however, are present only for the winter (October–May) in both sets of charts. To research sea-ice change in recent years, we analyzed only sea-ice charts obtained from the AARI website.
Figure 9 shows the ice concentration percentages for each ice type in the seven sea areas. The southwestern Kara Sea had no MY ice during the study period. In the southwestern Chukchi Sea, MY ice existed before 2002 but disappeared after 2003. The region around Severnaya Zemlya (northeastern Kara Sea and western Laptev Sea) and the eastern East Siberian Sea had high coverage during periods I and II, as mentioned above. MY ice was widely distributed in the eastern East Siberian Sea in the 1990s. The proportion of MY ice decreased drastically from the winter of 2002, and only a small amount of MY ice existed during the winters of 2003–06. MY ice disappeared from this area after 2007. Sea-ice coverage sharply decreased in period III, as mentioned in Section 3. The timing of the drastic decrease in MY ice and period III almost correspond. It is assumed that the drastic decrease in summer coverage in period III occurred because of the decrease in MYice in 2002. The MY ice in this region has not recovered since disappearing. It is possible that the cause of the disappearance of sea ice in the East Siberian Sea after 2007 can be traced to 2002. By contrast, in the region around Severnaya Zemlya, the proportion of MY ice displayed cyclic ups and downs from 1997 to 2008.
Variability of sea-ice type in the winter season (October–May) from 1997 to 2008. The colors represent the following sea-ice types: orange: multi-year ice; yellow-green: first-year ice; cerulean blue: young ice; aqua blue: fast ice; and blue: open water.

Wind also plays an important role in the distribution of ice cover and ice thickness. Wind is strongly related to the recent sea-ice decrease on the Siberian coast. Reference Thorndike and ColonyThorndike and Colony (1982) reported that ice typically moves parallel to SLP isobars due to the wind. During summer 2002, anomalous warm southerly winds in spring advect ice poleward from the Siberian coast (Reference SerrezeSerreze and others, 2003). In 2007, the NSR did not open up because winds pushed ice into the region around Severnaya Zemlya. However, during summer 2007 a large open-water region expanded north of Alaska and eastern Siberia (in the Beaufort, Chukchi and East Siberian seas) and reduced ice concentrations. The southerly direction of the wind in the Beaufort and Chukchi Seas region during summer is an important factor in the retreat of Arctic sea-ice coverage during summer 2007 (Reference Comiso, Parkinson, Gersten and StockComiso and others, 2008), which further strengthens the ice motion and transpolar drift (Reference Zhang, Lindsay, Steele and SchweigerZhang and others, 2008). These influences by winds are emphasized by Reference KwokKwok (2008). The winds increase the transpolar sea-ice drift, producing considerable changes in ice thickness due to ice advection almost everywhere (Reference Zhang, Lindsay, Steele and SchweigerZhang and others, 2008). Thus, it is possible that wind causes the persistence of various types of sea ice in the region around Severnaya Zemlya to vary unevenly each year. We also assume that a cause of the dramatic sea-ice retreat on the NSR in recent years is the synergy effect of a decrease in MY ice and the wind effect.
Thus, the persistence of sea ice by ice type varies according to region. If high ice coverage conditions consist of thin ice, such as FY ice or young ice (YI), we can expect further navigation possibilities, and if low ice coverage conditions exist, the area in which icebreakers are necessary decreases. Additionally, we assume that the state of sea ice along the Siberian coast has changed so that ice could easily be moved by wind.
4.2. Navigation results in 2011
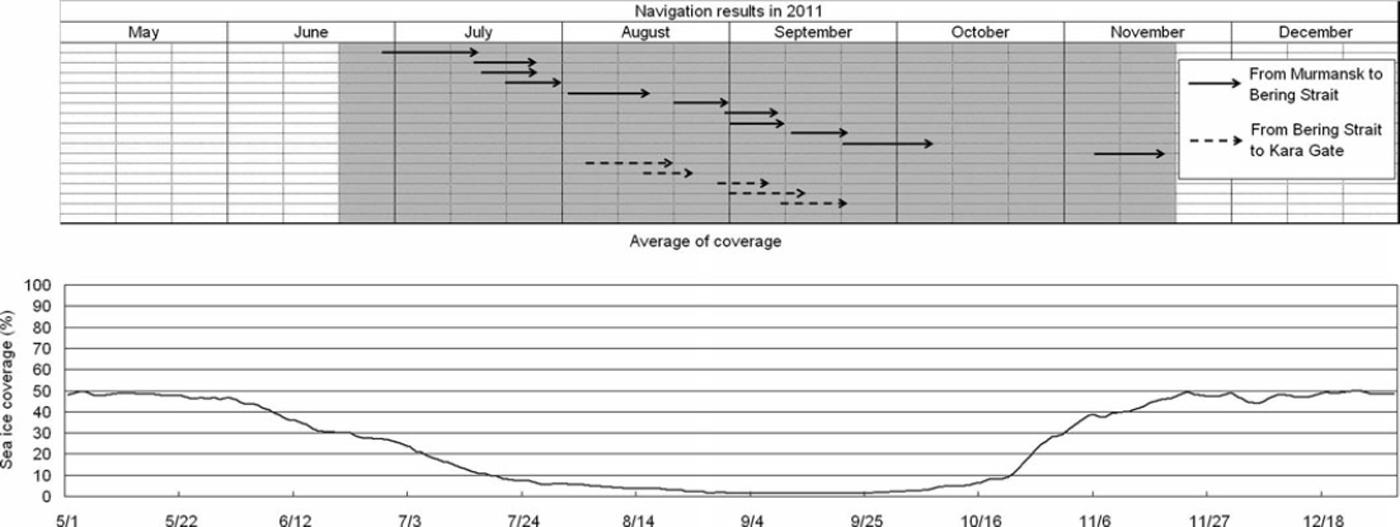
In 2011, there were more than 30 Arctic voyages along the NSR. Figure 10 shows the relationship between navigation in 2011 and average sea-ice coverage in the seven sea areas. Navigation on the NSR started in late June and the latest voyage was in November. For the November navigation, sea-ice coverage along the Siberian coast was >45%. In 2011, the period of <45% coverage started at the beginning of June and continued until mid-November. Hence, in light of the results showing that MY ice and ice coverage have decreased, we assume that a long navigation season on the NSR is possible.
Relationship between navigation in 2011 and average sea-ice coverage in the seven sea areas. OW: open water; YI: young ice; FY: first-year ice; MY: multi-year ice; FI: fast ice.
5. Summary
We have analyzed sea-ice coverage in seven sea areas along the NSR and researched the sea-ice areas using ice concentration information. The study focused on four periods extending from 1980 to 2011 and analyzed ice coverage by region and period.
Sea-ice area showed a decreasing trend in period IV (2007–11). During this period, sea ice decreased more than in the previous periods in the eastern East Siberian Sea and around Severnaya Zemlya. Ice coverage was severe in the eastern East Siberian Sea and around Severnaya Zemlya in period I (1980–88) but decreased greatly in the eastern East Siberian Sea during period III (2002–06). However, a high ice concentration remained around Severnaya Zemlya. In period IV, sea-ice coverage around Severnaya Zemlya was low but remained at 25% on the western Laptev Sea side of Severnaya Zemlya. Thus, the western Laptev Sea side of Severnaya Zemlya is a critical area for navigation. Although average sea-ice coverage decreased, the standard deviation increased, compared with previous periods, in areas such as the eastern East Siberian Sea and around Severnaya Zemlya. Thus, ship navigation and ice coverage prediction remain problematic.
NSR sea-ice coverage has decreased sharply in the seven months May–November during recent years. After 2002, coverage was low, particularly in the eastern East Siberian Sea. During the melt season, sea ice disappeared extensively in this area. After 2005, summer sea ice disappeared in the area east of 908 E, including the Chukchi Sea, eastern East Siberian Sea, western East Siberian Sea and eastern Laptev Sea. Sea ice in these sectors of the NSR often disappeared, except around Severnaya Zemlya.
The proportion of MY ice decreased drastically from the winter of 2002, and only a small amount of MY ice existed during the winters of 2003–06. MY ice has been absent from the eastern East Siberian Sea since 2007. On the other hand, in the region around Severnaya Zemlya, the proportion of MY ice displayed cyclic ups and downs from 1997 to 2008. Thus, the persistence of the various types of sea ice varies according to region. Additionally, the persistence (distribution) of various types of sea ice has been uneven in the region around Severnaya Zemlya each year.
The age of the ice pack is also important, with MY ice tending to be thicker than FY ice and YI. If a high ice coverage area is composed of thin ice, we can expect further benefits for navigation. On the other hand, navigation may be dangerous even in a low-concentration area, as ships can be damaged by thick ice flows. However, if the area of low ice coverage increases, the range over which icebreakers will be necessary will decrease. Furthermore, if the low ice coverage trend continues, regular ship navigation may be possible during the melt season. A stable, long navigable period would be highly beneficial for ship transport.
Acknowledgements
We are grateful to NSIDC and AARI for providing the sea-ice data. We thank the anonymous reviewers for helpful suggestions and comments. This study was supported by the GRENE-Arctic project.



