Introduction
Although movement variability is a complex construct, it is often viewed as an indicator of motor learning, with increased consistency correlated with mature speech motor behavior (Goffman & Smith, Reference Goffman and Smith1999; Maner, Smith & Grayson, Reference Maner, Smith and Grayson2000; Smith & Goffman, Reference Smith and Goffman1998; Smith & Zelaznik, Reference Smith and Zelaznik2004). Several studies have looked at movement invariance to understand speech motor control mechanisms (e.g., Ackermann, Hertrich & Scharf, Reference Ackermann, Hertrich and Scharf1995; Smith & Goffman, Reference Smith and Goffman1998; Smith, Goffman, Zelaznik, Ying & McGillem, Reference Smith, Goffman, Zelaznik, Ying and McGillem1995). Some investigators have used single time point measures in the speech kinematic output (Ackermann et al., Reference Ackermann, Hertrich and Scharf1995; Zimmermann, Reference Zimmermann1980), whereas others have incorporated the entire movement trajectory (Adams, Weismer & Kent, Reference Adams, Weismer and Kent1993; Ostry, Cooke & Munhall, Reference Ostry, Cooke and Munhall1987) to characterize spatial and temporal aspects of variability.
Speech movement variability is defined as how much spatiotemporal variation a set of movement trajectories show on repeated performance of a task (Ackermann et al., Reference Ackermann, Hertrich and Scharf1995; Adams et al., Reference Adams, Weismer and Kent1993; Ostry et al., Reference Ostry, Cooke and Munhall1987; Smith & Goffman, Reference Smith and Goffman1998; Smith, Johnson, McGillem & Goffman, Reference Smith, Johnson, McGillem and Goffman2000; Zimmermann, Reference Zimmermann1980). This kind of variability measure, where the entire trajectory is considered, acknowledges the influence of multiple linguistic parameters (e.g., phonological, prosodic, syntactic, morphological, and semantic), as well as cognitive and emotional influences on the utterance (Smith et al., Reference Smith, Johnson, McGillem and Goffman2000). This analysis has been applied to explore the physiological mechanisms of different age groups (e.g., Goffman & Smith, Reference Goffman and Smith1999; Walsh & Smith, Reference Walsh and Smith2002), as well as disordered populations such as individuals who stutter (Kleinow & Smith, Reference Kleinow and Smith2000) and children with specific language impairment (SLI) (Goffman, Reference Goffman1999, Reference Goffman2004). Recently, similar analyses have been employed to explore the production consistency of second language (L2) learners by Chakraborty, Goffman and Smith (Reference Chakraborty, Goffman and Smith2004).
In the present study, variability in movement was examined to understand motor control mechanisms in the bilingual population. The idea is to apply this type of variability measure at the word level to examine spatiotemporal consistency in both low and high proficiency L2 speakers. The aim of the variability analysis will be to investigate whether variability changes as a function of L2 proficiency in the production of prosodic alternations (i.e., iambic and trochaic words). Assuming that variability is an index of proficiency, if a person is more proficient in the L2 stress pattern, he or she will be more consistent across repeated productions of that prosodic form. Shifts in variability as a function of L2 proficiency would serve as evidence of a proficiency-variability relationship in the organization of different prosodic forms.
The interpretation of movement variability must be carefully considered. For example, the processes underlying increased variability in adult bilingual speakers should not always be interpreted as equivalent to those accounting for increased variability in children. In children, variability is often viewed as an index of maturation (Smith & Goffman, Reference Smith and Goffman1998; Smith & Zelaznik, Reference Smith and Zelaznik2004). A more variable system is considered both less mature and more flexible. For example, developmental studies reveal that movement consistency changes as a function of age, with younger children showing more variability than older children who in turn are more variable than young adults across a range of speech production tasks (Goffman & Malin, Reference Goffman and Malin1999; Goffman, Heisler & Chakraborty, Reference Goffman, Heisler and Chakraborty2006; Smith & Zelaznik, Reference Smith and Zelaznik2004; Walsh & Smith, Reference Walsh and Smith2002). A similar analysis may apply to adult bilingual speakers who acquired L2 late versus early. That is, increased variability may serve as an index of increased flexibility or less maturity. However, to date, there have been limited attempts to describe how movement consistency interacts with L2 proficiency when bilinguals attempt to produce stress properties that are specific to an L1 versus an L2.
Variability as an index of language experience
Movement variability measures have seldom been applied to research in bilingualism. Presently, to my knowledge, there is only one kinematic study (Chakraborty, Goffman & Smith, Reference Chakraborty, Goffman and Smith2008) that has investigated how movements for speech are organized in a system where L1 and L2 are interacting. Somewhat surprisingly, based on the production of three simple English sentences by 21 Bengali–English bilingual speakers, Chakraborty et al. (Reference Chakraborty, Goffman and Smith2008) reported that, in most cases, spatiotemporal variability of lip aperture did not differ when the earlier exposed and highly proficient bilinguals were compared with the later exposed and less proficient bilinguals. One possibility is that, in adults, the speech motor system is relatively fixed and inflexible. However, a second interpretation is that, for adult speakers, simple L2 sentences generally do not perturb either the movement control mechanism or the language system even when L1 accent is perceptually prominent. The authors speculated that two groups of bilinguals with varying degrees of L2 experience might appear similar in a variability measure unless the target task requires relatively complex linguistic and cognitive processing or, perhaps, interference between L1 and L2. In fact, variability differences across groups were seen only in one sentence condition that included non-native segments.
Sensitivity of variability to linguistic parameters and cognitive demands
Movement variability is also influenced by specific linguistic factors such as sentence length, syntactic complexity (Maner et al., Reference Maner, Smith and Grayson2000; Sadagopan & Smith, Reference Sadagopan and Smith2004), and prosodic structure (Goffman et al., Reference Goffman, Heisler and Chakraborty2006; Goffman & Malin, Reference Goffman and Malin1999), as well as by concurrent linguistic or cognitive demands (Dromey & Benson, Reference Dromey and Benson2003). For example, Maner et al. (Reference Maner, Smith and Grayson2000) examined articulatory movement stability when utterances were varied in length and complexity. Five-year-old children and young adults repeated a six-syllable phrase in three different conditions, including in isolation, and embedded in longer sentences of low and high syntactic complexity. In general, for both children and adults, increases in sentence length and syntactic complexity led to increased spatiotemporal variability.
In the prosodic domain, differential effects of prosodic templates on movement variability have been observed. For example, monolingual English-speaking children showed higher spatiotemporal variability in the production of trochaic (i.e., strong–weak) than iambic (i.e., weak–strong) words (Goffman et al., Reference Goffman, Heisler and Chakraborty2006; Goffman & Malin, Reference Goffman and Malin1999). Surprisingly, even though in English the trochaic pattern is highly frequent, especially in bisyllabic nouns, spatiotemporal variability was lower for iambic words. The authors interpreted that spatiotemporal variability decreased for the less frequent iambic words because of increased resource allocation requirements.
In addition, investigating the influence of cognitive demands, Dromey and Benson (Reference Dromey and Benson2003) observed an increase in lower lip variability when participants were asked to repeat a reference sentence concurrently with a linguistic or cognitive distracter task. The last word of the utterance varied based on the distracter task. For example, in the cognitive distracter task, participants were instructed to count backwards from 100 by sevens and to produce a reference sentence with that distracter number in the final position. Spatiotemporal variability increased in this task. Overall, these results demonstrated that spatiotemporal variability is sensitive not only to language experience, but also to specific dimensions of language and to cognitive linguistic demands.
The present study
This study primarily explores the relationship between oral L2 proficiency and speech movement variability based on productions of real and novel words by adult Bengali–English bilinguals in L2 (in this experiment, English) as well as in L1 (in this experiment, Bengali). This issue is addressed through Experiment 1. Bilingual participants from Bengali L1 background have been chosen for this study because Bengali differs from English in its lexical stress assignment rules. Interestingly, inappropriate assignment of stress by the non-native speakers is considered one of the primary contributors in the perception of foreign accent (Major, Reference Major2001). In Bengali, the first syllable must be stressed, a rule that is not amenable to change (Chatterji, Reference Chatterji1921; Hayes & Lahiri, Reference Hayes and Lahiri1991; Klaiman, Reference Klaiman and Comrie1987). In contrast, lexical stress in English can be movable and is sensitive to the grammatical class of the target word. For example, in words like present and record, if lexical stress shifts from the first syllable to the second, then the grammatical class changes from noun to verb. Based on Francis and Kučera's (Reference Francis and Kučera1982) word frequency norms, Sereno (Reference Sereno1986) reported that 76% of the bisyllabic nouns carry stress on the initial syllable (strong–weak, trochaic pattern) and 34% of the verbs carry stress on the initial syllable. Overall, in bisyllabic nouns the trochaic (strong–weak) stress pattern predominates.
Thus, bilingual speakers who are more proficient in English and who had an early exposure to such movable stress pattern of English must have had an extended period of articulatory practice with both trochaic and iambic stress pattern. In contrast, Bengali–English bilinguals with less proficiency in English and with late exposure to English stress pattern have less articulatory familiarity with English stress pattern. Production of words with iambic stress pattern, which is the less common pattern in English and not permissible in Bengali, might become difficult especially for bilinguals with late exposure and low proficiency in L2. In such a situation, production of words that require lexical stress pattern exclusively native to English (i.e., iambic pattern) but non-native to Bengali might thereby influence the overall speech movement variability due to Bengali speakers’ relative unfamiliarity with the motor control pattern associated with the iambic stress production.
In addition, some earlier studies related to bilingualism have reported influence of linguistic interference or an L1–L2 interaction on some physiological parameters (Guion, Flege, Liu & Yeni-Komshian, Reference Guion, Flege, Liu and Yeni-Komshian2000a; Weber-Fox & Neville, Reference Weber-Fox and Neville1996). It was reported that due to relative predominance of one language over another, the dominant language interferes during the production of a non-dominant language and to suppress such interference, speakers probably use increased neural resources. A consequence of increased resource allocation has been reported earlier in studies where production proficiency was indexed by processing rate (Weber-Fox & Neville, Reference Weber-Fox and Neville1996) and sentence duration (Guion et al., Reference Guion, Flege, Liu and Yeni-Komshian2000a). Similarly, in this study it is hypothesized that the nature of bilingual speakers’ speech movement control mechanism will be affected by aspects of L1 and L2 interaction.
A secondary objective of this project was to examine how native speakers of American English judged the same productions obtained from the highly proficient and the less proficient L2 speakers with reference to perceived degree of foreign accent. This secondary objective is addressed through Experiment 2.
The hypotheses of this study are:
1. Both high and low L2 proficiency groups are expected to be similar in movement variability in the production of trochaic words, since these are frequently occurring in both English and Bengali.
2. However, as Bengali does not have an iambic prosodic category, the production of iambic words is expected to increase movement variability, especially for the less proficient group. That is, in the iambic context, the less proficient speakers of L2 will be more variable than the highly proficient speakers of L2.
3. Early exposed and more proficient speakers of L2 will be perceived as more native-like or less foreign accented than the late exposed and low proficient speakers of L2.
Experiment 1: Influence of language experience and proficiency on variability of movement
Method
Participants
There were 12 monolingual adult native English speakers (aged between 20 and 42 years) and 24 Bengali–English bilingual participants (aged between 20 and 45 years) recruited for this study. All the monolingual participants were speakers of standard American English. Bengali was the first language for all of the bilingual participants and they were all born and completed their undergraduate degree in the state of West Bengal, India, where Bengali is the primary language of communication. For all 24 bilinguals, both parents were native speakers of standard Bengali. English was the second language of all the bilingual participants. Participants were all recruited in the USA.
Bilingual participants were initially recruited on the basis of medium (i.e., language) of academic instruction at their primary (children aged between six and 11 years) and secondary school (children aged between 11 and 15 years) levels. Twelve Bengali–English speakers had completed their primary and secondary education in schools where an Indian dialect of English was the primary medium of instruction. The remaining 12 bilingual participants had their primary and secondary level academic training from Bengali medium schools (i.e., primary medium of instruction was Bengali) and English was taught only as a special course from the primary school level. Hence, this later group had received their academic exposure to Indian English only from the college level, where the medium of instruction was English. Therefore, if academic immersion in English could be considered as a potential variable, L2 participants had a history of early academic exposure to English (from the primary school level), and the remaining 12 participants had relatively late exposure to English (only after the college level). These two bilingual groups were classified as early exposed and late exposed groups. Both groups had comparable years of exposure to standard American English, ranging from one to 10 years.
It should also be mentioned that accents of Indian English vary greatly. Some Indians speak English with an accent very close to a Standard British English, while for some other speakers, their respective L1 exerts substantial amount of influence and they sound “vernacular” in their English accent. Moreover, in general, Indian English is reported to be a pitch-accent variety, whereas American English is known to be a stress-accent variety of English (see Pickering & Wiltshire, Reference Pickering and Wiltshire2000). Trochaic and iambic stress distinction is not reported in Indian English. Even though English is not the official language of India, English is very important in the legal, financial, educational and business systems in India. Especially, in metropolitan centers of India, both Indian English and the vernacular language are equally popular in the electronic and orthographic media. Thus both the bilingual groups included in this study were exposed to Indian English through the media very early. However, academically they received exposure to Indian English at different levels. In this study, academic immersion in English was used as a recruitment criterion to classify the two bilingual groups. Hence, based on the nature of L2 exposure, participants in this study might even differ from participants in conventional research studies related to bilingualism where usually age of arrival (AOA) in a predominantly L2-speaking community is used to classify participants. But in this project, age of academic immersion in English was a criterion used to classify the two proficiency groups.
All 24 bilingual participants were further objectively classified on the basis of their English language proficiency scores. To measure English language proficiency, all participants, including the L2 monolingual American English speakers, were given the Speaking Grammar Subtest of the Test of Adult Language-3 (TOAL-3; Hammill, Brown, Larsen & Wiederholt, Reference Hammill, Brown, Larsen and Weiderholt1994), which requires knowledge of English syntax. Since the TOAL-3 is not standardized on bilingual speakers, some previous studies had considered the raw scores from this test for objective classification of non-native adult speakers’ English proficiency (Chakraborty et al., Reference Chakraborty, Goffman and Smith2008; Guion, Reference Guion2005). Similarly, in this study, only the raw scores (with a maximum possible score of 30) were considered and reported. Speaking Grammar scores of the 12 monolingual native English speakers ranged from 18 to 27, M = 22.25, SD = 2.93. For the 12 participants early exposed to English, the scores ranged from 11 to 26, M = 19.92, SD = 4.89, and for the 12 late exposed participants, the scores ranged from 3 to 15, M = 8.33, SD = 3.98. A one-way ANOVA was performed. There was a significant group effect, F(2,33) = 41.36, p < .001, η2p = .71. Post-hoc testing (Tukey HSD) revealed that the early exposed and the monolingual groups were not significantly different in their Speaking Grammar Subtest scores. However, both groups had significantly higher Speaking Grammar scores than the late exposed bilinguals.
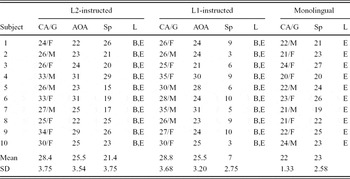
This study required identification of two experimental subgroups of non-native Bengali–English speakers who clearly differed in their oral L2 proficiency. Hence, based on their Speaking Grammar scores, all 24 non-native English speakers were further classified into two separate proficiency groups. Participants with the top 10 scores were selected to represent the “high” group (their Speaking Grammar scores ranged from 15 to 26, M = 21.4, SD = 3.75). Ten participants with the lowest scores formed the “low” proficiency group (their scores ranged from 3 to 10, M = 7, SD = 2.75). It was interesting to observe that all the 10 participants in the “high” proficiency group also had a history of early academic exposure to English in India and the “low” proficiency speakers had late academic exposure. Therefore, this proficiency classification coincided with bilingual participants’ age of academic exposure to English. The experimental group size was matched, by excluding two of the speakers from the monolingual group, both with Speaking Grammar scores of 19. Participants reported no history of speech, language, reading, or neurological problems and passed a hearing screening at 20 dB at .5 kHz, 1 kHz, 2 kHz, 4 kHz and 6 kHz using pure tone audiometry. Table 1 summarizes participants’ chronological age, gender, age of arrival in the USA, scores on Speaking Grammar Subtest, and the languages they speak.
Subject or participant number, chronological age (CA), gender (G; M = Male, F = Female), age (in years) of arrival in the USA (AOA), scores on Speaking (Sp) Grammar Subtest and languages spoken (L; B = Bengali, E = English), standard deviation (SD): two groups of bilinguals and monolinguals.

In the L2 literature, bilingual learners are usually classified as “early” and “late” if they were exposed to the L2 at an early age and at a later age, respectively. However, both non-native groups in this study were socially exposed to Indian English early, even though to varying degrees. Hence, different terms are used to classify the two bilingual groups. The group with early academic exposure (n = 10), who are also highly proficient in the L2, will be labeled here as “L2-instructed” group. The late exposed and low proficient group (n = 10) will be labeled here as “L1-instructed” group. Thus, 30 participants – the 10 L2-instructed, the 10 L1-instructed and the 10 monolinguals – formed our experimental groups. It should also be mentioned that, in a language history questionnaire, regardless of their age of academic exposure to English, all non-native participants had ranked Hindi, the national language of India, as their least preferred and comfortable language. Considering the multilingual environment in India, with Hindi as the most prevalent entertainment medium, ignoring its influence is difficult. However, the influence of Hindi became partially controlled in this experiment as the two bilingual groups of participants did not differ in their ranking of Hindi.
Procedure and stimuli
There were two experimental conditions, a real word and a novel word condition. Bilingual speakers produced the stimuli in each condition in an L1 (Bengali) and an L2 (English) context. Data from the bilingual participants were collected across two separate experimental sessions, each targeting only one language, that is, either English or Bengali, and the target language order was counterbalanced across the participants. In each experimental session, the real word condition always preceded the novel word condition, so as to avoid the inclusion of the instructed stress pattern that was part of the novel word learning task. For the monolingual group, the real and the novel word conditions were presented only in the English context. A native speaker of the target language conducted the session and interacted with the participants. For example, a native speaker of American English dialect interacted with the participant if the target language for a session was English. The context of the targeted language was established by showing the participants a three-minute video clip and asking them to perform a non-experimental reading and speaking task in the target language. In summary, during the first session, participants completed the real word and the novel word conditions of the experiment in one of the target languages, and during the second session, participants completed the real and the novel word conditions in the second language. The Speaking Grammar Subtest of the TOAL-3 and hearing screening were administered after the English-context session.
Condition 1: Real words
Participants produced four real words in this condition, bible, marble, baboon and buffet. The phonetic structure and semantic referents of these words are similar across English and Bengali. It is important to note that these words have been assimilated into the native inventory of the Bengali language as foreign words and modern Bengali speakers do not have an equivalent/corresponding lexical items for these semantic referents. In American English, bible and marble are typically produced with a strong followed by a weak syllable stress (i.e., trochaic rhythm) and baboon and buffet are produced with a weak followed by a strong syllable stress (i.e., iambic rhythm). The trochaic and iambic words were randomized. Participants produced all these target words embedded in language specific sentence frames. All of the sentence frames were comprised of five syllables. The sentence frame in the English context was, “I have said ____ before” and in the Bengali context, it was, “ami ____ bolechi” (which means “I have said ____”).
To elicit the target words embedded in language specific sentence frames, pictures and their corresponding written labels were shown individually on a computer monitor. To elicit participants’ natural stress pattern, throughout the real word condition participants were never offered any instruction or models of the target pronunciation, or lexical stress pattern. Before the experimental trials, the participants were oriented to the stimuli and had produced the target words in isolation. After the orientation, participants were told that, if they had said the name of the displayed picture before, they were required to say, for example (in the English language condition), “I have said ____ before”. Otherwise, when they saw some unfamiliar filler words, they were required to say “I have not said ____ before”. This elicitation routine helped participants produce words in a consistent sentence frame. Experimenters had used filler words to teach the sentence frame. Participants did not receive any feedback about the target words. However, when participants produced an incorrect sentence frame, the experimenter offered feedback with a filler word. The real word condition was complete when 15 fluent tokens of each stimulus word were produced.
Condition 2: Novel words
Since Bengali does not permit nouns with an iambic stress pattern (Chatterji, Reference Chatterji1921; Hayes & Lahiri, Reference Hayes and Lahiri1991), bilingual speakers’ attempts to produce novel words with iambic stress pattern might perturb their speech motor control system, particularly for the L1-instructed group. Moreover, there is a possibility that, due to L1–L2 transfer, Bengali participants, especially those with less experience in L2, might modify the iambic English words to trochees in order to be consistent with Bengali stress patterns. Hence, a learning component was included at the beginning of the novel word condition to ensure that the bilingual participants could produce an iambic sequence.
In this condition, participants produced four novel words. There were two different phonetic strings with each string having one strong–weak and one weak–strong sequence. In each language context, each novel word had a novel semantic referent. Thus, eight different semantic referents were used, four for each language context. For both English and Bengali, the trochaic novel words were [‘pʌpəp] and [‘bʌməp], and the iambic words were [pə’pʌp] and [bə’mʌp]. The segments and syllables of these words are permissible in both languages. In each language context, there was one trochaic block and one iambic block with each block containing two types of the same prosodic pattern and these blocks were counterbalanced. As in the real word condition, the language context was also counterbalanced across the participants and the same sentence frames “I have said ____ before” (in English) and “ami ____ bolechi” (in Bengali) were used.
In this condition, after orienting participants to a stimulus, a learning phase followed and then participants spontaneously produced the target stimulus embedded in a language specific sentence frame. Stimuli were blocked and each participant produced each type at least 15 times before moving to the next stimulus. In the orientation phase, each novel word was presented three times individually on a computer monitor and the participants saw the novel stimuli and heard the corresponding novel word. Next, the learning component was introduced where participants imitated the novel words and the experimenter offered immediate feedback (10 times for all participants) about the accuracy of the stress pattern to ensure that the participants were producing the appropriate stress pattern for the target novel words. After the learning phase, no feedback was offered and participants were instructed to produce the target word embedded in the language specific frame (e.g., “I have said [‘pʌpəp] before”) every time they saw the stimulus on the computer screen. The experimenter ensured the collection of 15 fluent productions for each novel word before proceeding to the next novel stimulus.
Data recording
Simultaneously, three types of data were collected: kinematic, video and acoustic. Kinematic data were collected using a Northern Digital Optotrak 3020 camera system (Waterloo, Ontario), with eight infra-red light emitting diodes (IREDS) (Smith et al., Reference Smith, Johnson, McGillem and Goffman2000). Using two-sided medical adhesive, three IREDS were attached to the forehead, upper lip, and lower lip at midline. One IRED was attached to an L-shaped splint which was then attached at midline to the jaw under the chin (Smith et al., Reference Smith, Johnson, McGillem and Goffman2000). The remaining four IREDS were attached to the modified sports goggles. These four IREDS along with the IRED on the forehead were used to form a reference frame so that movement of the upper lip, lower lip and jaw IRED could be calculated with reference to the constructed reference frame. This method corrected for head movement artifact (Smith et al., Reference Smith, Johnson, McGillem and Goffman2000). For this study, only movement in the superior–inferior dimension was analyzed and a sampling rate of 250 Hz was used. Simultaneously, time-locked acoustic signal was also digitized at 16 KHz by the Optotrak Data Acquisition Unit (ODAU) to synchronize audio to the corresponding movement data. The entire experimental session was also captured using a video camera and a separate DAT recorder. This video recording was used off-line to identify the fluent and error-free productions of the experimental stimuli. The DAT recordings were later used for the perceptual judgment experiment where 10 monolingual English speakers were asked to judge bilingual participants’ degree of foreign accent. Participants sat on a chair six feet from the camera with a microphone mounted 16 inches from their mouth.
Data extraction
Analytical procedures were similar for the real and the novel word conditions. Before analysis, video recordings were independently judged by two listeners and only utterances that contained no disfluencies, segmental errors, unnatural pauses, abnormal rate or extreme head movement were selected. For both conditions (the real word and the novel word), the first 10 consecutive selected productions were included for analysis.
Kinematic signals from the upper lip, lower lip and jaw along with corresponding acoustic signal were imported to the Matlab (Mathworks, 1993) signal processing program for data analysis. All kinematic signals were digitally low-pass filtered (10 Hz cut-off) in forward and backward directions. In this study, only data from the lower lip IRED marker and its movement in the superior–inferior dimension was chosen for analysis. Unlike lip aperture signal, which marks the coordinative synergy of the upper and lower lips (Chakraborty et al., Reference Chakraborty, Goffman and Smith2004; Smith & Zelaznik, Reference Smith and Zelaznik2004), the lower-lip signal is considered more variable and usually explored in kinematic studies addressing production of prosodic contrasts (Goffman, Reference Goffman2004; Goffman et al., Reference Goffman, Heisler and Chakraborty2006; Goffman & Malin, Reference Goffman and Malin1999). Based on data from 180 native English-speaking subjects, Smith and Zelaznik (Reference Smith and Zelaznik2004) reported that, across development, between the lip aperture coordinative synergy and the lower-lip synergy, the lip aperture synergy is more tightly constrained than the lower-lip synergy. Moreover, the lip aperture and the lower-lip synergies are representing two separate functional units (Chakraborty et al., Reference Chakraborty, Goffman and Smith2004; Smith & Zelaznik, Reference Smith and Zelaznik2004). Hence, in this study, we focus only on data from the lower-lip IRED marker and its movement in the superior –inferior dimension, because of its reported less-constrained nature, as well as for its sensitivity to prosodic alterations (Goffman, Reference Goffman2004; Goffman et al., Reference Goffman, Heisler and Chakraborty2006; Goffman & Malin, Reference Goffman and Malin1999) and utterance complexity (Kleinow & Smith, Reference Kleinow and Smith2000; Maner et al., Reference Maner, Smith and Grayson2000).
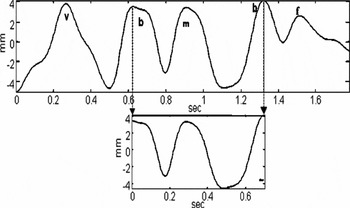
Based on the filtered data, using the three-point difference method, velocity was computed. Continuous displacement and velocity signals from the lower-lip IRED marker were displayed. To segment the target words from their carrier phrases, from each displacement waveforms, onsets and offsets corresponding to the target iambic and trochaic words were visually selected, using the maximum displacement points that corresponded to the closure of the labial consonants (Goffman et al., Reference Goffman, Heisler and Chakraborty2006). An illustration of data extraction is presented in Figure 1. The onset in “I have said [b∂ˈmΛp] before” corresponds with the initial closure for the consonant /b/ in [bəˈmʌp] and the offset corresponds with the closure for /b/ in before. A customized program, using a 100 ms decision envelope, automatically determined the location of the zero-crossing in the velocity profile that corresponded to the already selected onset or offset points associated with a target word. The acoustic signal corresponding to the duration interval between the onset and offset points was played back to ensure that the kinematic signal corresponded with the appropriate speech sample.
Illustration of extraction of the word [bəˈmʌp] from a single production of the carrier phrase “I have said [bəˈmʌp] before”. The lower-lip displacement in the superior–inferior dimension was used to segment the onset and offset points, as illustrated by the vertical lines.

Computation and analyses of movement variability
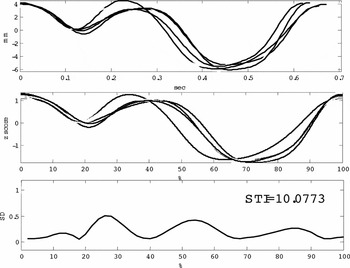
It is natural to expect inter- and intra-subject variability for the same articulatory target. Speakers vary in their speaking rate and labial movements. Thus, comparing their non-normalized data or raw data would yield very high degree of movement variability, but that would not capture if they were using an articulatory pattern or routine. Since the primary objective of this study was to understand the degree of variability in bilingual speakers’ movement pattern or routine, to evaluate Hypotheses 1 and 2, the spatiotemporal index (STI) introduced by Smith et al. (Reference Smith, Goffman, Zelaznik, Ying and McGillem1995) was used to operationalize movement variability. The variability index serves as a measure of stability of articulatory movements across repeated task performance (Smith et al., Reference Smith, Goffman, Zelaznik, Ying and McGillem1995). The primary objective of this analysis is to understand the degree to which a set of trajectories converges onto a single pattern or movement template. To compute the variability index, ten lower-lip displacement signals for each condition were amplitude and time normalized. For each record, amplitude normalization was accomplished by subtracting the mean of the record and then dividing by the standard deviation (Smith et al., Reference Smith, Goffman, Zelaznik, Ying and McGillem1995). For linear time normalization, each record was interpolated using a spline procedure onto a time base of 1000 points (Smith et al., Reference Smith, Goffman, Zelaznik, Ying and McGillem1995; Smith & Goffman, Reference Smith and Goffman1998). The standard deviation was computed at 2% intervals across the set of 10 normalized waveforms for each condition. The resultant 50 standard deviations were summed to determine the variability of the lower-lip displacement, the STI. That gave the variability index values for lower lip + jaw for each condition and for each subject. Overall, if the set of 10 normalized difference signals produced for the target sentence is highly convergent, the variability index will be low, suggesting that the speaker has a highly consistent coordination system. An illustration of the variability index computation is included in Figure 2. The top panel shows non-normalized results and the middle panel shows the same records, with time and amplitude normalized. The bottom panel shows the STI, or the sum of the 50 individual standard deviations obtained at 2% intervals across the normalized movement records.
Computation of STI from multiple productions of the word [bəˈmʌp]. Top panel shows original lower-lip displacement trajectories for one speaker's 10 productions of the word [bəˈmʌp]. The middle panel shows those same 10 lip aperture signals after amplitude and time normalization. The bottom panel shows the cumulative sum of the standard deviation values (i.e., the lower-lip spatiotemporal variability index (STI)) that were obtained at 2% intervals from the 10 normalized trajectories.

Statistical analyses
Two sets of analyses were performed in each condition (i.e., real and novel). In one set of analyses, two bilingual groups (10 L2-instructed bilinguals and 10 L1-instructed bilinguals) were compared with 10 monolingual speakers of English in the English language context. In a second set of analyses, only the 10 L2-instructed, the 10 L1-instructed participants were compared, separately in the English and in the Bengali context.
Separate repeated measures ANOVAs were performed for each of the conditions (i.e., real and novel word). In addition, data from English and Bengali language contexts were analyzed separately as there are inherent typological differences between these two languages. The between group factors/ variables were experimental groups (e.g., L2-instructed, L1-instructed and monolinguals for one set of analyses; L2-instructed and L1-instructed groups for another set) and within group factors/variables were stress pattern (trochaic and iambic), syllable position (first and second) and phonetic strings or words (e.g., [pVpVp] and [bVmVp] or bible and buffet). Statistical significance level was set at .05.
Results
Hypotheses 1 and 2 focused on the relationship between movement consistency and L2 experience and proficiency. As mentioned earlier, both L2-instructed and L1-instructed groups were expected to be similar in movement variability in the production of trochaic words, since these are occur frequently in both English and Bengali, and are expected to transfer. However, as Bengali does not have an iambic prosodic category, the production of iambic words was expected to increase movement variability, especially for the L1-instructed group. As a consequence, in the iambic context, the L1-instructed speakers of L2 were predicted to be more variable than the L2-instructed speakers of L2.
Comparison with monolingual English speakers
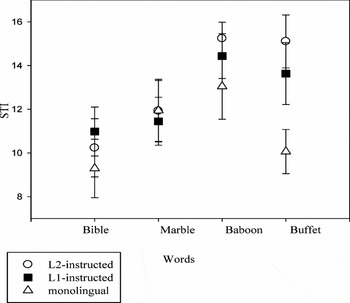
The primary purpose of this analysis was to examine the influence of language experience on movement consistency. For the first set of comparisons, English monolinguals (n = 10) were included along with the L2-instructed (n = 10), and the L1-instructed (n = 10) groups; only the English words were assessed. Findings for real words (Figure 3) showed no group differences, F(2,27) = 1.34, p = .28, η2p = .09. There was a main effect of stress, F(1,27) = 21.41, p < .0001, η2p = .44, with speakers more variable in the production of iambs (i.e., baboon and buffet) than trochees (i.e., bible and marble). No stress by group interaction, F(2,27) = 2.63, p = .09, η2p = .16 was observed.
Lower-lip spatiotemporal variability (STI) means and standard errors (represented by vertical bars) obtained from all 30 participants, L2-instructed group (open circle); L1-instructed group (filled square) and monolingual (open triangle). Data based on production of four real words in the English language context are reported here.

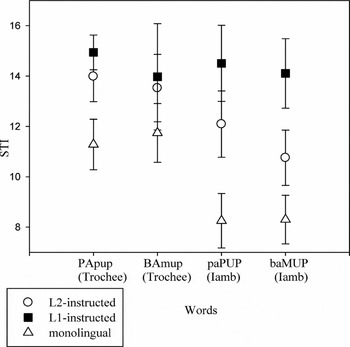
Unlike with the real words, in the novel word condition (Figure 4), a main effect of group, F(2,27) = 7.07, p < .001, η2p = .34, was observed. Post-hoc testing (Tukey HSD) revealed that L1-instructed (n = 10) bilingual speakers were more variable than both L2-instructed (n = 10) and monolingual (n = 10) English speakers, but the L2-instructed and the monolingual groups did not differ from each other. Contrary to the results in the real word condition, in the novel words, trochees were more variable than iambs, F(1,27) = 6.57, p = .002, η2p = .20, with no stress by group interaction, F(2,27) = 1.52, p = .24, η2p = .10.
Lower-lip spatiotemporal variability (STI) means and standard errors (represented by vertical bars) obtained from all 30 participants, L2-instructed group (open circle); L1-instructed group (filled square) and monolingual (open triangle). Data based on production of four novel words in the English language context are reported here.

Comparison between L2-instructed and L1-instructed: English and Bengali context
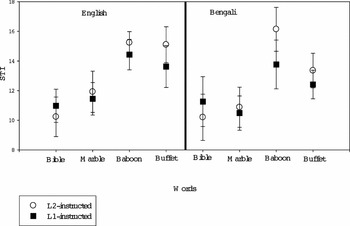
A second set of analyses involved only the bilingual speakers and focused on the influence of L2 proficiency on movement consistency of English and Bengali. These data are shown in Figures 5 (real words) and 6 (novel words). For real word production in the English context, L2-instructed and L1-instructed groups were equivalent in movement variability, F(1,18) = 0.16, p = .69, η2p = .008. A main effect of stress was observed, F(1,18) = 30.15, p < .001, η2p = .63, with iambs produced with more variability than trochees. There was no stress by group interaction, F(1,18) = 1.02, p = .32, η2p = .05. Similar to the English context, in Bengali, the L2-instructed (n = 10) and the L1-instructed (n = 10) groups did not differ, F(1,18) = 0.18, p = .67, η2p = .009, and a main effect of stress was observed, F(1,18) = 21.85, p < .001, η2p = .55, with iambs again more variable than trochees. No stress by group interaction was observed, F(1,18) = 2.09, p = .16, η2p = .10.
Lower-lip spatiotemporal variability (STI) means and standard errors (represented by vertical bars) obtained from 10 speakers from the L2-instructed group (open circle) and 10 speakers from the L1-instructed group (filled square). Left panel shows data based on four real words in the English language context and the right panel shows data based on the same four real words in the Bengali language context.

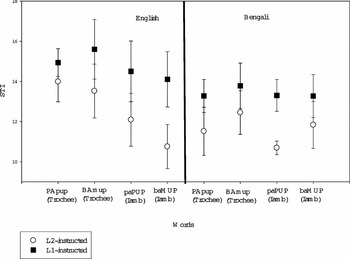
For the novel word productions in the English (L2) context (Figure 6), the groups did not differ, F(1,18) = 3.56, p = .07, η2p = .10. There was no stress by group interaction, F(1,18) = 0.57, p = .5, η2p = .06. However, unlike with the real words, no main effect of stress was observed in the English novel word condition, F(1,18) = 3.32, p = .08, η2p = .08. Similarly in Bengali, the groups did not differ, F(1,18) = 3.47, p = .07, η2p = .16. Again, no main effect of stress was observed, F(1,18) = 0.53, p = .47, η2p = .03, and there was no stress by group interaction, F(1,18) = 0.13, p = .72, η2p = .007.
Lower-lip spatiotemporal variability (STI) means and standard errors (represented by vertical bars) obtained from 10 speakers from the L2-instructed group (open circle) and 10 speakers from the L1-instructed group (filled square). Left panel shows data based on four novel words in the English language context and the right panel shows data based on the same four novel words in the Bengali language context.

In summary, as hypothesized, analyses of movement variability suggest that regardless of the nature of language experience or L2 proficiency, non-native speakers were more variable in their production of iambs than of trochees. In addition, the linguistic context or the target language did not influence movement variability for the trochaic and iambic words. That is, for both English and Bengali contexts, bilingual speakers were more variable for iambs than for trochees. The only exception to this generalization was when the three groups were compared for the novel words; trochees and iambs were equally variable there. In addition, bilingual speakers were equally consistent in their movement execution except in the English novel word condition where L1-instructed bilinguals were more variable than the L2-instructed bilingual and the monolingual English speakers.
Discussion
The primary objective of this study was to examine oral movement consistency when non-native speakers produced stress patterns that were consistent versus not consistent with their L1, Bengali. As hypothesized, regardless of the target language, non-native speakers of American English were more variable in their production of iambs than of trochees. This result was interesting for the following two reasons. First, the four real words incorporated into the Bengali lexical inventory as loan words (bible, marble, baboon and buffet) are highly familiar to native speakers of Bengali. Since Bengali only permits trochaic stress pattern, all four real words were likely to be produced with trochaic rhythm, even though in English, baboon and buffet are produced with an iambic rhythm. Hence, it might have been predicted that non-native speakers would not attempt to produce these two words with an iambic rhythm. However, in this study, in both Bengali and English contexts, non-native speakers were more variable in the production of iambs than they were for trochees. Perhaps, although these Bengali speakers had little experience producing iambic targets, they were sensitive to these non-native stress patterns as all of these speakers’ exposure to the native English-speaking community ranged between 1 and 10 years. It is likely that they had been exposed to these words produced with an iambic rhythm in the USA. The presence of a trochaic articulatory bias along with recent sensitivity to the iambic stress pattern might have led to higher movement variability for the iambic targets.
A second reason for our interest pertains to the relationship between the current and previous findings. Results of speech motor control mechanism of the monolingual speakers of this study support some earlier findings (Goffman et al., Reference Goffman, Heisler and Chakraborty2006; Goffman & Malin, Reference Goffman and Malin1999). Earlier studies based on novel word productions reveal differential effects of prosodic templates on movement variability. For example, monolingual English-speaking children showed decreased spatiotemporal variability in the production of iambic words than of trochaic words (Goffman et al., Reference Goffman, Heisler and Chakraborty2006; Goffman & Malin, Reference Goffman and Malin1999). Surprisingly, even though the trochaic pattern statistically dominates in English, especially in bisyllabic nouns, spatiotemporal variability was lower for iambic words. The authors concluded that spatiotemporal variability decreased for the less frequent iambic words because production of iambs required increased resource allocation. Similarly, in this study, in the novel word condition, monolingual speakers produced trochees with more variability than iambs, thereby supporting earlier studies related to monolingual speakers’ speech motor control patterns.
However, it was interesting to observe that bilingual speakers’ motor control mechanisms for the same novel targets showed different patterns and differed from the monolingual speakers’ production of novel words. In this study, when we consider movement variability only of the bilinguals, trochees and iambs were produced with similar consistency in the novel word condition, thereby suggesting that monolingual and bilingual speakers apply different motor control mechanisms for the same prosodic targets. This difference in movement specificity could also stem from the L1 and L2 variations in lexical stress rules. As Bengali does not have an iambic prosodic category and as the L1-instructed bilinguals had a relatively late exposure and lower proficiency in English, it was also hypothesized that in the iambic context, the L1-instructed speakers will be more variable than the L2-instructed speakers. Generally, in this study, all speakers employed stable, repeatable motor patterns in L1 and L2. That is, overall, speech movement variability was not influenced either by the nature of L2 experience or by L2 proficiency. These speakers restricted themselves to their already established articulatory routines and executed those routines with consistency. Similar results had been reported earlier in a study of the production of three simple English sentences by 21 Bengali–English bilingual speakers (Chakraborty et al., Reference Chakraborty, Goffman and Smith2008). In that study, spatiotemporal variability of lip aperture usually did not differ when earlier exposed and highly proficient bilinguals were compared with later exposed and less proficient bilinguals. Authors suggested that, regardless of L2 experience and proficiency level, adults rely on highly stable motor patterns. Such reduced flexibility might explain why it is difficult for adult learners to acquire new phonological skills.
In this previous experiment (Chakraborty et al., Reference Chakraborty, Goffman and Smith2008), only one condition showed an effect of proficiency, that is, sentences containing phonetic segments not native to either Bengali or English influenced movement consistency. The authors observed some phoneme specific effects, especially that more proficient speakers of L2 were relatively stable in their production of sentences containing segments not native in their L1. Based on this result, the authors suggested that the inclusion of language tasks that are complex or that violate principles of either L1 or L2 may result in differences in variability that were not observed in simple sentences included in the study. The present results generally showed that even iambic sequences that are not native to these bilingual speakers’ L1 were produced with a high degree of motor stability. As mentioned earlier, even though it was hypothesized that Bengali speakers would make an attempt to produce a less practiced non-native iambic pattern, they might not have attempted to produce the iambs in a manner which could have perturbed their existing, well practiced trochaic template. Hence, in the Chakraborty et al. (Reference Chakraborty, Goffman and Smith2008) study with non-native segments, movement variability was influenced by speakers’ L2 proficiency; however, in this study we did not observe similar results with prosodic perturbation. It could be speculated that the nature of speech movement control varies with the target linguistic constructs (i.e., segments versus lexical stress).
However, there was one situation where the L1-instructed group was relatively more variable. In the production of novel words in the English language context, when the three participant groups were compared, the L1-instructed group was more variable than the L2-instructed and the monolingual group. However, for the same condition, when the monolingual participants were excluded from analyses, their statistical difference closely approximated the significance level (F(1,18) = 3.56, p = .07). A possible explanation for the non-native speakers’ relatively higher movement variability in this context relates to the novelty of the target words and their association with their semantic and/or visual referents. The speech motor control system of the “L1-instructed speakers” must have been more perturbed by these novel stimuli than the speech motor system of the monolinguals and the “L2-instructed group”. Articulatory demand of producing a relatively unfamiliar stress pattern, in conjunction with a novel word learning task might have perturbed these speakers’ speech motor systems, resulting in increased variability.
Finally, presence of a short training paradigm exclusively in the novel word condition and inclusion of non-words which have almost zero frequency outside of the experimental context could also partially account for some of the reduced variability observed in Bengali speakers’ production of iambic tokens. In future studies, it would be interesting to explore the underlying neural mechanisms through some imaging studies, to understand why monolinguals produce iambs with reduced movement variability but the Bengali–English bilinguals produce the same targets with increased movement variability. Moreover, to explore the relationship between the nature of lexical stress learning and flexibility of specific movement parameters (i.e., movement duration and amplitude), future studies could be designed to compare kinematic recordings of pre- and post-training of non-native lexical stress pattern and/or other non-native linguistic constructs. Overall, the variability results of the present study suggest that processing of trochaic and iambic words and their influence on movement consistency depends not only on resource allocation but also on factors such as the nature of the participants, their language experience and age (children versus adults), differences and similarities between the two linguistic systems and probably the nature of their L1, L2 or even L3 proficiency.
Experiment 2: Influence of L2 proficiency on perception of foreign accent
Hypothesis 3 was addressed by examining how 10 native English speakers rated according to perceived degree of foreign accent based on L2-instructed and L1-instructed speakers’ productions of the English real and novel words. All 10 participants were graduate students at Texas State University – San Marcos (Mean age = 23 years) and were monolingual speakers of standard American English with no previous exposure to speakers of Indian English background and had no history of hearing loss.
Real and novel words were presented in separate blocks and the order of presentation was counterbalanced across the participants. Two samples of each target word were extracted from the English sentence using PRAAT acoustic software (Boersma & Weenink, Reference Boersma and Weenink2009). Eight tokens (4 target words × 2 samples of each target word) were selected from each subject/participant and in each phase (i.e., real and novel), and randomized across all 24 bilinguals. Production data from the monolingual participants were not included here because the aim of the perceptual judgment experiment was to examine how native English speakers perceptually categorized the L2-instructed and the L1-instructed speakers’ productions of the English words. Thus, influence of L2 proficiency on native speakers’ perception of accent was evaluated. Productions were played through loudspeakers and each listener ranked perceived degree of accent based on a nine-point scale (Southwood & Flege, Reference Southwood and Flege1999), where 9 represented “very native-like” and 1 represented “very non-native-like” accent. Statistical analyses resembled Experiment 1.
Results
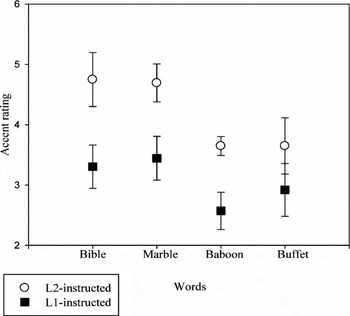
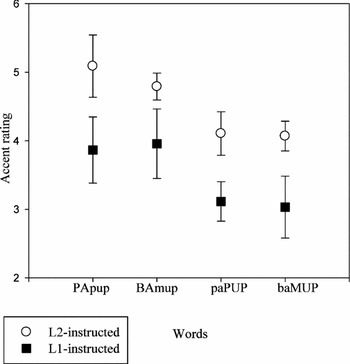
In this analysis, the L2-instructed (n = 10) and the L1-instructed groups (n = 10) were compared based on ten native English speakers’ judgments of perceived degree of foreign-accent ratings. In the real word condition (Figure 7), the L2-instructed group received higher native-like-accent ratings than the L1-instructed group, F(1,18) = 7.26, p = .015, η2p = .29. A main effect of stress was also observed, F(1,18) = 14.35, p = .001, η2p = .44, with trochees (i.e., bible and marble) receiving significantly higher nativity ratings than iambs (i.e., baboon and buffet). Similar results were observed in the novel word condition (Figure 8). The L2-instructed group received higher native-like-accent ratings than the L1-instructed group, F(1,18) = 4.98, p = .039, η2p = .22. A main effect of stress, F(1,18) = 4.54, p = .001, η2p = .45, revealed that the trochees were rated higher than the iambs. Overall, as expected, native English listeners judged productions of the L2-instructed group as more native-like than the L1-instructed group in both the real and the novel word conditions. It was interesting to observe that trochees received higher rankings in both the real and the novel word conditions. Inter-rater reliability for the real and the novel word conditions was, 81% and 76%, respectively.
Perceived degree of foreign-accent ratings of 20 bilingual speakers’ production of real words. Ratings are based on perceptual judgments of 10 monolingual native speakers of American English on a nine-point scale. In the scale, 9 = very native-like and 1 = very non-native-like productions. Error bars represent standard errors.

Perceived degree of foreign accent ratings of 20 bilingual speakers’ production of novel words. Ratings are based on perceptual judgments of 10 monolingual native speakers of American English on a nine-point scale. In the scale, 9 = very native-like and 1 = very non-native-like productions. Error bars represent standard errors.

Discussion
Consistent with earlier studies, productions of L2-instructed group were rated to be more “native-like” than the L1-instructed group (e.g., Flege, Frieda & Nowaza, Reference Flege, Frieda and Nowaza1997; Guion, Flege & Loftin, Reference Guion, Flege and Loftin2000b; also see Piske, Mackay & Flege, Reference Piske, Mackay and Flege2001). Importantly, this finding was not influenced by the lexical status or familiarity of the target words as the results were similar across the two experimental conditions (i.e., real or novel word). In both experimental conditions, English productions of the L2-instructed group received more native-like-accent ratings compared to English productions of the L1-instructed group. The results of the perceptual judgment analysis also confirmed the categorization of the two groups of bilinguals recruited for this study. That is, participants with early academic immersion in English had relatively higher Speaking Grammar scores on TOAL-3 and their productions were also perceived as more native-like by the native speakers of American English. In contrast, bilinguals with late academic immersion in English had relatively lower scores on TOAL-3 and their L2 productions received relatively lower accent ratings as well. However, the relationship among variables such as age of initial exposure to L2, oral L2 proficiency score and L2 accent should be interpreted with caution. Many other factors may influence perception of degree of foreign accent, including age of arrival in an L2-speaking community (e.g., Flege, Munro & MacKay, Reference Flege, Munro and MacKay1995; Flege Yeni-Komshian & Liu, Reference Flege, Yeni-Komshian and Liu1999; Tahta, Wood & Loewenthal, Reference Tahta, Wood and Loewenthal1981), the nature of L2 exposure, amount of L1 and L2 usage, language learning aptitude and motivation, length of residence in an L2-speaking community, formal instruction, linguistic similarities and differences in speakers’ L2 and L1, selection of target speech materials and elicitation techniques (Piske et al., Reference Piske, Mackay and Flege2001), speaking rate (Munro & Derwing, Reference Munro and Derwing1995), as well as listeners’ familiarity with non-native speech (Bradlow & Bent, Reference Bradlow and Bent2008), and lexical frequency and listening context (Levi, Winters & Pisoni, Reference Levi, Winters and Pisoni2007). In addition, in this study, it is also evident that factors such as age of academic immersion in a dialectical variation (i.e., Indian variety of English) of an L2 might also influence perceived degree of foreign accent of native speakers’ from a different dialect of the same language.
As expected, trochaic words with strong–weak stress pattern, in both the real word and the novel word conditions, received higher “native-like” ratings than the iambic productions. For example, in the real word condition, the trochaic targets bible and marble received significantly higher ratings than the iambic targets baboon and buffet. Differences in accent rating between trochaic and iambic words could be due to the fact that, in Bengali, only trochaic stress pattern is permissible and as a consequence, all the Bengali–English bilingual participants superimposed their more familiar and extensively used trochaic pattern on the iambic (i.e., weak–strong) targets. As a result, native listeners, when they listened to the iambic targets produced by the bilingual participants, might have noticed a lexical stress mismatch between their expected iambic stress pattern and the stress pattern produced by the participants, which resulted in an assignment of lower native-like-accent ratings for the iambic targets. However, in future work, it will be interesting to explore how specific kinematic variables like movement duration and amplitude potentially relate to the perceptual correlates of stress and native-listener ratings of stress pattern for native and non-native speakers. It would also be interesting to probe what variables or rubrics native speakers use when they rate non-native speakers as “native-like” versus “non-native-like”. Inclusion of a monolingual-speaking group could offer a concrete reference to the listeners.
Conclusion
This study offers insights into the nature of language–speech motor interactions in bilinguals using a relatively unexplored adult bilingual population (i.e., Bengali–English bilinguals). Bilingual speakers’ L2 experience and proficiency did not always influence or perturb their movement consistency, even when the target required production of a prosodic contrast that is not consistent with their L1 prosodic rules. However, this study also offers preliminary evidence of non-native speakers’ differential articulatory sensitivity to a non-native prosodic contrast, as both groups of bilinguals were more variable for the iambic targets. The results of this study differ from a previous study with a bilingual population from the same L1 (Bengali) background (Chakraborty et al., Reference Chakraborty, Goffman and Smith2008). In that study, non-native speakers’ L2 proficiency did influence their movement consistency when the task demanded production of an utterance with non-native segments. The adult bilingual speakers’ motor control mechanism is probably governed by a movement control template which has sensitive dependence on its initial linguistic experience and the nature of its mechanism appears to have formed its stable and restricted scope based on individual speakers’ linguistic-influence-driven motor control history. As a consequence, regardless of the articulatory target, adult bilingual speakers’ movement control mechanism is only following movement parameters specified by their linguistic-experience-driven movement control template. Such a hypothesis might explain why it is relatively difficult for adult non-native speakers to execute new articulatory behavior that might result in native-like accent in their target L2. In addition, when findings of perceptual judgment analysis are also considered with these two aforementioned kinematic studies, overall, the results of this study suggest the existence of an intricate relationship among L2 proficiency, speech movement control, perceived degree of foreign accent and the higher level linguistic demands. The relationship among these variables appears intricate due to interpretation of differential findings stemming from these studies. For example, as reported earlier, the influence of L2 proficiency on movement consistency does not exclusively depend on the target non-native constructs (i.e., segments versus prosody); it also varies with the novelty of the semantic referent (i.e., real versus novel), the language context (i.e., English versus Bengali), window of analyses (i.e., sentence versus word) and the nature of the bilingual participants. In addition, the relationship between these production variables and their perceptual correlates (e.g., stress, perceived degree of accent, loudness, duration) probably adds more complexity to this non-linearity in our interpretation. It is interesting that the listeners seemingly picked up on more of a difference between the bilingual groups than the variability measure based on kinematic signals. Therefore, a series of future studies carefully controlling and manipulating these variables and exploring the interactions among production and perceptual constructs are critical for developing normal bilingual speech production models and for generating better intervention strategies for bilinguals.
In summary, the present results provide new insights into how L2 proficiency interacts with production of native and non-native lexical stress in an L1 and an L2. It is important to note that the nature of bilingualism in our participants was different from that generally studied. In this study, the course of exposure to a dialectical variation of L2 was domain specific but extended and disseminated differently, thereby reiterating that the results from any study related to bilingual speakers should be carefully interpreted due to the inherent heterogeneous nature of modern bilingualism. In India, individuals are often exposed to a particular dialect of English to varying degrees as part of the social and educational process. Thus, the results of this study should be interpreted with reference to specific attributes of Bengali–English language learning in a unique socio-linguistic scenario of India.