Democratic theory holds that people’s preferences should be equally represented in collective decision making regardless of their income and wealth. But it has long been recognized that there is a potentially fateful tension between the ideal of political equality and factual economic inequality. For example, considering campaign contributions it is easy to see that advantages in economic resources can lead to advantages in political representation even when elections are free and fair (Campante Reference Campante2011). Over the last two decades, political science research assessing the degree of unequal representation in the United States and Europe has boomed. It has highlighted worrying disparities in political responsiveness. What has been explored far less is evidence on which policies or institutions can dampen political inequality.
Larry Bartels’ (Reference Bartels2008) pioneering study revealed that U.S. senators casting roll-call votes respond much more to the views of the affluent than to middle income constituents. The preferences of the poor seem to be virtually ignored. Evidence of unequal representation has also been found for the House of Representatives, party platforms, and national and state policy (e.g., see Bartels Reference Bartels2016; Bhatti and Erikson Reference Bhatti, Erikson, Enns and Wlezien2011; Flavin Reference Flavin2012; Gilens Reference Gilens2012; Hertel-Fernandez, Mildenberger, and Stokes Reference Hertel-Fernandez, Mildenberger and Stokes2019; Lax, Phillips, and Zelizer Reference Lax, Phillips and Zelizer2019; Rhodes and Schaffner Reference Rhodes and Schaffner2017; Rigby and Wright Reference Rigby and Wright2013). Beyond the American context, recent scholarship documents similar patterns across a range of political systems in advanced industrialized democracies (Bartels Reference Bartels2017; Elsässer, Hense, and Schäfer Reference Elsässer, Hense and Schäfer2018). Thus, it may appear that unequal democracy is an inherent feature of capitalism. In contrast, we argue that organized labor can be an effective source of political equality in the United States even in times of high economic inequality.
We analyze the causal role labor unions play in increasing legislative responsiveness to low-income constituents. A large literature in political science, economics, and sociology examines the effect of unions on economic inequality and redistributive politics, and there are competing views on whether unions are a force for political equality (Ahlquist Reference Ahlquist2017). However, as noted by Kathleen Thelen, the study of labor unions typically “does not come up in the mainstream literature on American Politics” (Thelen Reference Thelen2019, 12). Scholars have shown that unions are one of the few membership organizations in national politics that advocate on behalf of non-managerial workers (Schlozman, Verba, and Brady Reference Schlozman, Verba and Brady2012) and sometimes even strike in the interest of others (Ahlquist and Levy Reference Ahlquist and Levy2013). Yet few have directly addressed the question whether stronger unions translate into less income-biased responsiveness by elected representatives.Footnote 1
The existing evidence is of somewhat limited scope. Prior scholarship does not disentangle whether union strength causes higher political equality or merely correlates with it. One major threat of endogeneity stems from the potential of policy feedback. As John Ahlquist points out in a recent review, unions may influence “parties and policy, but policy and institutions also affect unionization rates” (Ahlquist Reference Ahlquist2017, 427). Weaker unions may be more of a symptom than a cause of biased representation. State and local politicians set varying rules that affect costs and benefits of union membership. Research highlights the political logic behind the expansion of public sector union laws in the 1960s and 1970s (Anzia and Moe Reference Anzia and Moe2016; Flavin and Hartney Reference Flavin and Hartney2015) as well as the countervailing success of conservative groups to demobilize public sector unions since the early 2000s (Hertel-Fernandez Reference Hertel-Fernandez2018). In the private sector, “right-to-work” laws hamper unionization efforts with often profound political impact (Feigenbaum, Hertel-Fernandez, and Williamson Reference Feigenbaum, Hertel-Fernandez and Williamson2018). Furthermore, any relationship between union strength and equal legislative responsiveness may be spuriously driven by the same underlying determinants (e.g., critical junctures, social capital).
In addition to concerns about causality, the literature on unequal representation faces the challenge of how to measure public preferences. Even large surveys like the Cooperative Congressional Election Study (CCES) are not designed to be representative at the level of congressional districts. One may thus worry that the seeming legislative underrepresentation of the poor may be an artifact of systematic sampling error.Footnote 2
We tackle these problems using corrected estimates of policy preferences for congressional districts, fine-grained data on local unions and a three-pronged empirical strategy to account for alternative explanations. We examine the impact of unions on the link between preferences and roll-call votes in the contemporary U.S. Congress, where unequal responsiveness by legislators (and their staff) has been well documented (Bartels Reference Bartels2008, Reference Bartels2016; Ellis Reference Ellis2013; Hertel-Fernandez, Mildenberger, and Stokes Reference Hertel-Fernandez, Mildenberger and Stokes2019; Rhodes and Schaffner Reference Rhodes and Schaffner2017). We focus on members of the House of Representatives during the 109–112th Congress (2005–2012) since this setting enables us to capture within-state variation in union strength and within-district variation in preference polarization by income across a range of contested policy issues.
At its core, our dataset combines income-specific measures of constituency preferences based on 223,000 survey respondents matched to roll-call votes with information on local unions extracted from more than 350,000 administrative records. We measure district-level preferences using multiple waves of the CCES and calculate preferences on twenty-seven concrete policies, which can be matched to thirty-seven roll-call votes, for each income group in each congressional district. We employ small area estimation using individual-level census data (this circumvents sampling issues with the CCES; but note that our findings are robust when using multilevel regression and poststratification [MRP] instead). Drawing on recent work by Becher, Stegmueller, and Kaeppner (Reference Becher, Stegmueller and Kaeppner2018), we measure the district-level strength of unions using mandatory reports filed by local unions to the Department of Labor.Footnote 3
Our empirical analysis traces the legislative responsiveness of House members to the preferences of different income groups in their constituency conditional on district-level union strength. In line with previous research, we find that on average legislative votes are significantly less responsive to the policy preferences of low-income compared to high-income constituents. However, this gap in responsiveness is smaller where unions are stronger. We estimate that a standard deviation increase in unionization increases responsiveness towards the poor by about six to eight percentage points (and it somewhat reduces responsiveness to higher incomes). As a result, in districts with relatively strong unions legislators are about equally responsive to rich and poor Americans.
To rule out alternative explanations, we control for factors that may also condition legislative responsiveness. They include state-level policies toward public and private sector unions, state fixed effects, rich district socio-demographics, and proxies for social capital. For more robust causal identification, we then conduct an instrumental variable (IV) analysis. It leverages plausibly exogenous variation in union strength that stems from geography and the history of union mobilization in the middle of the twentieth century. We also employ a general post-double-selection estimator, which attempts to reduce omitted variable bias using machine learning variable selection.
Our findings have important implications for the debate about the functioning of democracy in unequal times. Scholars and pundits often find it straightforward to explain why the views of the poor are poorly represented. By definition, those in the lower part of the income distribution have fewer resources, and many studies have shown that they are less likely to participate in politics. In contrast, our results show that unequal legislative responsiveness is not hardwired into the fabric of American democracy. In the congressional arena, local unions are a countervailing force. Related work on poverty policy, which uses a priori defined interests of the poor (rather than their stated preferences), concludes that the poor are not represented by Congress as a whole. It also highlights that legislative efforts on behalf of the poor often come from “surrogate representatives” in other districts and not from a direct electoral connection (Miler Reference Miler2018). Our results, however, imply that local unions provide some scope for the direct representation of the preferences of the relatively poor in the democratic process. Our findings also qualify the argument made by some comparative scholars that unions do not matter for equality unless there is a national institutional arrangement of centralized or coordinated bargaining between unions and employers (Iversen Reference Iversen1999; Mares Reference Mares2006). The sizable impact of strong unions might also explain why unions remain under sustained attack by conservative groups (Hertel-Fernandez Reference Hertel-Fernandez2018).
Our study is complementary to research on contributions, political participation, or partisanship as important determinants of unequal legislative responsiveness (Barber Reference Barber2016; Leighley and Oser Reference Leighley and Oser2018; Rhodes and Schaffner Reference Rhodes and Schaffner2017). From our theoretical perspective, these factors are likely mechanisms through which unions affect representation.
Theoretical Considerations
Various strands of scholarship suggest that labor unions may be one of the few mass-membership organization that provide collective voice to lower income individuals (Ahlquist Reference Ahlquist2017; Ellis Reference Ellis2013; Flavin Reference Flavin2018; Freeman and Medoff Reference Freeman and Medoff1984; Schlozman, Verba, and Brady Reference Schlozman, Verba and Brady2012).Footnote 4 Consistent with a central premise of the collective voice perspective, contemporary unions in the United States tend to take positions favored by less affluent citizens.Footnote 5 However, shared preferences between the less well-off and organized labor are by no means sufficient to alter inequalities in political representation. This requires an effective political transmission mechanism. Several prominent scholars of representation are skeptical that unions can fulfill that role. They suggest that unions have become too weak, too narrow, or too fragmented to have a significant egalitarian political impact in national politics (e.g., Gilens Reference Gilens2012, 175; Hacker and Pierson Reference Hacker and Pierson2010, 143).
The ability of unions to increase the rate of political participation⸺including contacting officials, attending rallies, making donations, and voting⸺of low- and middle-income citizens is often considered key to their political influence. Importantly, unions may also increase participation among non-members with similar policy preferences through get-out-the-vote campaigns and social networks (Leighley and Nagler Reference Leighley and Nagler2007; Rosenfeld Reference Rosenfeld2014; Schlozman, Verba, and Brady Reference Schlozman, Verba and Brady2012).Footnote 6 Making contributions to favored candidates and campaigns complements the ability of unions to communicate with and mobilize members or to provide campaign volunteers. Indeed, unions are among the leading contributors to political action committees (PAC) accounting for a quarter of total PAC spending in 2009 (Schlozman, Verba, and Brady Reference Schlozman, Verba and Brady2012, ch. 14), and⸺in contrast to corporations and business organizations⸺“represent the aggregation of a large number of small individual donations” (Schlozman, Verba, and Brady Reference Schlozman, Verba and Brady2012, 428).Footnote 7
Unions’ mobilization capacity can affect policy decisions by representatives in two ways. First, it may shape who is elected in a given electoral district. If politicians are not exchangeable (because they differ in their commitments and beliefs), political selection is important. In an age of elite polarization, the partisan identity of a representative is often crucial for determining legislative voting (Bartels Reference Bartels2016; Rhodes and Schaffner Reference Rhodes and Schaffner2017; Lee, Moretti, and Butler Reference Lee, Moretti and Butler2004). Since the New Deal era, unions and union members have largely allied with the Democratic Party, given its stronger support for many of their broader policy demands (Lichtenstein Reference Lichtenstein2013; Schlozman Reference Schlozman2015).
Second, unions’ mobilization potential shapes the incentives of elected representatives beyond their partisan affiliation and personal traits. Policymakers’ rational anticipation of public reactions plays a central role in theories of accountability and dynamic responsiveness (Arnold Reference Arnold1990; Stimson, Mackuen, and Erikson Reference Stimson, Mackuen and Erikson1995). While many individual legislative votes do not affect the reelection prospects of representatives, on potentially salient votes they can face hard choices between party ideology and competing constituency preferences.
What matters is that stronger local unions in a congressional district pose a credible mobilization threat. Given such a threat, not all elections will be competitive because strong challengers may be scared off. Relatedly, career-oriented incumbents will try to anticipate union responses to their legislative actions. This logic has important implications for our analysis of mechanisms later on.
Taken together, this reasoning implies the hypothesis that the district-level strength of labor unions increases the responsiveness by members of Congress to the poor at the expense of the affluent. While we know from previous work that politicians are considerably more responsive to the preferences of those with higher incomes, stronger unions should mitigate this bias and thus move responsiveness more towards the ideal of political equality. Moreover, we will assess whether unions shape legislative responsiveness through partisan selection based on their capacity for electoral mobilization.
Data and Measurement
Any effort to test the relevance of unions for unequal representation confronts major challenges of measurement and causal inference. Our empirical approach allows us to address these issues to an extent previously impossible. For the House of Representatives in the 109th to the 112th Congress, we created a panel of legislators’ roll-call votes matched to income-specific policy preferences at the district level, and district-level measures of union membership, based on digitized administrative records from the Department of Labor.Footnote 8 Using data for 223,000 CCES respondents voting on twenty-seven specific roll calls, we estimate policy preferences for low- and high-income constituents in each district for these issues, adjusting for the fact that the CCES is not a representative sample of district populations.
Measuring District Preferences by Income Group
The CCES is a good starting point for our analysis, since it is a nationally representative internet study, includes a considerable number of roll-call questions, and provides us with a large enough sample size to decompose income-group preferences by district. It largely addresses the problem that the number of observations in each subgroup defined by income and congressional district is too low (Bhatti and Erikson Reference Bhatti, Erikson, Enns and Wlezien2011). The roll calls included in the CCES concern key votes as identified by Congressional Quarterly and the Washington Post and cover a broad range of issues. Respondents are presented with the key wording of the bill and are then asked to cast their own vote: “What about you? If you were faced with this decision would you vote for, against, or not sure?” Contrary to widely used agree–disagree survey measures of issue preferences, matched roll-call votes provide us with more clear-cut evidence of legislators’ responsiveness to citizens (Ansolabehere and Jones Reference Ansolabehere and Jones2010, 585).Footnote 9 We match twenty-seven roll-call items in the 2006–2012 CCES to roll thirty-seven call votes cast in the House. These cover important legislative decisions, such as Dodd-Frank, the Affordable Care Act (and attempts to repeal it), the minimum wage increase, the ratification of the Central America Free Trade Agreement, or the Lilly Ledbetter Fair Pay Act. Table A.2 in the online appendix lists all matched CCES items and House bills included in our sample.
The CCES provides a comparatively large sample size per district. However, it is not designed to be representative for congressional district populations. Thus, individuals with certain characteristics, such as particular combinations of income, race, and education, may be underrepresented in the CCES sample of a given district. If this is the case, unadjusted policy preferences from the CCES will not reflect the target population and using them can lead to biased estimates of unequal representation in Congress.Footnote 10
Our solution to this problem is a small area estimation procedure that rebalances the survey sample to represent the district population using fine-grained Census data and flexible machine learning matching tools. The basic idea is to combine the CCES survey data on voter preferences with accurate data on the distribution of population characteristics in a district from the Census Bureau’s American Community Survey (ACS). The machine learning solution we propose is relatively new to the representation literature. It has attractive properties that merit its application to this problem. However, our findings do not depend on this particular approach. We obtain qualitatively comparable results when using the MRP approach widely used by political scientists (Lax and Phillips Reference Lax and Phillips2009).Footnote 11
Concretely, we use about three million individual-level records from a synthetic sample of the ACS from 2006 to 2011, which provides an accurate representation of the district population. We stack both datasets, creating a structure where we have common district identifiers and individual covariates while responses to policy preference questions are missing in the Census portion of the data. As common covariates bridging CCES and Census we use the following demographic characteristics: gender, race (three categories), education (five categories), age (continuous), and family income (continuous). The latter is of particular relevance since we are interested in producing district-income group-specific preferences. In the next step we fill missing preferences in the Census with matching data from CCES respondents. Since this is essentially a prediction problem, we can use powerful tools developed in the machine learning literature to achieve this task. We use an algorithm proposed by Stekhoven and Bühlmann (Reference Stekhoven and Bühlmann2011) to impute missing cells.Footnote 12 Compared to commonly used multivariate normal or regression imputation techniques, this strategy is fully nonparametric, allows for complex interactions between covariates, and handles both continuous and categorical data. Our completed dataset now contains preferences for twenty-seven roll-call items of synthetic “Census individuals,” which are a representative sample of each House district.
With these data in hand, we assign individuals to income groups and calculate group-specific preferences for each roll call in each district. Following previous work (Bartels Reference Bartels2008, Reference Bartels2016), we delineate low- and high-income respondents using the thirty-third and sixty-seventh percentile of the distribution of family incomes. Following theories of constituency representation and methodological recommendations of Bhatti and Erikson (Reference Bhatti, Erikson, Enns and Wlezien2011), we specify these income thresholds separately by congressional district. This accounts for the substantial differences in both average income and income inequality between U.S. districts. It also ensures that within each district, income groups are of equal size. On average, our chosen cutoffs are close to those used in previous studies. The mean of our district-specific low-income cutoffs is around $39,000, while Bartels uses $40,000 (Bartels Reference Bartels2016, 240); our mean high-income cutoff is around $81,000, where Bartels employs a threshold of $80,000. However, beyond these averages lies considerable variation. In some districts, the thirty-third percentile cutoff is as low as $16,500, while the sixty-seventh percentile reaches almost $160,000 in others.Footnote 13
For each roll call, we then estimate district-level preferences of low- and high-income constituents as the proportion of individuals voting “yea.” These preference estimates range from 0 to 1 and will be mapped to changes in legislators’ probability of voting “yea” on a given roll call.
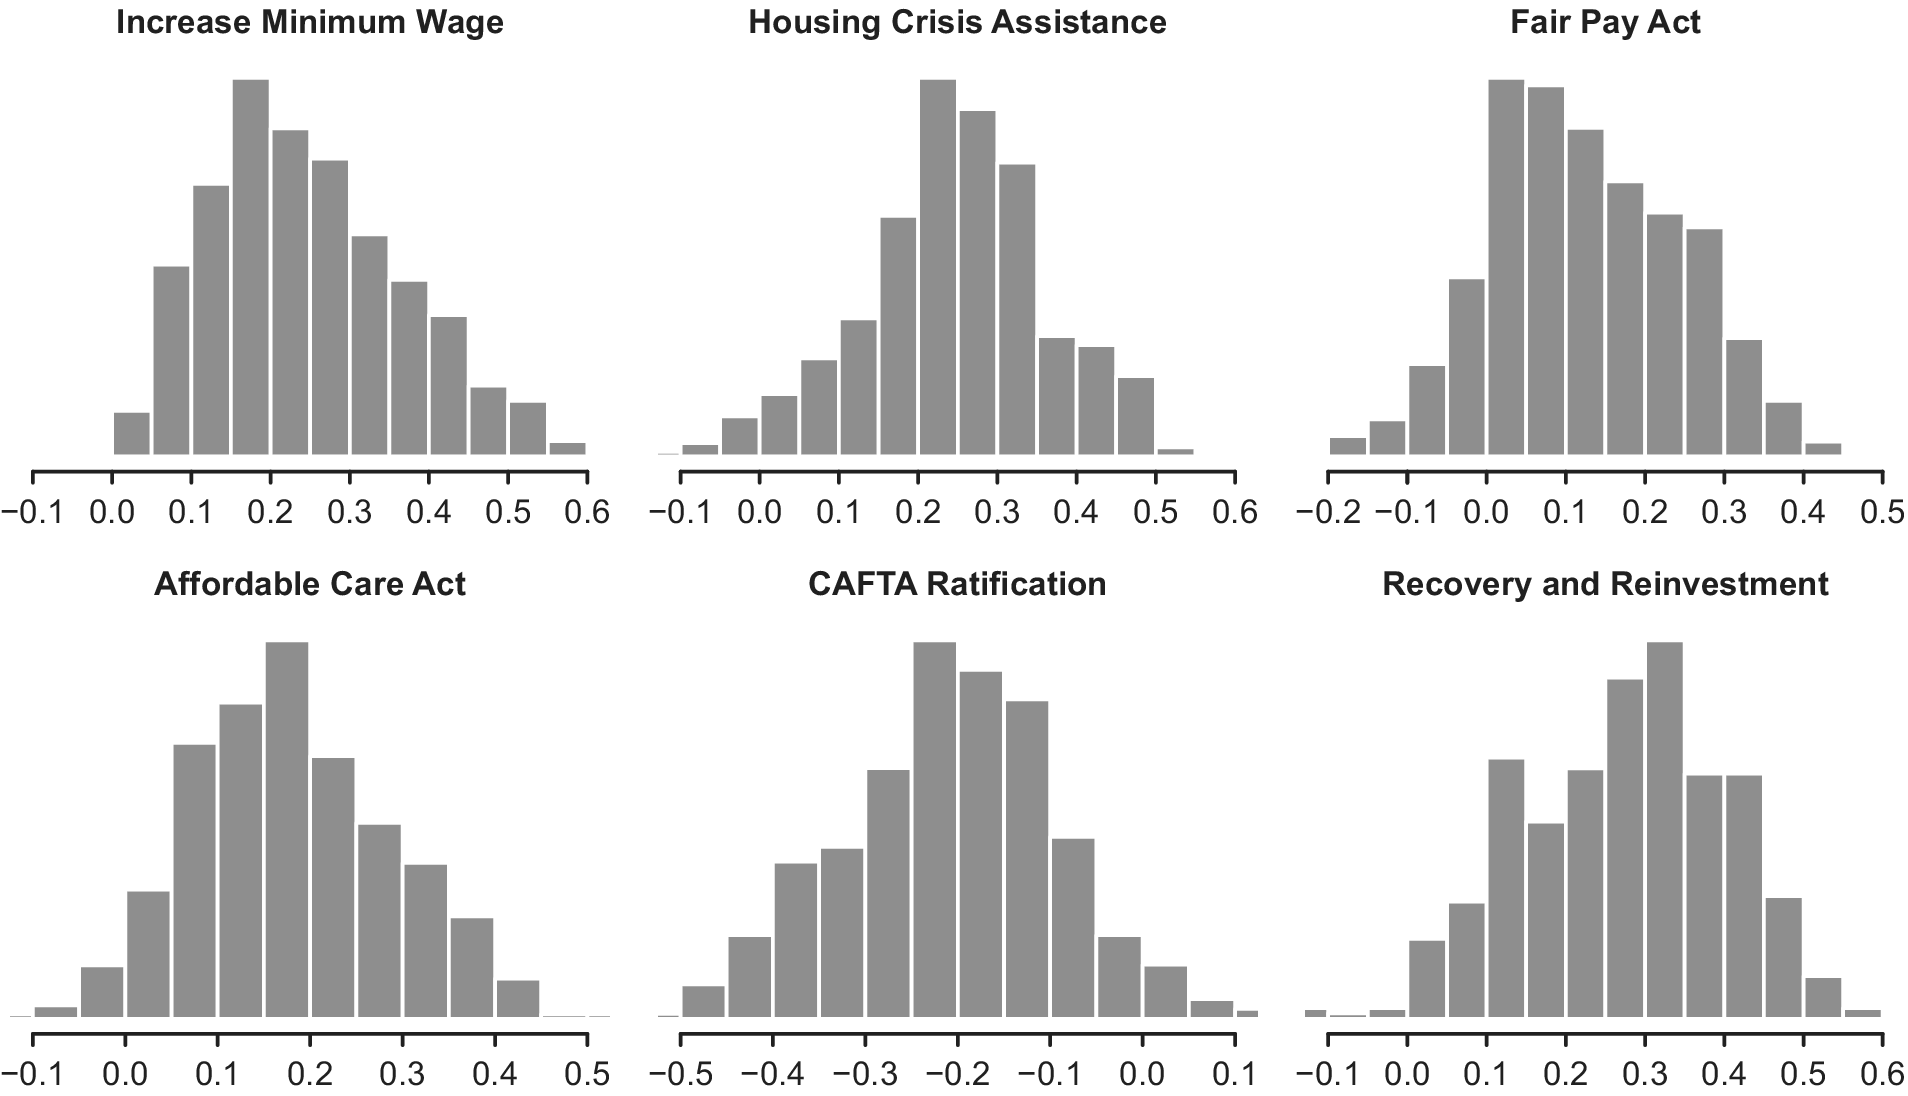
Our data shows considerable variation in the gap of policy preferences between high- and low-income constituents. Figure 1 plots histograms of the difference between low-income and high-income preferences in congressional districts for six selected roll calls. For bills such as increasing the minimum wage (the Fair Minimum Wage Act), housing crisis assistance (the Housing and Economic Recovery Act), or the Affordable Care Act, the vast majority of low-income constituents are more supportive than their high-income counterparts in each and every district. On other issues, such as the ratification of the Central America Free Trade Agreement, high-income constituents are clearly in favor. In all examples, we find considerable across-district variation in the preference gap between low- and high-income constituents.Footnote 14 We leverage this variation over both roll calls and districts to estimate legislators’ differential responsiveness to changes in policy preferences of different income groups, and how it might be moderated by union strength.
District-level income gap in public support for six selected policies
Note: Each histogram plots the difference in support for a matched roll-call vote question between people in the lower-third and people in the upper-third of their district’s income distribution for all House districts.

District-Level Union Membership
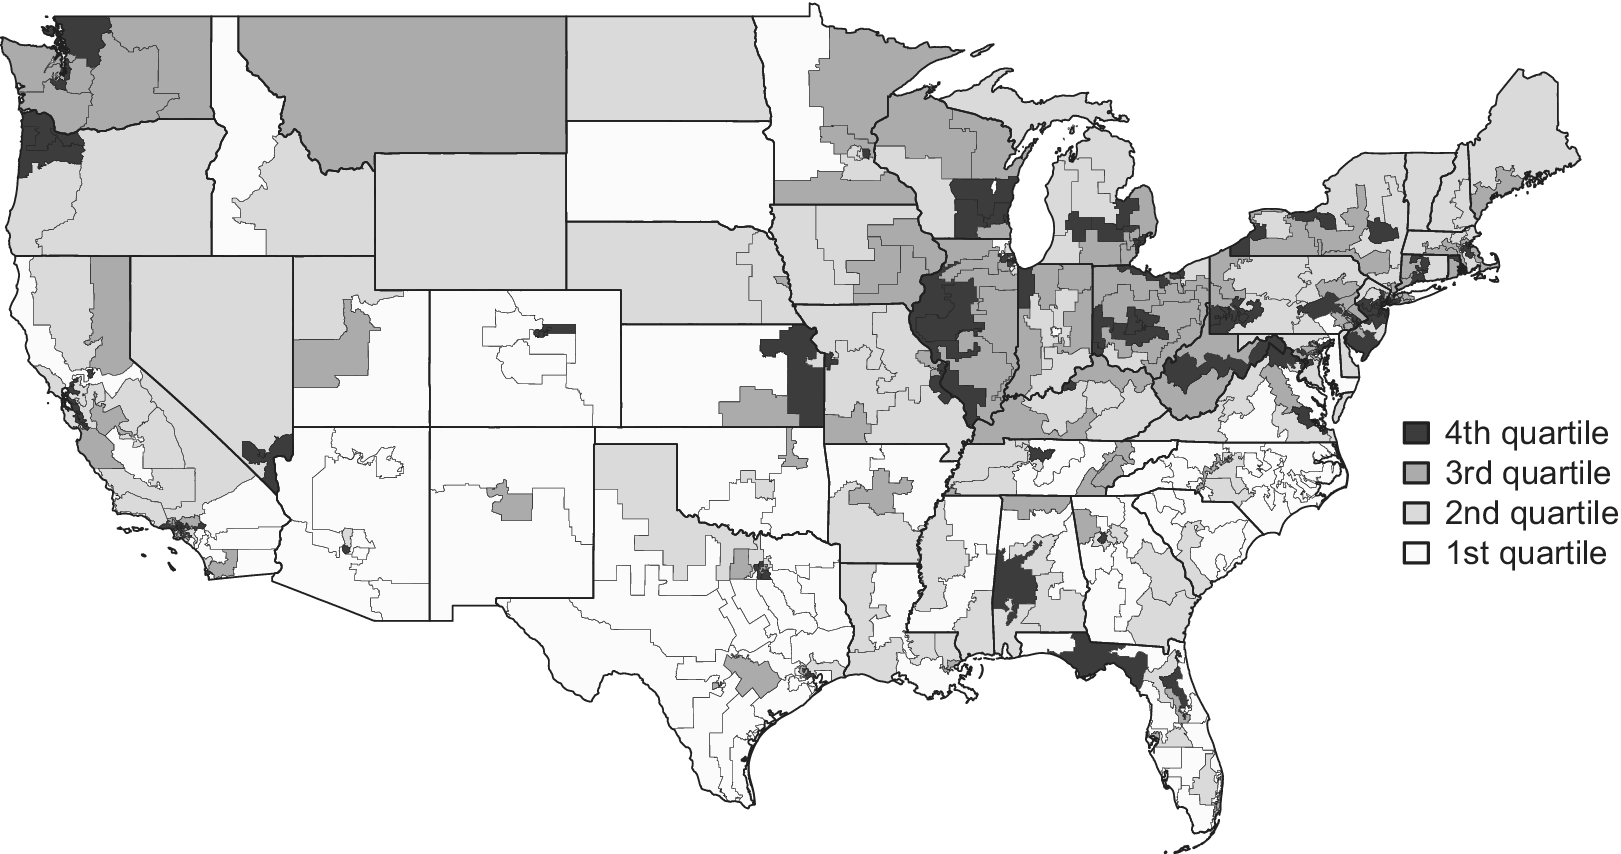
To measure district-level union membership we draw on fine-grained administrative data on local unions compiled by Becher, Stegmueller, and Kaeppner (Reference Becher, Stegmueller and Kaeppner2018). Union locals are the basic unit in the union organizational pyramid. By law, they are formed around a recognized bargaining unit, which usually comprises a precise physical establishment, such as a factory, warehouse, or school (though they may also cover multiple establishments). Based on the Labor Management Reporting and Disclosure Act (LMRDA) of 1959, unions have to file mandatory yearly reports (called LM forms) with the Office of Labor-Management Standards (OLMS). The Civil Service Reform Act of 1978 introduced a similarly comprehensive system of reporting for federal employees. A mandatory part of each report contains the number of union members. Failure to report, or reporting falsified information, is made a criminal offense under the LMRDA, and reports filed by unions are audited by the OLMS. The resulting database contains almost 30,000 local unions (i.e., it excludes state or national level units). It is based on 358,051 digitized individual reports that were cleaned, validated, geocoded, and matched to congressional districts. The total membership of union locals in each congressional district is obtained as the sum of all reported union members. Figure 2 shows the distribution of union membership in districts. It demonstrates the substantial variation in unionization between electoral districts, which would be ignored by a state-level analysis. Note that while individual union locales exhibit significant variation in membership over time, aggregate district-level membership moves little during the period we study (in line with the national trend). Hence our analysis focuses on between-district variation in unionization.Footnote 15
Union membership in House districts, 109th–112th Congress
Using LM forms provides important advantages over using measures derived from surveys. First, mandatory administrative filings are likely more reliable than population surveys, which often suffer from over-reporting and unit-nonresponse (Southworth and Stepan-Norris Reference Southworth and Stepan-Norris2009, 311). Second, they allow us to estimate union membership numbers for smaller geographical units, which are usually unavailable in population surveys or only covered with insufficient sample sizes. Another advantage for the study of politics is that the presence of union locales is observable to politicians even in the absence of survey data.
A potential drawback of using LM forms is that some public unions (those that exclusively represent state, county, or municipal government employees) are exempt from filing. However, any union that covers at least one private sector employee is required to file a report. In practice, this leads to almost complete coverage, because unions are now increasingly organizing workers across different sectors and occupations (Lichtenstein Reference Lichtenstein2013, 249).Footnote 16
Basic Empirical Models
Our basic empirical approach is to estimate a regression model that relates roll-call votes in the House of Representatives to roll-call-specific preferences of different income groups in each congressional district. The central innovation of this specification relative to the literature are interaction terms between district-level union membership and group preferences of low-income and high-income constituents. This enables us to assess whether unions moderate unequal legislative responsiveness. As a first approach to rule out alternative explanations, we allow for a rich set of state and district characteristics to moderate the link between legislative votes and group preferences. Later, we introduce an instrumental variable for union membership and a post-double selection model that makes less restrictive assumptions than the basic model.
Somewhat more formally, our dependent variable (represented by yijd
) indicates whether a legislator (i) from a congressional district (d) votes yes on a particular roll-call vote (j). For each roll-call vote and each congressional district, we have measured preferences of low-income Americans (
 $\operatorname{}{\theta}_{jd}^l $
) and high-income Americans (
 ${\theta}_{jd}^h\Big) $
. Union strength is measured by the (logged) membership of local unions in a district (Ud
). Depending on the particular specification (discussed in the next section), control variables (Xd
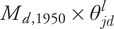
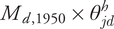
) include (1) socioeconomic district characteristics, (2) measures of historical state union policies and state fixed effects, (3) proxies for district-level social capital, (3) as well as non-linear transformations of these. For ease of interpretation, we have scaled all inputs to have mean zero and unit standard deviation (SD). Our model for the votes of House members is the following linear probability specification:
 $${\displaystyle \begin{array}{c}{y}_{ijd}={\mu}^l{\theta}_{jd}^l+{\mu}^h{\theta}_{jd}^h+{\eta}^l\left({U}_d\times {\theta}_{jd}^l\right)+{\eta}^h\left({U}_d\times {\theta}_{jd}^h\right)+\\ {}{\beta}^l\left({X}_d\times {\theta}_{jd}^l\right)+{\beta}^h\left({X}_d\times {\theta}_{jd}^h\right)+{\alpha}_d+{\epsilon}_{ijd}\end{array}} $$
In this model, the coefficients for the group-specific preferences (μl
and μh
) capture the change in the probability of legislators casting a supportive vote induced by a standard deviation change in the respective preferences of the poor and the affluent when union strength is at the mean. Key terms of interest are the interactions between union membership and the respective preferences of the poor and the affluent (
 ${U}_d\times {\theta}_{jd}^l $
and
 ${U}_d\times {\theta}_{jd}^h $
). The slope coefficient on the interaction between union membership and low-income preference (ηl
) captures the conditional effect of a SD change in logged union membership on the responsiveness of legislators’ votes to the preferences of the low-income constituents. The corresponding slope for the interaction between union membership and high-income preference is given by ηh. Our main theoretical expectation is that legislative votes become more responsive to low-income constituents as unions become stronger (ηl
> 0). Given the redistributive nature of many policy issues, we expect this to come at the expense of somewhat lower responsiveness to higher incomes (ηh
< 0).Footnote
17
The equation above highlights that all our control variables are also interacted with preferences (
 ${X}_d\times {\theta}_{jd}^l $
and
 ${X}_d\times {\theta}_{jd}^h $
). Note that the model also includes district fixed effects (αd
), which allow for systematic district-specific differences in interpretation of roll-call votes between legislators and constituents. They also provide for an additional defense against time-invariant omitted variables, though we note that the main threat to causal inference concerns the interaction terms.Footnote
18
The fixed effects model leverages within-district variation in income-based policy preferences as well as between-district variation in union strength as a moderator of preferences. Finally, the error term (ϵijd
) is assumed to be white noise independent of covariates. We calculate cluster-robust standard errors accounting for heteroscedasticity and arbitrary within-district correlations.
Results
Before presenting evidence on the moderating effect of unions, we want to give a sense of the overall picture of legislators’ responsiveness emerging from our data. Estimating a model of legislative voting as described earlier but without accounting for local union organization or any other moderators (i.e., setting all interaction terms to zero), we find a clear gap in the responsiveness of legislators to the preferences of low- versus high-income individuals. A SD increase in the preferences of individuals in the upper-third of the of income distribution is linked to an increase in the probability of legislators to cast a corresponding vote of 13.6 (±1.2) percentage points. In contrast, a SD increase in the preferences of those in the bottom-third induces a much smaller change in legislators’ behavior of 1.6 (±1.4) points. With a confidence interval ranging from −1.1 to 4.4, we cannot reject the null hypothesis that legislators do not respond to the preferences of low-income constituents in the average electoral district. The responsiveness gap between the two groups is sizable (11.9(±2.5) percentage points) and significantly different from zero. This is consistent with previous work on unequal representation in Congress (Bartels Reference Bartels2008, Reference Bartels2016; Ellis Reference Ellis2013).
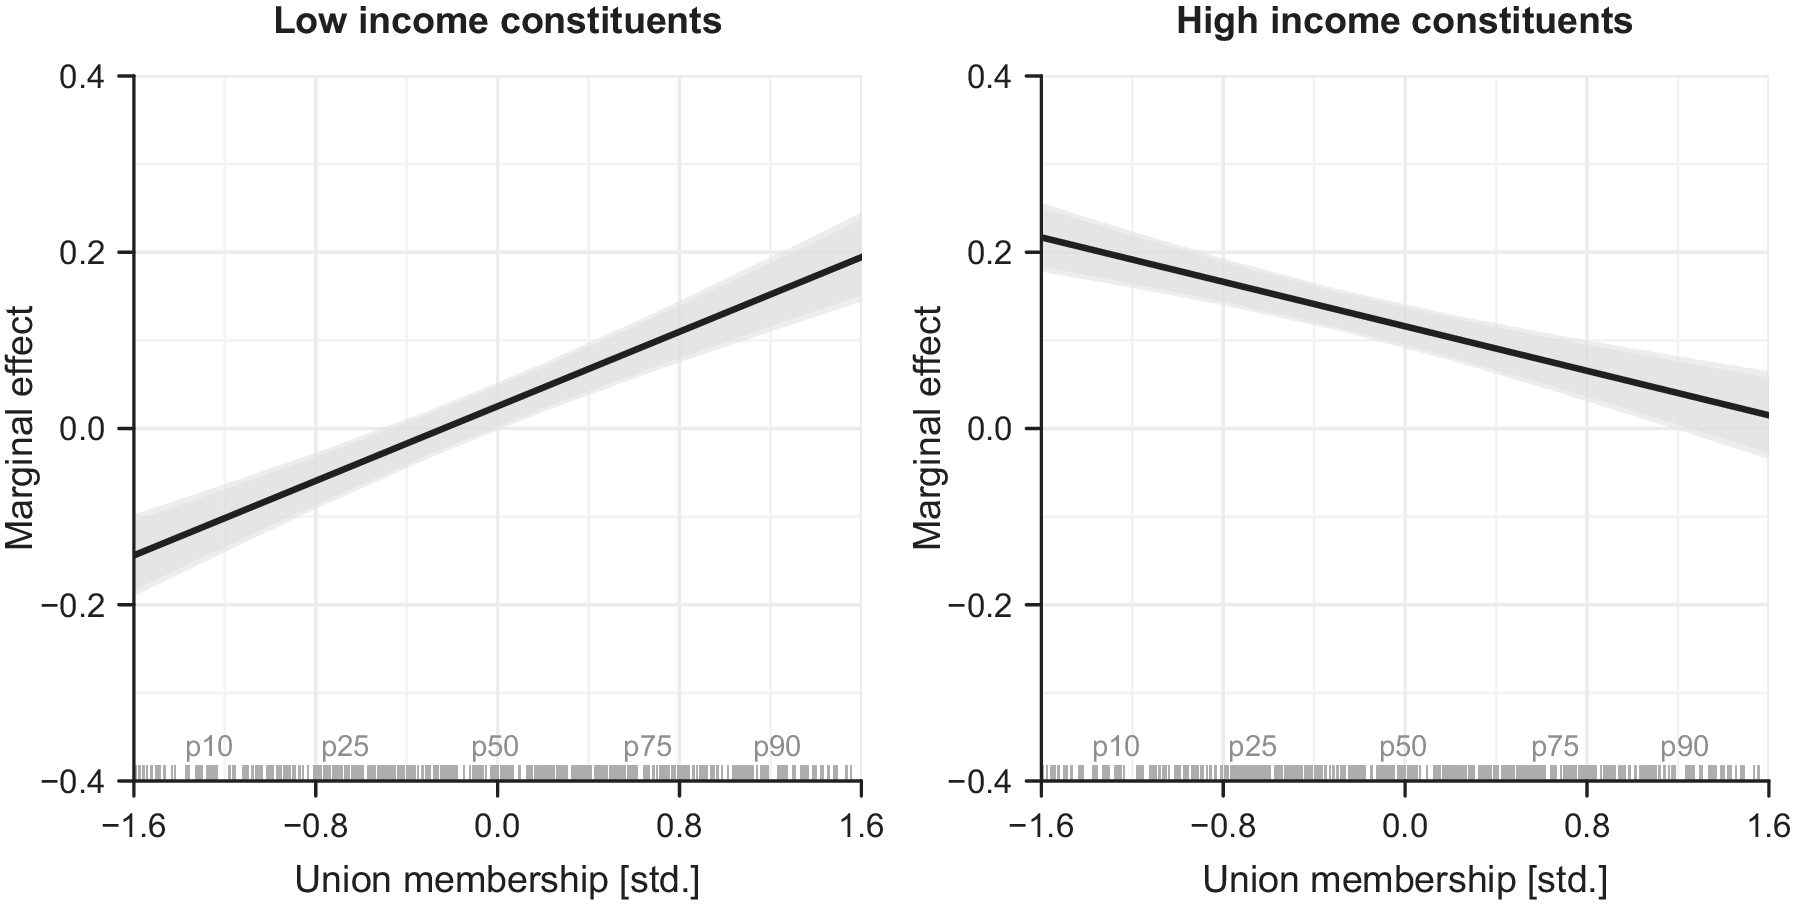
Turning to the effect of unions on legislative responsiveness, we start by summarizing our key finding graphically and then discuss more extensive model specifications. Figure 3 plots marginal effects of low- and high-income constituency preferences on representatives’ roll-call votes at varying levels of union membership with 95% confidence intervals.Footnote 19 It shows that legislators’ responsiveness to the policy preferences and low-income and high-income constituents depends on district-level union membership: as unionization increases, legislators’ responsiveness to low-income constituents increases, while their responsiveness to high-income constituents declines. For example, moving from a district with median levels of union membership to one at the seventy-fifth percentile increases the responsiveness of legislators to low-income preferences by eight percentage points, while it decreases responsiveness to high-income preferences by about five points.
District-level union membership as moderator of unequal representation
Note: This figure plots changes in marginal effects of low- and high-income constituency preferences on representatives’ roll-call votes conditional on district-level union membership. Shaded areas are 95% confidence intervals based on district-clustered standard errors. The sample distribution of (z-standardized) union membership is indicated above the x-axis.

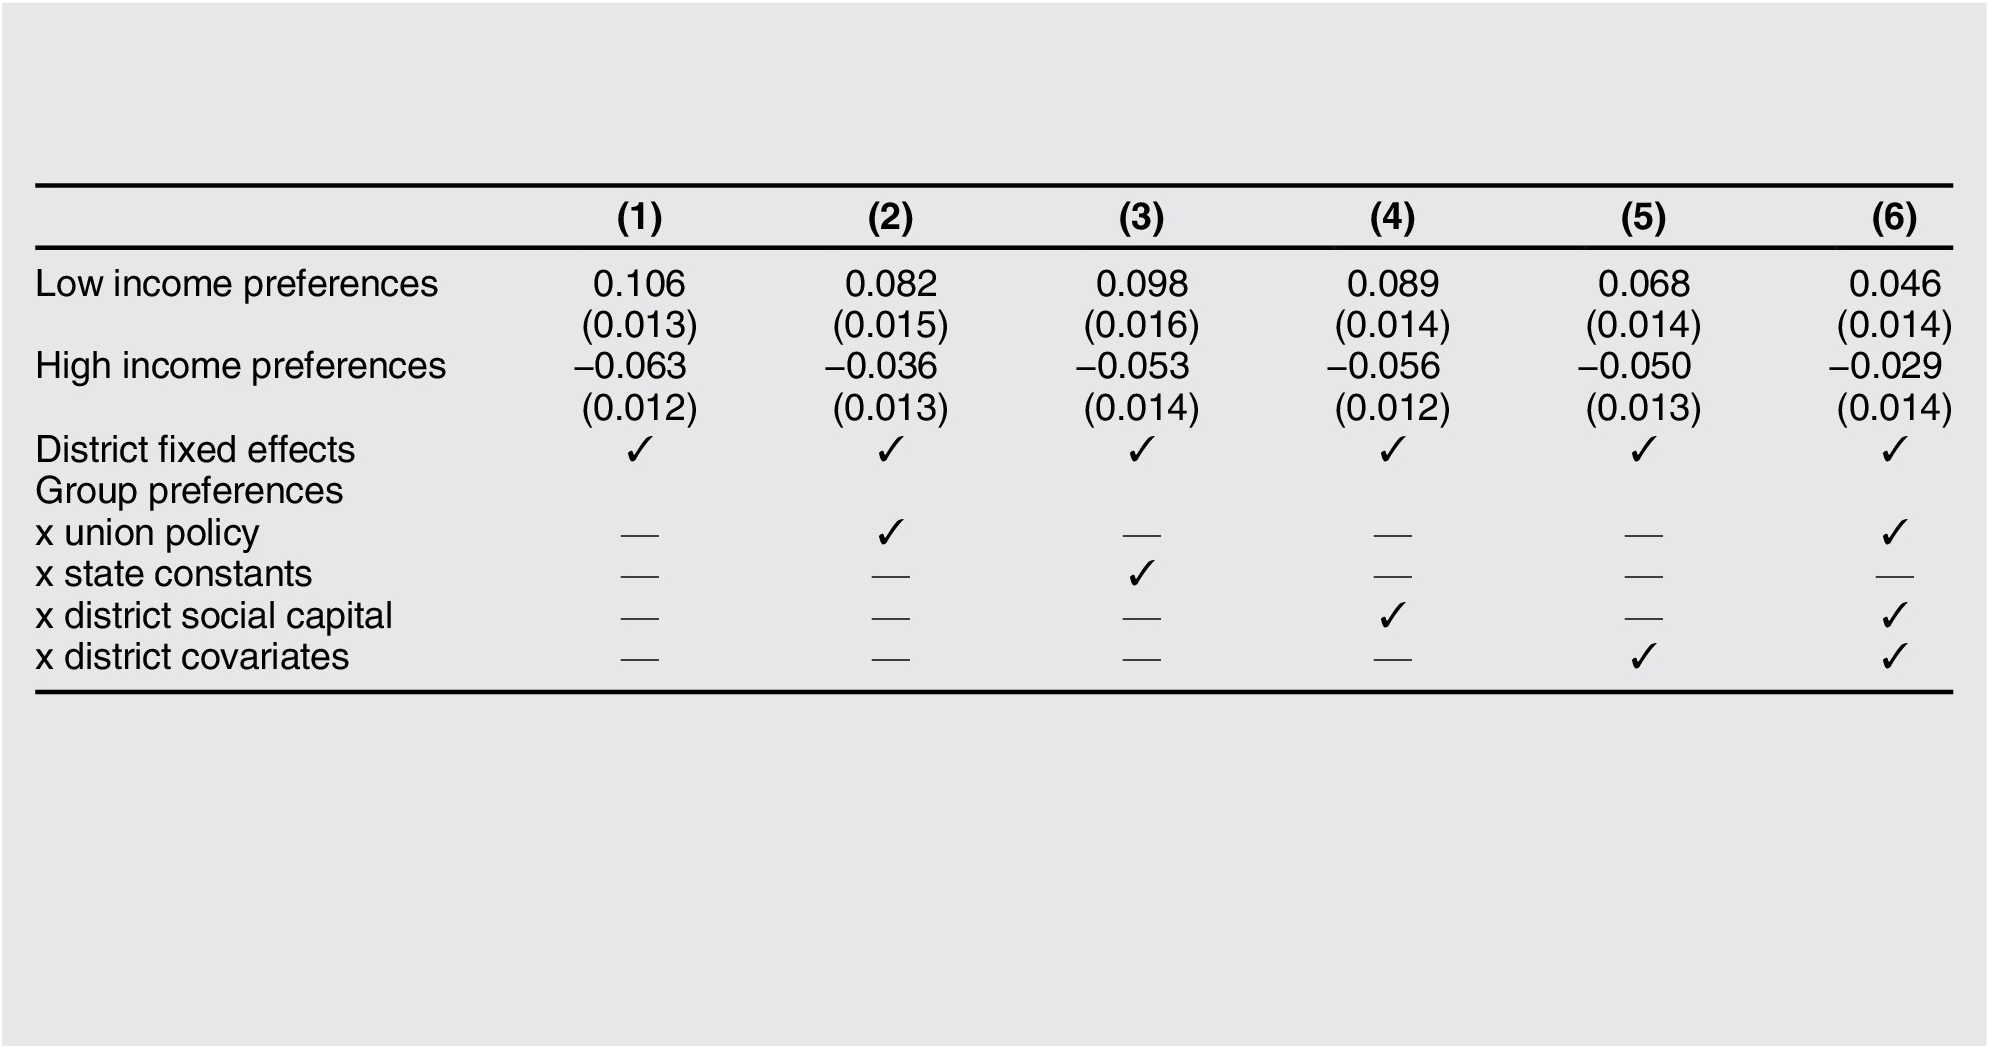
Are these findings robust to confounding factors? Table I presents parameter estimates from a number of increasingly rich specifications designed to capture potential confounds. In specification (1) we begin with a baseline model that includes district fixed effects but no further preferences-confounder interactions (setting βl and βh to zero). We find that a SD increase in district union membership increases legislators’ responsiveness to the poor by about 11 (±1) percentage points, while at the same time decreasing the advantage in responsiveness enjoyed by the affluent by about 6 (±1) points.
It would be premature to interpret these estimates as causal effects. Reflecting policy feedback (Ahlquist Reference Ahlquist2017), the moderating effect we have ascribed to unions may mostly reflect that state governments have chosen policies that strengthen or weaken the ability of unions to organize. While collective action problems dilute incentives of politicians to make politics using policies, in some circumstances they are overcome. Most relevant for unions are right-to-work and public sector bargaining laws (Anzia and Moe Reference Anzia and Moe2016; Feigenbaum, Hertel-Fernandez, and Williamson Reference Feigenbaum, Hertel-Fernandez and Williamson2018; Flavin and Hartney Reference Flavin and Hartney2015; Hacker and Pierson Reference Hacker and Pierson2010; Hertel-Fernandez Reference Hertel-Fernandez2018). In specification (2), we therefore add two measures of historical state union policy: the share of years with right-to-work legislation and the share of years with mandatory collective bargaining laws for teachers since 1955 taken from Flavin and Hartney (Reference Flavin and Hartney2015). These are interacted with preferences of low-income and high-income constituents. In specification (3) we go one step further and allow for any state-level characteristic (such as institutions or historically-rooted popular anti-union sentiments) to moderate the marginal effect of preferences on legislators’ vote choice by including state-specific constants interacted with group preferences. Results from both extended specifications show that accounting for state-level policies and institutions as potential moderators does not change our core picture of the role of local union organization: where local unions are stronger the responsiveness gap between the affluent and the poor is reduced.
A more subtle problem concerns a form of simultaneity bias at the district level. There may be district-level factors shaping both the propensity to be a union member and to be politically active. If less-affluent individuals with a higher capacity to organize and solve collective action problems cluster in specific districts, our estimates of the marginal impact of district union membership on responsiveness will be overly optimistic. Such a propensity may reflect critical historical junctures in labor organizations (Ahlquist and Levy Reference Ahlquist and Levy2013) or social capital (Putnam Reference Putnam1993). As a first cut to address this problem using control variables, we add proxies tapping into social capital. We use the number of bowling alleys as a proxy (Rupasingha and Goetz Reference Rupasingha and Goetz2008). These measures are available at the county level and are spatially reweighted to congressional districts. Again, our results are substantively unchanged. Using alternative proxies yields the same result (refer to online appendix E).
In specification (5) we measure a large number of district socio-economic characteristics and allow them to interact with constituency preferences: population size, race (share of African Americans and Hispanics), education (share with BA or higher), the share of the working population employed in manufacturing, median household income, and the degree of urbanization (for descriptive statistics, refer to table A.3). This set of covariates excludes obviously “bad controls” such as partisanship or campaign contributions that are a mechanism through which unions influence representation. Again, our results point towards the existence of a clear moderating effect of unions. Our final specification, column (6) of table 1, includes all previous covariates and, again, confirms our core finding.Footnote 20
Effect of union membership on legislators’ responsiveness to preferences of rich and poor constituents

Note: Entries are parameter estimates of interaction terms between roll-call specific preferences of low-income constituents and district union membership (ηl ) as well as between high-income constituents and district union membership (ηh ) from a linear probability model. District-clustered standard errors in parentheses. Estimates are all significant at a 5% test level. N=15,780. Nd = 435. 37 matched roll-call votes, 109th to 112th Congress. Specifications (2) to (5) include additional interactions between income group preferences with state- or district-level confounders. Specification (2) includes two measures of historical state union policymaking, the share of years with right-to-work legislation and collective bargaining agreements. (3) interacts preferences with state fixed effects. (4) includes as a measure of social capital the number of bowling alleys (Rupasingha and Goetz Reference Rupasingha and Goetz2008). (5) includes a large set of district-level characteristics (population size, degree of urbanization, shares of female, Black, Hispanic, BA degrees, employed in manufacturing, as well as median household income). (6) includes all of these except state constants.
Assessing Threats to Inference
To strengthen the causal interpretation of our results, we now move beyond adjusting for available control variables in a linear fashion. We instrument contemporary unionization by exploiting the history and geography of the post-war labor movement in the United States. As proposed by Becher and Stegmueller (Reference Becher and Stegmueller2019), the basic idea is to leverage the history of spillovers from unionization in a few capital-intensive industries, whose location was mainly determined by geographical factors, such as natural endowments, as opposed to local tastes or institutions that also drive political representation.
Economic historians have noted that in the early 1950s coal and metal mines as well as steel plants were fully unionized across the country, irrespective of local political leanings (Holmes Reference Holmes2006, 2). In the relatively pro-labor environment of the time, including a National Labor Relations Board staffed by appointees of successive Democratic administrations, extractive industries were easy targets for unionization due to their capital intensity, high sunk costs, and difficult working conditions. Thus, they were unionized even in the otherwise much more anti-union South. Importantly, the location of mining and even steel production is largely determined by nature, whether due to the availability of coal deposits in the ground or the access to raw materials for steel mills.
Over time, positive spillovers from unionized mining and steel industries induced high levels of union membership across industries. Unions used their resources to organize new establishments, and workers (or members of their social network) switching industries brought with them tastes and skills for unionization. Holmes (Reference Holmes2006) documents a positive relationship between the unionization of establishments (in health care and wholesale) in the 1990s and their proximity to mining and metal industries in the 1950s. The combination of geographic location of these industries being largely shaped by nature and strong spillovers implies that part of the variation in union membership in congressional districts at the beginning of the twenty-first century is exogenous to district-level omitted variables conditional on the intensity of mining and steel employment in the middle of the twentieth century.
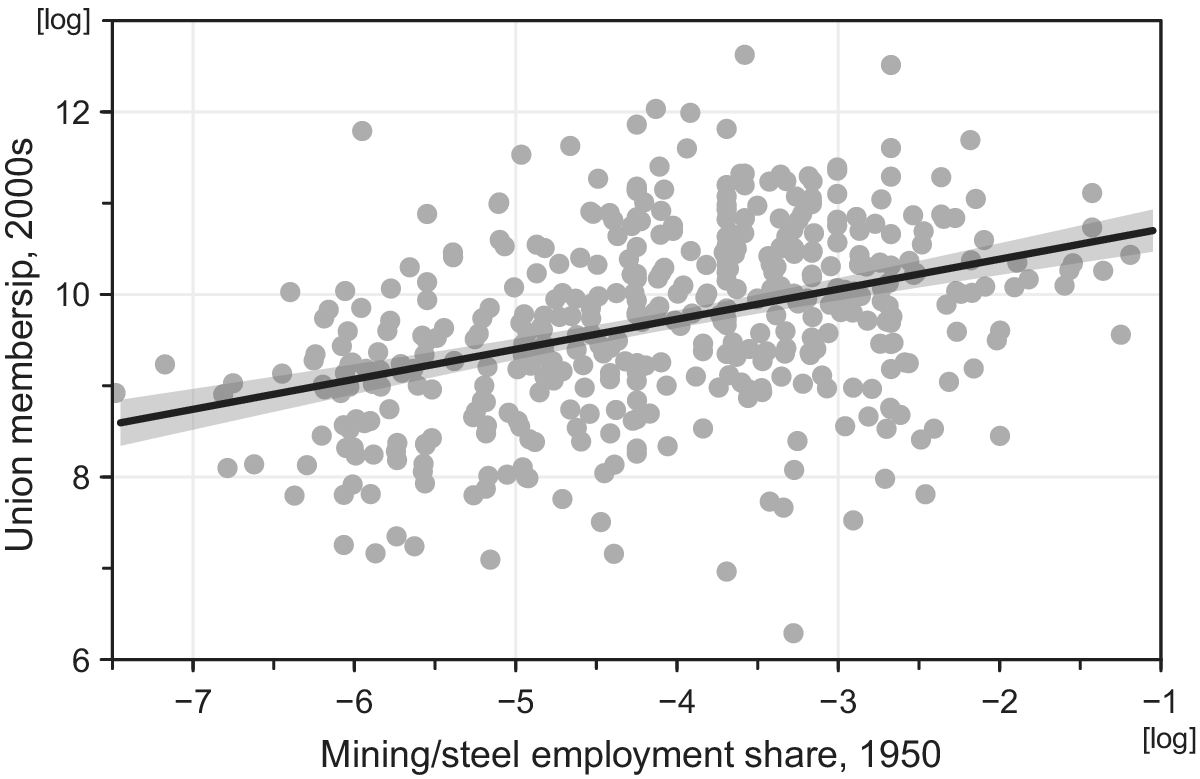
We thus construct our instrument for current levels of union membership from data on district-level employment shares in mining and steel industries in the 1950s. We calculate the latter from 1950 Census samples spatially interpolated to current congressional districts.Footnote 21 Figure 4 illustrates that historical mining employment is strongly related to contemporary levels of union membership. It plots logged district-level employment in mining and steel industries (as share of the working population) in 1950 against logged district-level union membership in the 109th Congress. A simple linear model with state and congress fixed effects shows that a 1% increase in the instrument induces a 0.21% (±0.01) increase in the district-level share of union members. State fixed effects capture variation in pro-business orientation of a state in the 1950s, which may shape the intensity of mining or the location of steel industries.
Instrumenting union density with post-war mining/steel industry employment
Note: This figure plots logged district-level employment in mining and steel industries (as share of working population) in 1950 against logged contemporary district-level union density. Linear fit with robust 95% confidence interval superimposed.

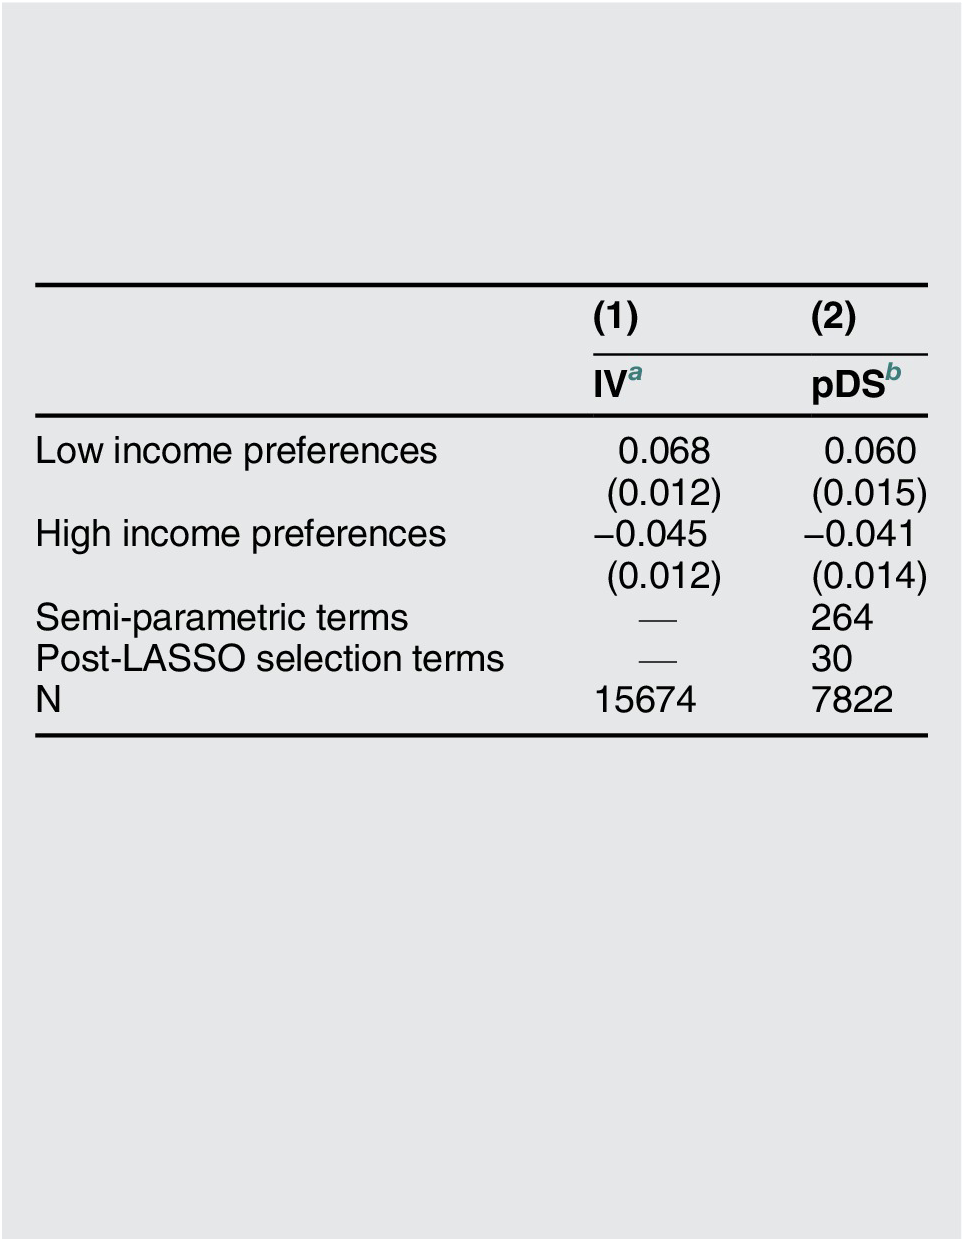
Column (1) of table 2 shows IV estimates for the effect of union strength on the link between preferences and legislative voting.Footnote 22 It suggests that a SD increase in unionization increases legislators’ responsiveness to the bottom-third by about 7 (±1) percentage points and decreases responsiveness to the upper third by about 4.5 (±1) points. Our IV estimate lies within the set of estimates reported in table 1. Its magnitude is in line with the richer specifications reported there (cf. columns 4 and 5). These results considerably strengthen the causal interpretation of our findings.
Probing the causal effect of union strength on legislators’ responsiveness (instrumental variable and post-double-selection estimates)
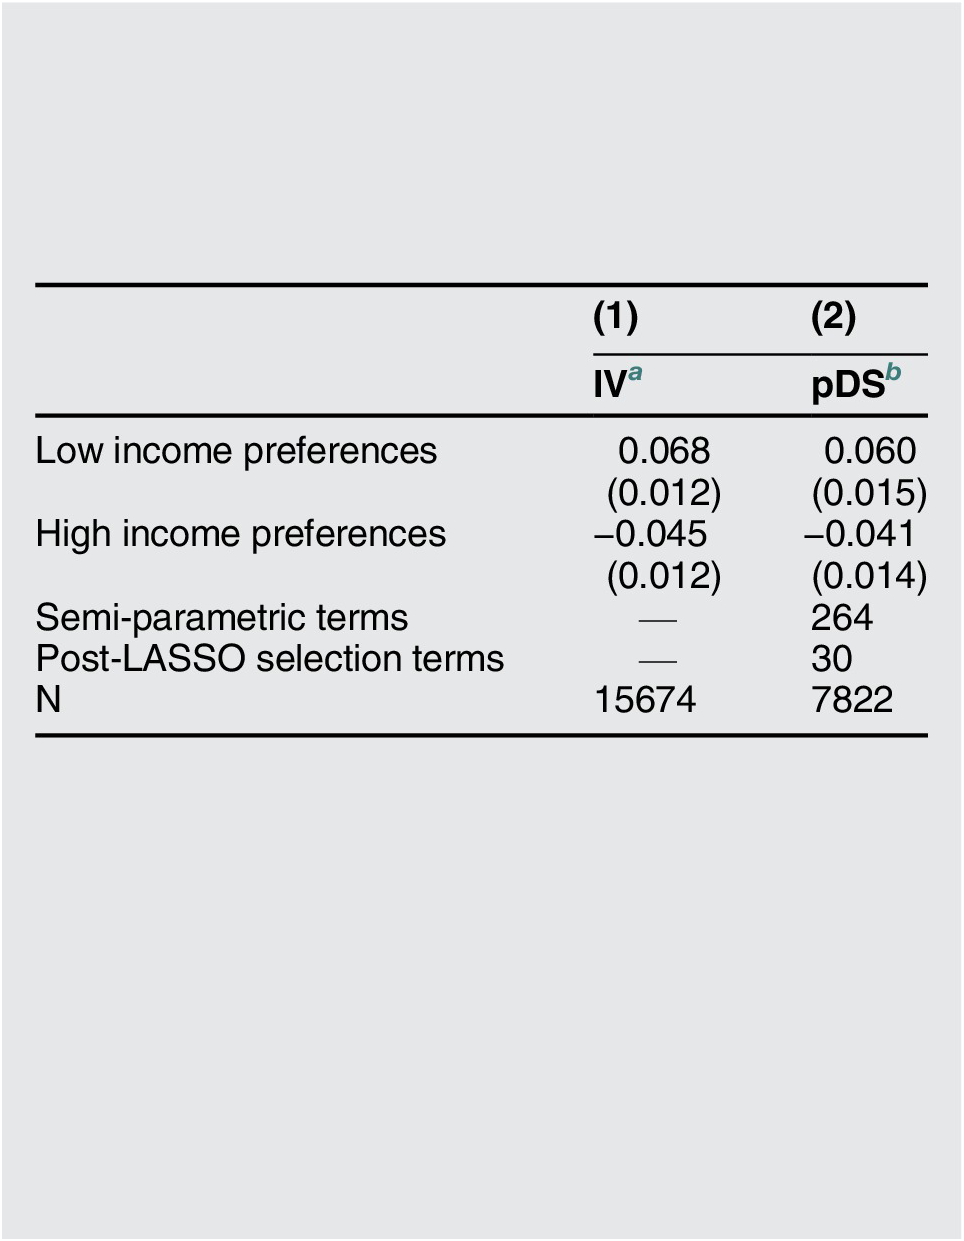
Note: Entries are estimates of interactions between low-income preferences and union membership (ηl ) as well as between high-income preferences and union membership (ηh ). Clustered robust standard errors in parentheses. Estimates are all significant at a 5% test level.
a Instrumental variable (2SLS) estimates. Union density instrumented with district mining employment share in 1950. Robust first-stage (Kleibergen-Paap) statistic: F = 644.9.
b Post-double-selection estimates. Refer to online appendix F for details. N=7,822 (50% validation sample, first half used for LASSO selection). It includes union policy, social capital, and district characteristics and all their pairwise interactions in linear and quadratic form.
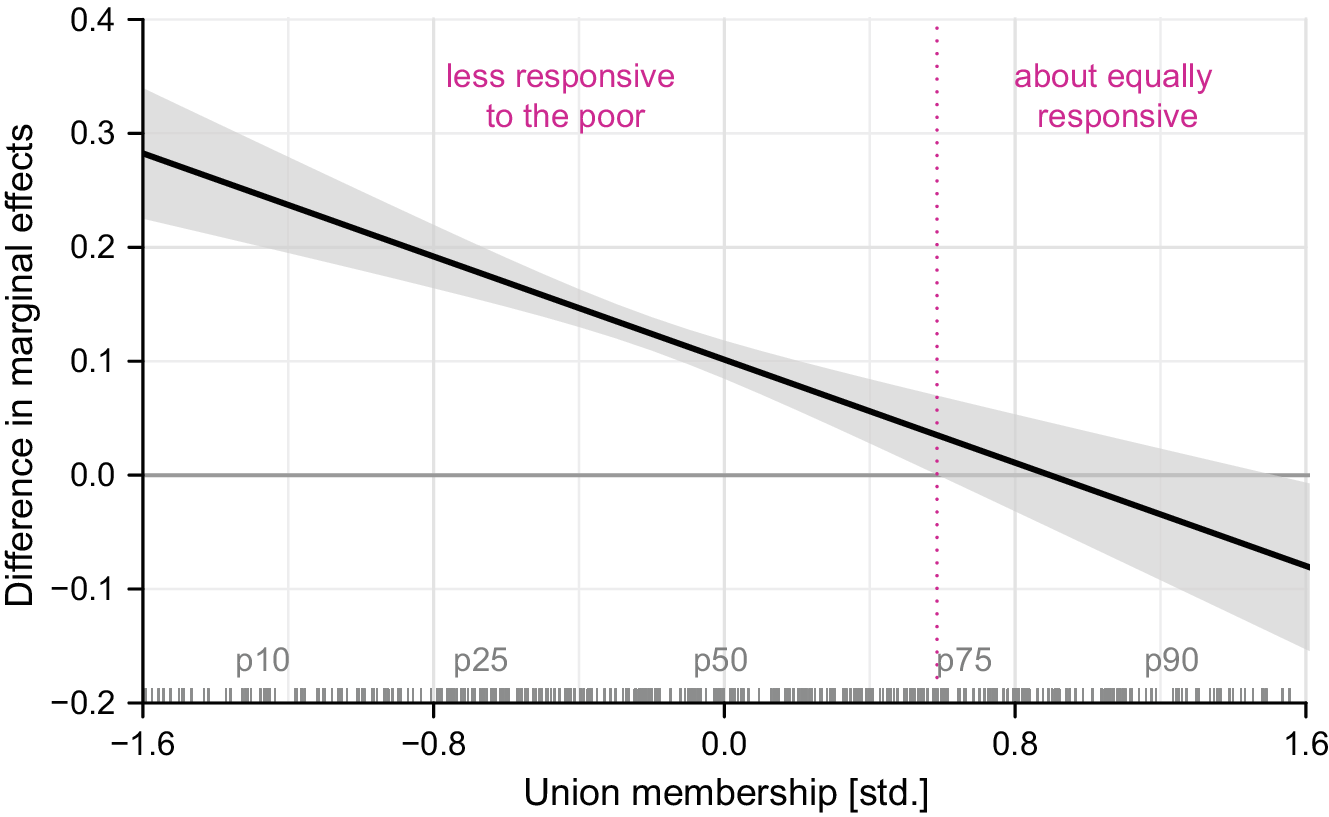
Our results imply that unions enhance political equality in Congress. Based on our IV estimates, figure 5 illustrates graphically how the gap in the legislative responsiveness to preferences of high-income and low-income constituents varies with district union membership. It plots estimated differences in marginal effects for low- and high-income constituents at varying levels of union strength with corresponding 95% confidence intervals. Figure 5 shows that the gap in responsiveness declines as district union membership increases. With weak or moderately strong unions, we recover the well-known picture of legislators’ biased responsiveness towards the better-off. However, where unions are comparatively strong (more or less above the seventy-fifth percentile) legislators are about equally responsive to different income groups.
District union strength and the gap in legislative responsiveness
Note: This figure show the moderating impact of union membership on the gap between the responsiveness of legislators to preferences low high-income and low-income constituents. Difference in low- versus high-income responsiveness estimates from the instrumental variable model in table 2 with 95% confidence interval.

As in any instrumental variable analysis, we have to make an unverifiable exclusion restriction. It is violated if legacies of mining and steel in the 1950s have a direct effect on the equality of representation in Congress today beyond union strength (e.g., through the formation of other organizations). We think this is a plausible approximation. Today, neither mining nor steel are uniformly unionized, and over more than half a century of migration has changed the makeup of many parts of the country.Footnote 23 Our confidence in the IV result is strengthened by its concordance to using other approaches. This includes regressions adjusting for several possible other channels, such as district-level social capital, churches, and state fixed effects (see tables 1 and E.1).
A third approach to address the problem of union endogeneity is to use the post-double-selection estimator recently developed in econometrics (Belloni, Chernozhukov, and Hansen Reference Belloni, Chernozhukov and Hansen2014). It makes different assumptions than the IV approach and thus ensures that our causal interpretation does not solely rely on the validity of a particular set of assumptions. This approach addresses the problem that there are many potential covariates (including non-linear transformations and interactions between them) and it is difficult to know a priori which combination to include to minimize omitted variable bias. Intuitively, this approach includes relevant variables from a high-dimensional vector of possible controls (relaxing the linearity restrictions usually imposed in regression models), that are either relevant predictors of legislative voting or relevant predictors of the interaction of union membership and group-preferences (for more details refer to online appendix F). Reassuringly, column (2) of table 2 shows that the estimates from this approach are very similar to those from the IV model. Finally, we also investigated if our findings depend on the linear functional form imposed on the union-preference interaction terms (available in online appendix G).
Exploring Mechanisms
In this final empirical section, we explore two closely related mechanisms of union influence: campaign contributions and partisan selection. If contributions are a channel of union influence, we expect to observe that (1) in districts where local unions are stronger, unions and their members contribute more to sitting members of Congress; and (2) that these contributions are positively linked to legislative responsiveness. Our argument emphasized the ability of unions to shape electoral selection and incentives through their mobilization potential. Campaign contributions, which contribute to candidates’ war chest, are a proxy for unions’ credible mobilization threat. We think that contributions are better suited than turnout to capture this logic. While turnout is of course an important mechanism (e.g., Bartels Reference Bartels2008; Franko, Kelly, and Witko Reference Franko, Kelly and Witko2016; Gilens Reference Gilens2012; Leighley and Oser Reference Leighley and Oser2018), we argue that observed turnout is not the most appropriate measure given our argument. High mobilization potential need not translate into high turnout if competitive challengers do not enter the race. Realized turnout would thus understate the relevance of the mobilization channel.
If partisan selection is a relevant channel, (1) district-level union strength should have a positive impact on electing Democratic legislators, (2) who in turn are more likely to vote in line with low-income preferences.
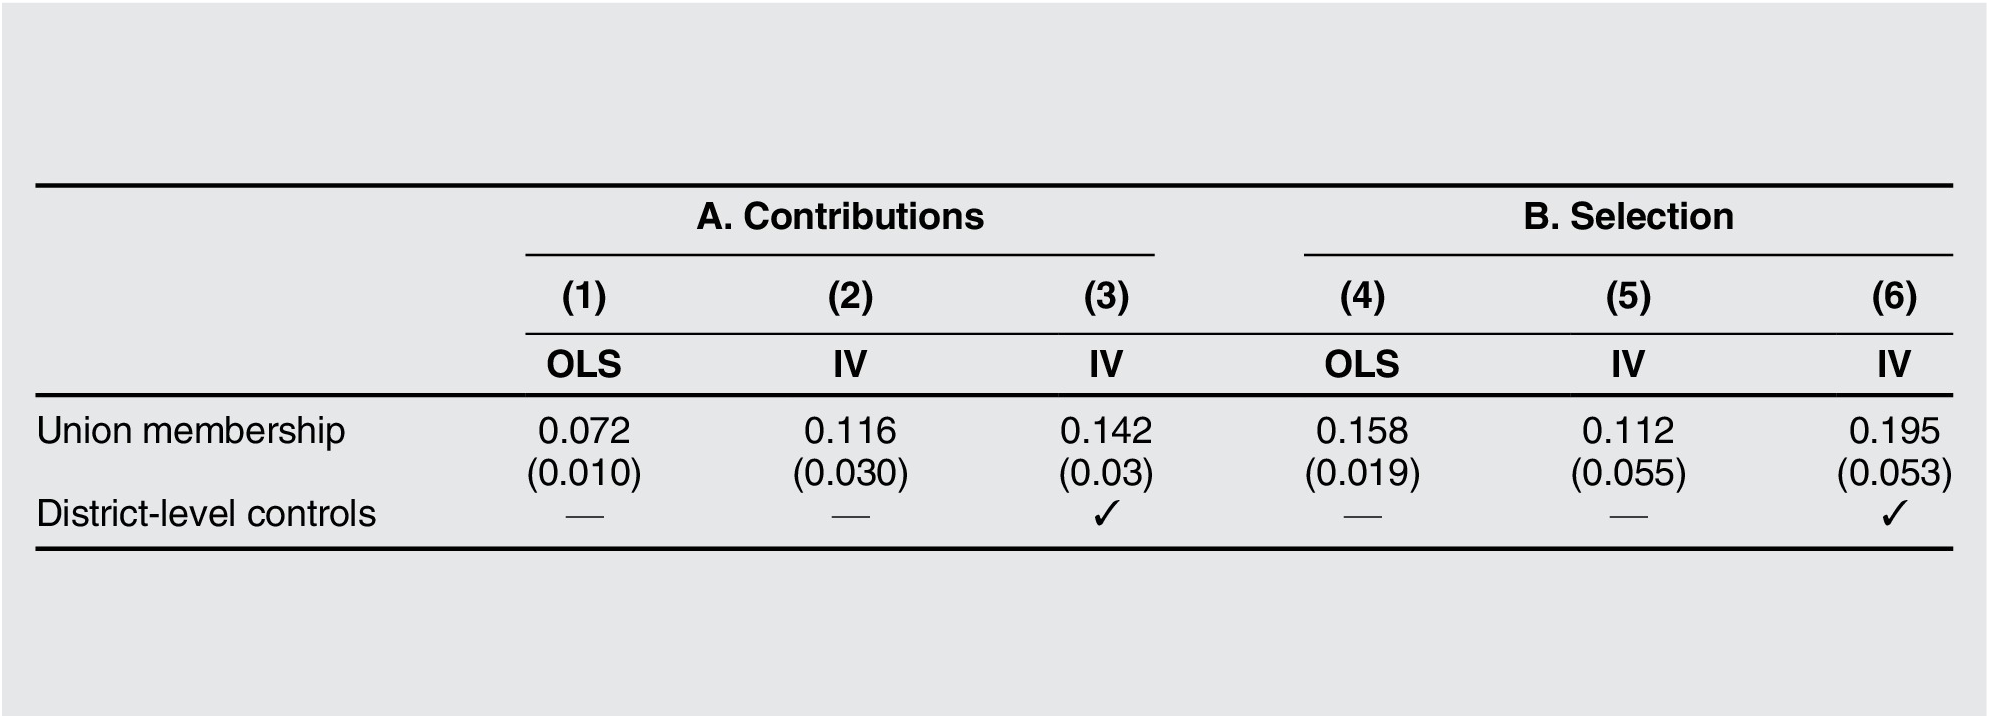
First, we analyze the impact of union membership on the amount of (logged) labor contributions and selection of Democratic legislators. Our measure of contributions is calculated from raw campaign finance contributions reported to the Federal Election Commission and collected by the Center for Responsive Politics. We aggregate candidate contributions from the “labor” sector (excluding single-issue donations). Our count includes both individuals and PACs (but using either alone does not change our results). To guard against omitted variables, we apply the instrumental variable strategy described earlier. Table 3 shows resulting estimates. In columns (1)–(3), we find that in OLS and IV specifications (with and without district controls) an increase in union membership systematically increases the amount of contributions from labor in that district. Consistent with some degree of endogeneity the IV estimate is about twice as large as the OLS one. According to model (2), a SD increase in union membership increases contributions from Labor by about $178,500. Turning to partisan selection, columns (4)–(6) clearly show that higher union membership entails a higher probability of a Democratic candidate being elected.
Exploring mechanisms, first step: The impact of union membership on the amount of labor contributions and selection of Democratic legislators
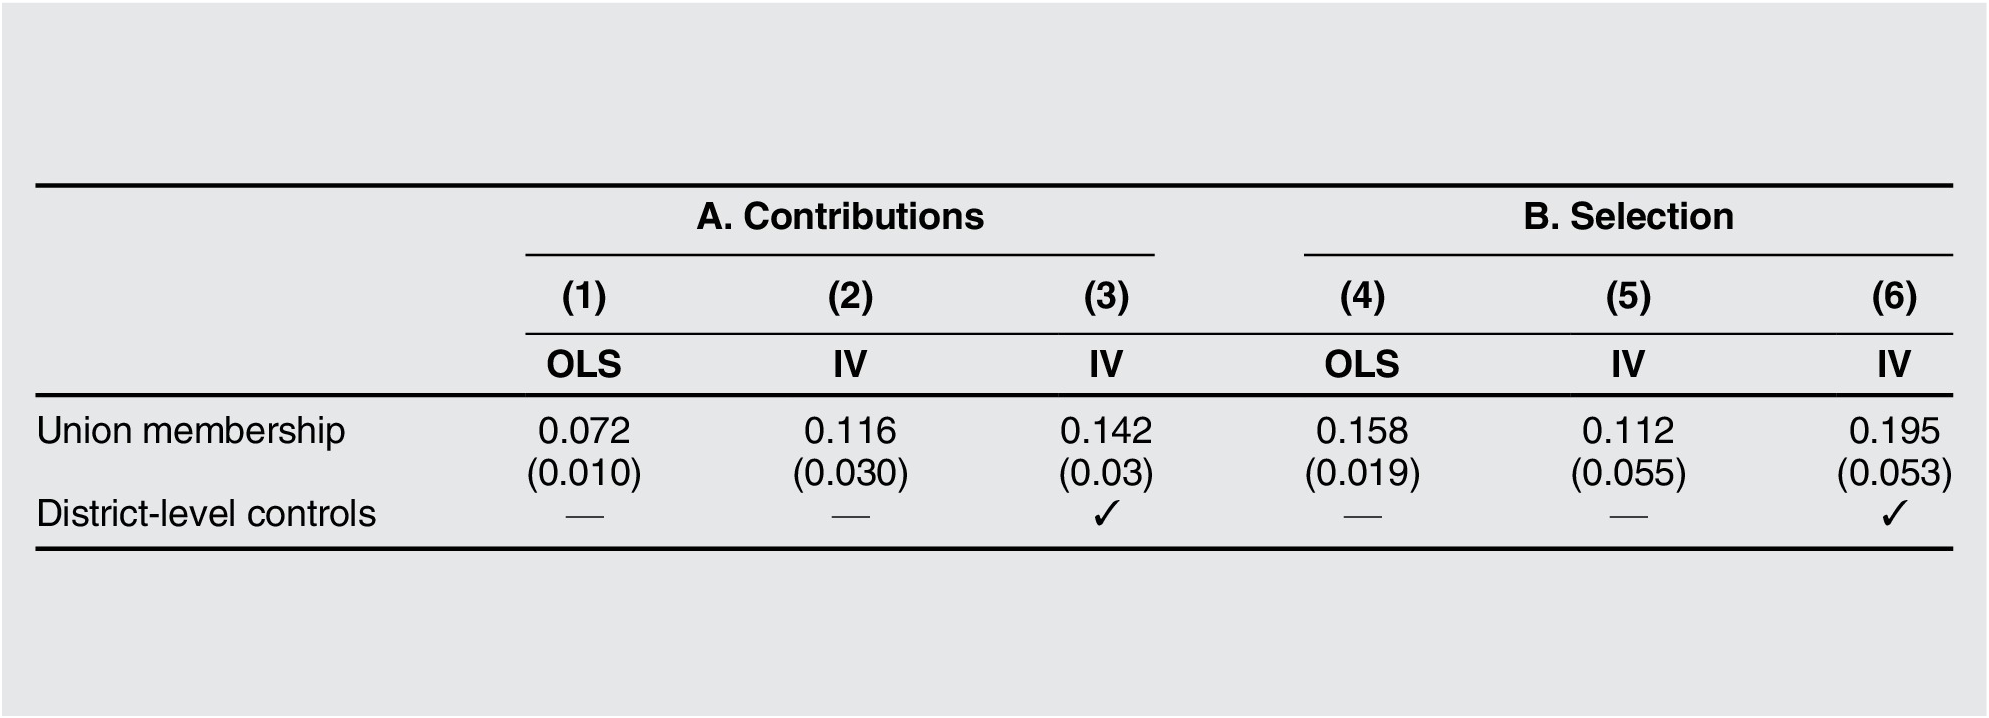
Note: Estimates from district-level regression of (log) labor contributions on (log) union membership (panel A) and presence of Democratic representative on (log) union membership (panel B). Robust standard errors in parentheses. Estimates are all significant at a 5% test level. IV columns instrument union membership with district mining employment share in 1950. The Kleibergen-Paap robust first-stage F statistic is 88.9 and 83.2 for specifications without and with district controls, respectively.
Second, we analyze the link between campaign contributions and unequal responsiveness and between partisanship and unequal responsiveness. Results are shown in two panels in table 4. We estimate linear probability models regressing roll-call votes on the interaction between district preferences and contributions (panel A) and an indicator for a Democratic representative (panel B). We also include district fixed effects, and, in column (2), district controls interacted with preferences. We find that in districts where labor contributions are higher, legislators’ responsiveness to preferences of low-income constituents is significantly higher. Consistent with previous research (Bartels Reference Bartels2016; Rhodes and Schaffner Reference Rhodes and Schaffner2017), the selection of Democratic legislators is also associated with higher responsiveness to the preferences of low-income constituents compared to their Republican counterparts.
Exploring mechanisms, second step: Roll-call votes as function of preferences moderated by labor contributions and Democratic legislators
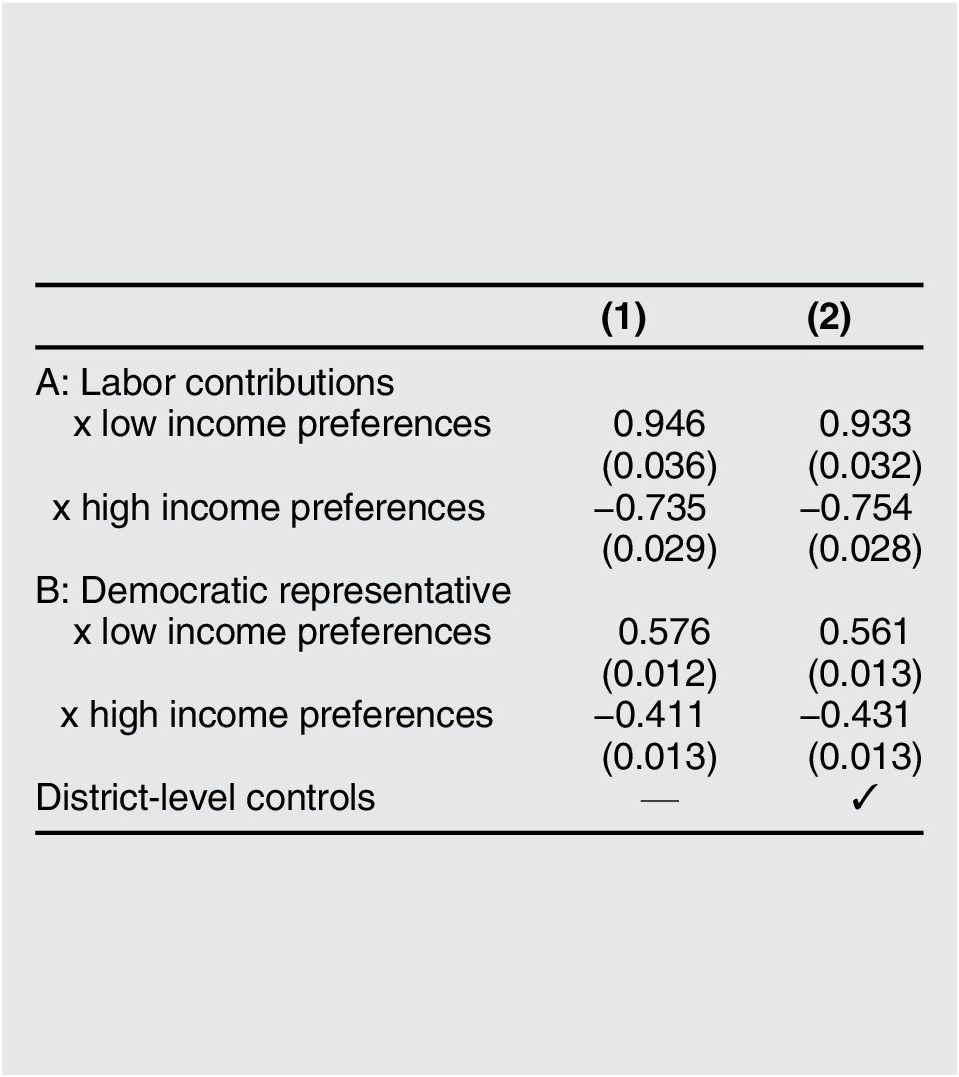
Note: Entries are OLS coefficients from linear model of legislators’ vote as function of interaction between district preferences and (log) labor contributions (panel A) and Democratic representative (panel B). Column (2) adds district-level controls interacted with preferences. Robust standard errors are in parentheses.
In sum, the pro-poor impact of unions rests in part on their ability to mobilize campaign contributions and to get Democratic candidates elected. These results are consistent with arguments based on mobilization threats and rational politicians. They suggest that local union strength underpins a credible threat of mobilization that shapes political equality through political selection and post-electoral incentives. The importance of electoral selection is in line with a larger body of research on elections and representation (Bartels Reference Bartels2016; Lee, Moretti, and Butler Reference Lee, Moretti and Butler2004; Miller and Stokes Reference Miller and Stokes1963).
Analyzing the heterogeneity of the impact of unions also sheds light on the mechanisms (refer to online appendix H). We find that our results do not vary much by the type of the union (public or private) or whether the vote concerns a liberal or conservative position. However, the impact of union membership on legislators’ responsiveness to low-income preferences is significantly larger for roll-call votes on which the AFL–CIO has taken a prior position, which mainly includes salient economic and redistributive issues. This bolsters our interpretation that the egalitarian effect of unions is driven by their capacity for political action.
Discussion and Conclusion
Dahl (Reference Dahl1961) famously asked: who governs in a polity where political rights are equally distributed, but where large inequalities in income and wealth may bias representation? In the wake of rising income inequality in the United States, scholars have identified the question of political inequality as one of the central challenges facing democracy in the twenty-first century (APSA 2004). While the scientific debate is far from over, numerous studies have documented striking patterns of unequal responsiveness by income. When policy preferences diverge across income groups, legislators are biased toward the affluent at the expense of the middle-class and⸺especially⸺the poor. Many recent works conclude by asking what factors may improve political representation of the economically disadvantaged.
We have analyzed whether labor unions can serve as an effective collective voice institution limiting unequal representation in Congress. Going beyond existing work on this topic, we developed a research design to account for the fact that union strength is endogenous to politics and that existing survey data may not be representative of the district population. Against the view that unions are not a relevant causal force for political equality, we find that they systematically shape unequal representation: increasing district-level union strength decreases representation bias.Footnote 24 Thus, while legislators are on average more responsive to preferences of the rich than to preferences of the poor, this representation gap varies considerably. It is much smaller in districts where union membership is higher.
Empirically, our analysis has focused on legislative voting. Analytically, the logic of influence working through electoral mobilization and political selection supported by our findings applies to political representation in Congress more generally. There is evidence that contributions from unions are associated with legislators paying more attention to issues prioritized by lower- and middle-income groups (Kelly et al. Reference Kelly, Morgan, Witko and Enns2019). Going beyond Congress, an important scope condition is that unions competing for influence in local elections (e.g., for school boards) may be more likely to represent narrow interests rather than providing a collective voice to the disadvantaged who are not union members (Anzia Reference Anzia2011; Moe Reference Moe2009).
Our findings cast a somewhat less pessimistic light on democratic representation in Congress than the existing representation literature. Despite high income inequality, polarization, expensive campaigns, and a legislature dominated by affluent politicians, they suggest that legislative underrepresentation of the poor is not an unavoidable feature of American democracy. This is not to argue that there is a simple recipe to increase political equality in Congress via changing union membership. Union membership in the United States has varied markedly over time and across sectors. Research suggests that there is no single smoking gun that accounts for the ebb and flow of unionization. Neither prime suspect⸺economic globalization and deindustrialization⸺is associated with declining unions everywhere (Schnabel Reference Schnabel2013; Wallerstein and Western Reference Wallerstein and Western2000). However, the regulatory environment matters. For instance, recent changes to state-level laws concerning union fees in the private sector or public sector collective bargaining rights are believed by the involved actors to have predictable effects. Recent research leveraging reforms across state borders supports this view (Feigenbaum, Hertel-Fernandez, and Williamson Reference Feigenbaum, Hertel-Fernandez and Williamson2018). Similarly, the appointment of bureaucrats to the National Labor Relations Board is consequential for the implementation and interpretation of labor law. Major candidates in the Democratic primaries for the 2020 presidential election proposed numerous reforms to encourage unionization and collective bargaining. At a minimum, they all support the “Protecting the Right to Organize Act of 2019.” It includes higher penalties for companies who illegally interfere with worker’s organization efforts and revises the definition of “employee” and “supervisor” to prevent employers from exempting employees from labor law protections by definitional fiat. Of course, laws and appointments are made in a political process influenced by socio-economic inequalities; and they are partisan. But in principle they are amenable to change through elections. The demand for union membership among (non-unionized) American workers is relatively high.Footnote 25 The increase in industrial concentration over the last decades may ultimately facilitate union mobilization even in the absence of regulatory action because it entails relatively lower mobilization cost and higher benefits based on firm profits (Hirsch and Berger Reference Hirsch and Berger1984).
Supplemental Materials
A. Data B. Estimation of District Preferences 1. Small Area Estimation via Chained Random Forests 2. Multilevel Regression and Poststratification 3. Model Results under Various Preferences Estimation Strategies C. Alternative Income Thresholds D. Measures of District Organizational Capacity E. Additional Robustness Tests F. Post Double Selection Estimator G. Nonparametric Evidence for Union Preferences Interaction H. Heterogeneity
To view supplementary material for this article, please visit http://dx.doi.org/10.1017/S153759272000208X.