Continued demand for device and system miniaturization motivates a continued interest in micro-forming technologies for manufacturing metal parts with sub-mm characteristic dimensions in the last two decades.[Reference Geiger, Kleiner, Eckstein, Tiesler and Engel1, Reference Fu and Chan2] Metal parts with characteristic dimensions of hundreds of microns and larger, such as springs, screws, and pins, have been fabricated through metal forming operations appropriately scaled down from macroscale designs.[Reference Geiger, Kleiner, Eckstein, Tiesler and Engel1, Reference Fu and Chan2] Metal parts with micron/sub-micron characteristic dimensions have been fabricated with lithography-based fabrication protocols rooted in Si very-large-scale-integrated circuit technologies.[Reference Zabow, Koretsky and Moreland3] Such micron/sub-micron metal parts with shape anisotropy and consequent magnetic anisotropy were shown to offer advantages, for instance, as contrast enhancement agents in magnetic resonance imaging.[Reference Zabow, Dodd, Moreland and Koretsky4] It is thus of interest to push metal forming technologies from >100 µm in characteristic dimension to the ~10 and ~1 µm scales.
The mechanical behavior of metals at the sub-mm to μm scales is an important consideration for forming process design and implementation. Over the past two decades, various measurements of the flow stress of metals have been performed on specimens with characteristic external sizes ranging from ~1000 to ~1 µm and below, and strong size effects on the strengths of materials have been observed. For moderately large sample sizes, i.e., in the ~100 to ~10 µm range, size effects have been observed and associated with strain gradients imposed by deformation geometry, such as in torsion of thin wires[Reference Fleck, Muller, Ashby and Hutchinson5] and bending of thin foils.[Reference Stölken and Evans6] In wire torsion and foil bending, it was shown that materials increasingly strengthen as the characteristic specimen dimension decreases,[Reference Fleck, Muller, Ashby and Hutchinson5, Reference Stölken and Evans6] due to increase in imposed strain gradients. In the absence of strain gradients, size effects have also been observed in samples with smaller sizes. At diameters ranging from ~40 µm down to ~0.2 µm, axial compression of single crystal cylindrical pillar specimens showed a pronounced increase in their flow stress as the diameter decreases.[Reference Uchic, Dimiduk, Florando and Nix7, Reference Uchic, Shade and Dimiduk8] Such increase in strength has been attributed to a dislocation starvation mechanism, where the nucleation, subsequent propagation, and escape of dislocations carry a dominant influence on plastic deformation.
In contrast to the above two examples of “smaller is stronger”, when poly-crystalline cylinders with diameters ranging from ~3000 µm down to ~500 µm were tested under uniaxial compression, the flow stress was reported to decrease with decreasing cylinder diameter with the grain size held constant.[Reference Geiger, Kleiner, Eckstein, Tiesler and Engel1, Reference Fu and Chan2, Reference Engel and Eckstein9] In the mesoscopic range of characteristic dimensions between ~400 and ~20 µm, data sets on the mechanical response of materials are scarce in the current literature. Further, mechanical response of materials obtained from simple testing geometries with free external specimen surfaces, such as uniaxial compression of free-standing cylinders, may be significantly different from their behavior during actual micro-forming operations, in which almost all external surfaces of the material being formed are in contact with the forming tool and are subjected to significant external constraints.[Reference Chan, Fu and Lu10] Obtaining reliable uniaxial compression response of materials in this meso-range of characteristic specimen dimensions is thus of interest because: first, data obtained may elucidate mechanisms responsible for the transition from a “smaller is weaker” to a “smaller is stronger” behavior; second, knowledge gained from such simple tests with free external surfaces can offer a baseline for better delineation of the importance of external constraints for materials’ response during actual metal micro-forming operations.
Performing uniaxial compression on “free-standing” cylinders[Reference Chan, Fu, Lu and Liu11] becomes more challenging experimentally as the cylinder diameter decreases below ~500 µm. Unlike compression testing on FIB fabricated micron/sub-micron pillars,[Reference Uchic, Dimiduk, Florando and Nix7, Reference Uchic, Shade and Dimiduk8, Reference Zhang, Zhang, Mu, Shao, Wick, Ramachandran and Meng12] where the pillars are attached to substrates, the meso scale cylinders tested in micro-forming experiments are “free-standing” in the literal sense, i.e., the top and bottom cylinder surfaces only maintain frictional contacts with the loading platens. Due to difficulties with mechanical alignment and specimen handling, premature deformation instability is more likely to occur as the cylinder diameter decreases below ~500 µm. In a recent study,[Reference Zhang, Song, Voyiadjis and Meng13] we examined the process of metal forming in a simple axisymmetric reverse extrusion geometry. Cup-shaped elemental Cu parts were formed through reverse extrusion of 3 mm diameter Cu rods placed in a die with a 3 mm diameter hole and compressed with center-aligned cylindrical punches of varying diameters. The characteristic dimension of forming, defined in this case by the sidewall thickness of the extruded axisymmetric cup structure, ranged from ~400 µm down to ~25 µm.[Reference Zhang, Song, Voyiadjis and Meng13] When the solid bottom of such an extruded cup is removed, for example by mechanical polishing, free-standing ring-shaped metal specimens are obtained with a fixed outer diameter, D, of 3 mm and varying wall thicknesses. Comparing uniaxial compression of “free-standing” metal cylinders with so obtained free-standing metal rings, as the characteristic specimen dimension, in one case defined by the cylinder diameter and the other by the ring wall thickness, decreases to below ~500 µm, it is more difficult to ensure the condition of true axial loading for the cylinder case. The ring-shaped specimens with a fixed outer diameter of 3 mm and decreasing ring wall thickness thus allow uniaxial compression testing to be conducted at decreasing characteristic specimen dimensions while not increasing the difficulty of mechanical alignment, as in the case of solid free-standing cylinders. In the present paper, we report on results of uniaxial compression testing of elemental Al ring-shaped specimens with D = 3 mm, wall thicknesses of ~400, ~300, and ~200 µm, and the Al grain size held approximately constant. Additional compression tests were performed on poly-crystalline Al cylindrical pillar specimens, with diameters ranging from ~20 to ~60 µm. These experiments were undertaken to obtain reliable size dependent uniaxial compression response data from Al specimens with characteristic specimen dimensions in the mesoscopic range.
An axisymmetric reverse extrusion die-and-punch set was custom designed and built. Commercial Al 1100 alloy (Al 99.9 at.%+) specimens were machined into solid cylinders, 3.0 mm in diameter and 4.0 mm in height. Prior to further experimentation, all machined Al cylinders were vacuum annealed at ~10−7 Torr at 600 °C for 1 hr. Annealed Al cylinders were placed into a nominally 3.0 mm cylindrical hole within a die made of tool steel. Axisymmetric, cup-shaped Al structures were formed through reverse extrusion, by compressing cylindrical rod punches with varying diameters and centered with respect to the die hole, into Al cylinder specimens confined within the die hole. Free-standing Al ring-shaped structures were made from reverse extruded Al cup structures by removing the solid bottom part through mechanical polishing. The nominal outer diameter of the extruded Al cups, and therefore of the ring-shaped Al specimens, was fixed at 3.0 mm. The nominal wall thickness of the ring-shaped specimens, t, decreased from ~400 to ~200 µm as the punch diameter increased from 2.20 to 2.60 mm. Mechanical polishing of the ring-shaped Al specimens was controlled to achieve a constant ring height, H, to wall thickness, t, ratio, H/t ~2.5 for all specimens. After mechanical polishing, all ring-shaped Al specimens were annealed again in vacuum (~10−7 Torr) at 500 °C for 10 h to restore grain equilibrium through recrystallization, to eliminate dislocations stored within the specimens due to the severe plastic deformation associated with the extrusion process, and to ensure similar grain size within all ring-shaped Al specimens prior to uniaxial compression testing. For comparison with the ring-shaped Al specimens, uniaxial compression of Al 1100 solid cylinder specimens, 3.0 mm in diameter and 4.0 mm in height, was also conducted. All machined 3.0 mm diameter Al cylinder specimens were annealed in vacuum (~10−7 Torr) at 400 °C for 1 h prior to compression testing, in order to obtain a similar initial grain size as compared with the annealed ring-shaped Al specimens. Further details on the extrusion setup were provided elsewhere.[Reference Zhang, Song, Voyiadjis and Meng13]
Uniaxial compression testing on annealed Al ring and cylinder specimens began by specimen placement between a pair of 52,100 steel rod platens. The bottom rod platen was fixed into a snugly-fitting blind hole on a bottom 4142 alloy steel plate. The top rod platen was put through a snugly-fitting, through guiding hole on a top 4142 alloy steel plate. The bottom and top plates were aligned to ensure that specimen compression by the top and bottom rod platens occurred along the cylinder axial direction. The total axial compression force, P, was measured through a MTS load cell with a full range of 25 kN. The axial displacement, Δ, was measured through an MTS extensometer, with a natural gauge length of 8 mm and an extension range of ±1.2 mm. Because of the small specimen length, the extensometer was attached to the sides of the bottom and top steel rod platens. A simple estimate showed that, in the present measurement load range, elastic displacements of the sections of the bottom and top rod platens included in between the extensometer gauge can be neglected, and displacements measured by the extensometer were equated to the specimen displacement. Measured P–Δ curves were then converted into true axial compression stress versus true axial strain (σ–ε) curves. SEM examinations of the ring-shaped specimens after testing showed that no buckling occurred as a result of the axial compression at t values of ~400, ~300, and ~200 µm. However, buckling-like ring structure collapse was observed at t ~100 µm, preventing the collection of valid flow stress data at characteristic specimen dimensions below 200 µm through the present ring compression experimental configuration.
To obtain additional compression response data for Al at characteristic specimen dimensions below 200 µm, additional nominally cylindrical pillar specimens with pillar diameters of ~20, ~40, and ~60 µm were made. The cylinders, milled from 3.0 mm diameter poly-crystalline Al rod specimens by Xe+ plasma focused ion beam (PFIB), are attached to the bulk at the bottom. Compression testing on PFIB Al pillars was conducted. Additional details on PFIB pillar fabrication, pillar compression experimentation, and data analysis are provided in the Supplementary Materials Sections S1–S3.
A FEI Quanta3D FEG dual-beam scanning electron microscope/focused ion beam (SEM/FIB) instrument was used to examine the morphology and microstructure of Al specimens. The SEM/FIB instrument included an x-ray energy dispersive spectroscopy attachment (EDAX), and an electron backscatter diffraction (EBSD) attachment (EDAX). Prior to EBSD examination of Al ring and cylinder specimens, mechanical polishing was conducted with SiC polishing papers of various grit sizes, followed by a final vibratory polish with 50 nm silica suspension on a GIGA 0900 Vibratory Polisher for 12 h. EBSD was performed at 30 kV at scan steps of 0.2–0.3 µm. The default instrument definition of the EBSD coordinate system was used, with the specimen normal direction (ND) perpendicular to the polished surface being mapped, the rolling direction (RD) contained within the plane defined by ND and the electron beam direction, and the transverse direction perpendicular to both ND and RD, forming a right-handed Cartesian coordinate system. Analysis of raw EBSD data, including inverse-pole-figure (PF) orientation maps, PFs, orientation distribution functions, and grain size statistics, was carried out using the TSL OIM software.[Reference Zhang, Song, Voyiadjis and Meng13]
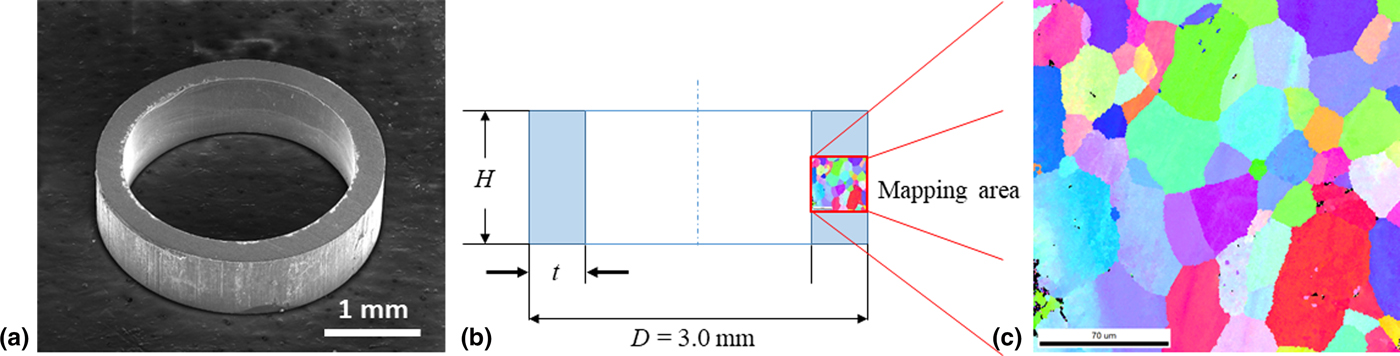
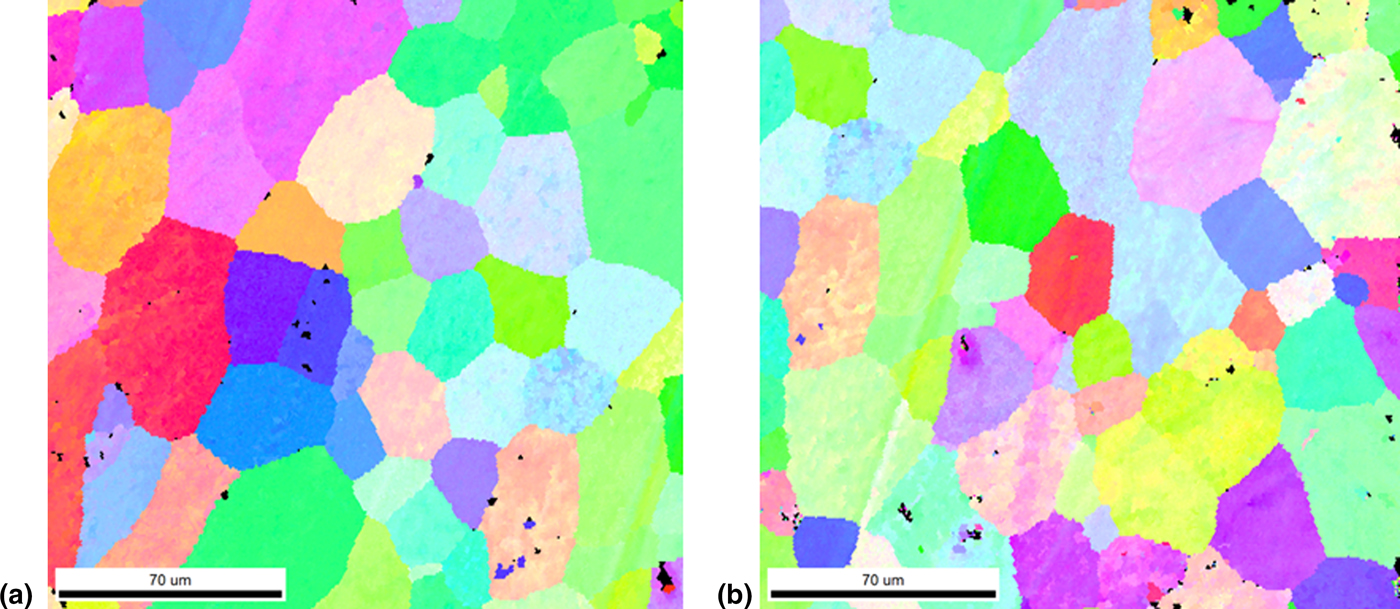
Figure 1(a) shows an SEM image of a typical ring-shaped Al specimen with a wall thickness of ~200 µm, after mechanical polishing and annealing at 500 °C for 10 h. The top and bottom surfaces of the Al ring were parallel to each other, and perpendicular to the ring axial direction. To examine the grain morphology and size, the Al ring specimen was further mechanically polished in a plane parallel to its axial direction until half of the ring was removed. Following a final vibratory polish, one section of the cross-sectional ring surface was examined with EBSD, as shown schematically in Fig. 1(b). Figure 1(c) shows the inverse-PF orientation map from the EBSD mapping area of Al ring cross section, indicated in the schematic of Fig. 1(b). The 500 °C annealing led to recrystallization within the as-extruded cup sidewall and grain growth from the micron-sized fibrous grains developed due to severe plastic deformation due to extrusion.[Reference Zhang, Song, Voyiadjis and Meng13] Analysis of data shown in Fig. 1(c) yielded an average Al grain size of 26.4 µm, with actual sizes ranging from ~10 to ~50 µm. Figures 2(a) and 2(b) show EBSD inverse-PF orientation maps from two ring-shaped Al specimens with t of ~300 and ~400 µm, respectively. Both Al ring specimens were annealed at 500 °C for 10 h. The average Al grain size obtained from Figs. 2(a) and 2(b) were 27.2 and 25.3 µm, respectively. In both cases, actual Al grain sizes ranged from ~10 to ~50 µm. Similar EBSD observations were made on 3 mm diameter Al cylinder specimens after an anneal at 400 °C for 1 h, showing an average Al grain size of ~25 µm and actual grain size ranging from ~10 to ~50 µm. Results shown in Figs. 1 and 2 indicate that the present Al specimen fabrication process yields specimens with similar initial grain size and morphology.
A typical ring-shaped Al specimen: (a) an SEM image of an as-annealed Al ring specimen with a wall thickness of 200 µm and a height of 500 µm; (b) a cross-sectional schematic drawing of the as-annealed Al ring specimen after mechanical polishing, with the approximate EBSD examination area indicated; (c) the Al grain morphology as indicated by the EBSD inverse-pole orientation map from the corresponding mapping area indicated in (b).

Grain size and morphology of ring-shaped Al specimens: an EBSD inverse-pole orientation map from the polished cross-section of an as-annealed Al ring specimen with (a) a wall thickness of 300 µm and a height of 750 µm; (b) a wall thickness of 400 µm and a height of 1000 µm.
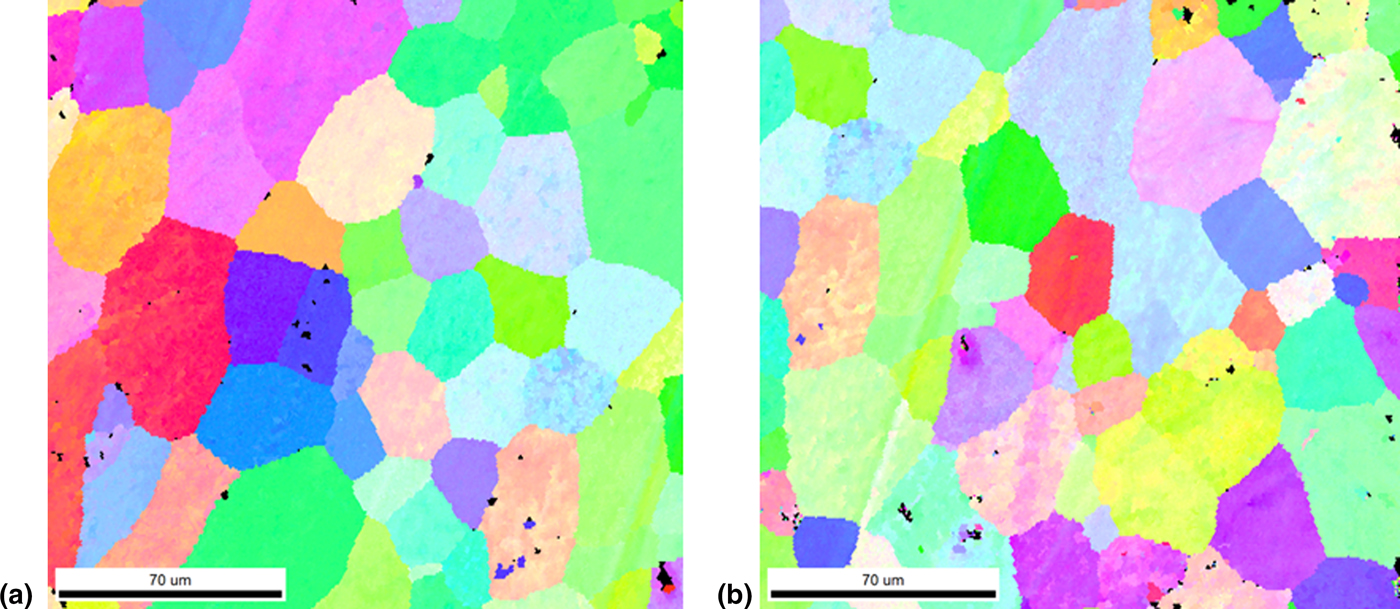
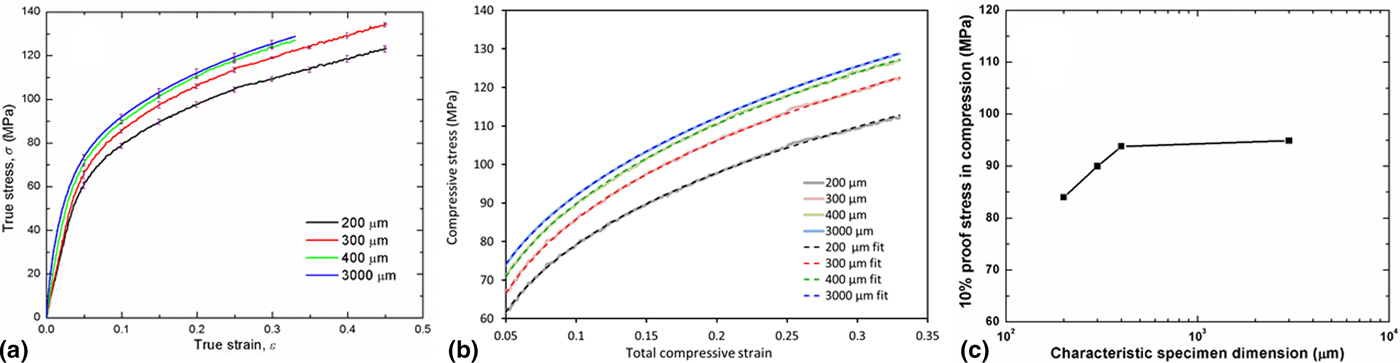
Figure 3(a) shows the results of axial compression testing on Al ring and cylinder specimens. The Al specimens were denoted by their characteristic dimensions, wall thicknesses for ring specimens, and diameters for cylinder specimens. For each specimen designation, raw P–Δ data were obtained from six nominally identical specimens and converted into σ–ε curves. Each curve shown in Fig. 3(a) represents the collection of all data points from the six specimens in the group, averaged within a strain range of 10−3, i.e., all data points with strains falling within 0–1 × 10⁻³, 1 × 10⁻³–2 × 10⁻³, etc., were averaged together. Visually, the four curves show a clear decrease of the compression flow stress as the characteristic specimen dimension decreases from ~3000 to ~400 µm, ~300, and ~200 µm.
Uniaxial compression testing of Al ring and cylinder Al specimens: (a) compression response of Al at four external specimen sizes. Each data curve is an average of all data points obtained from six nominally identical specimens at one single external specimen size; (b) power-law fits to the data shown in (a); (c) 10% proof stress in compression versus the characteristic specimen dimension. The line through the data points is a guide to the eye.
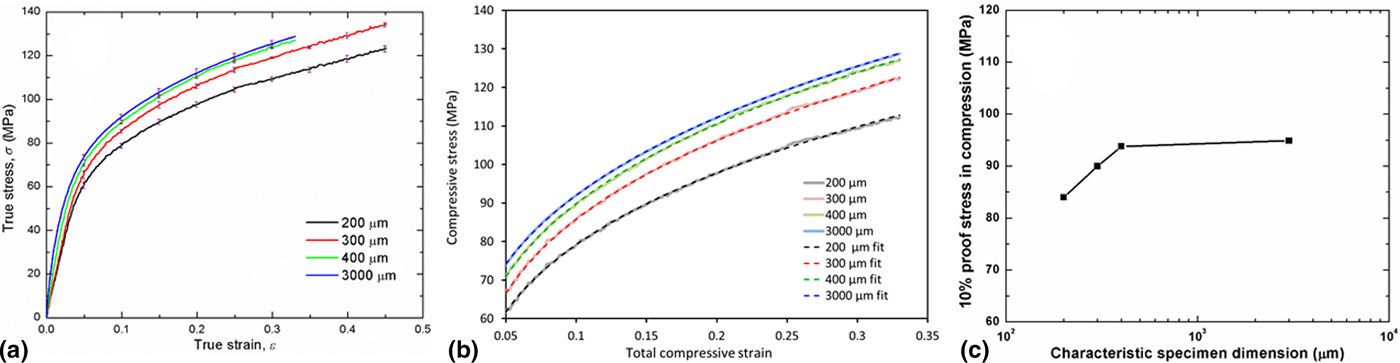
Variabilities existed in contacts between the ring specimens and the steel platens. Such geometrically non-perfect contacts resulted in horizontal shifts (ε 0) of the σ–ε curves, as evident in Fig. 3(a). For instance, σ 200 and σ 300 show very similar responses at the initial stage of loading (ε < 0.05), which then diverge in the later stage (ε > 0.05). On the other hand, σ 400 and σ 3000 grow closer in the later stage. Such imperfect contacts also resulted in the slope of the initial portion of the measured σ–ε curves being significantly lower than that corresponding to the expected elastic modulus for Al. To account for such mechanical misalignment effects, the early “elastic” portions of the σ–ε curves were ignored, and later stages of the σ–ε curves, in the strain range of 0.05 ≤ ε ≤ 0.33, were fitted to the function
 $$\sigma = K(\varepsilon - \varepsilon _0 )^n. $$
This fit yielded a varying K, 153–174 MPa, and a relatively constant exponent n between 0.262 and 0.270, with an average  $\bar n$ of 0.266. Shown in Fig. 3(b), a new fit with the constraint of
 $n = \bar n$ was then performed, which yielded K values ranging from 153.6 MPa to 174.3 Pa. Both fitting schemes generated satisfactory goodness of fit, with R 2 > 0.999. The true, shift corrected, plastic behavior of the Al ring specimens was taken as
 $$\sigma = K\varepsilon ^{0.266}. $$
The “smaller is weaker” softening behavior is shown clearly in Fig. 3(c), where the 10% proof stress in compression for the 3 mm diameter Al cylinder specimen and the Al ring specimens is plotted versus the characteristic specimen dimension.
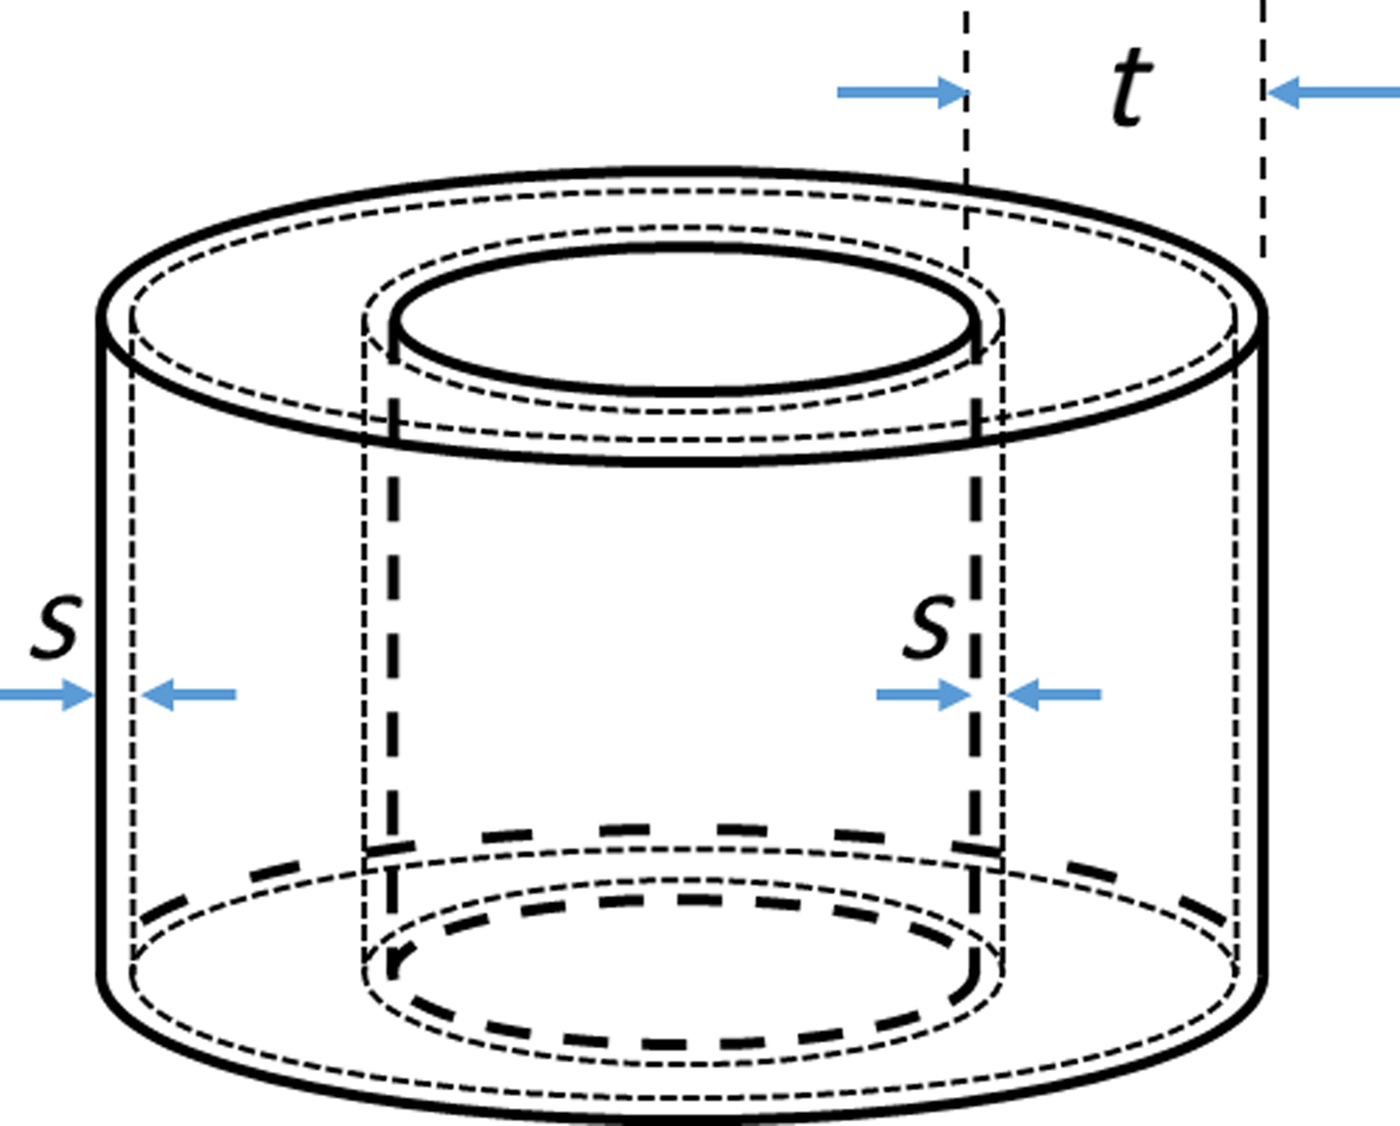
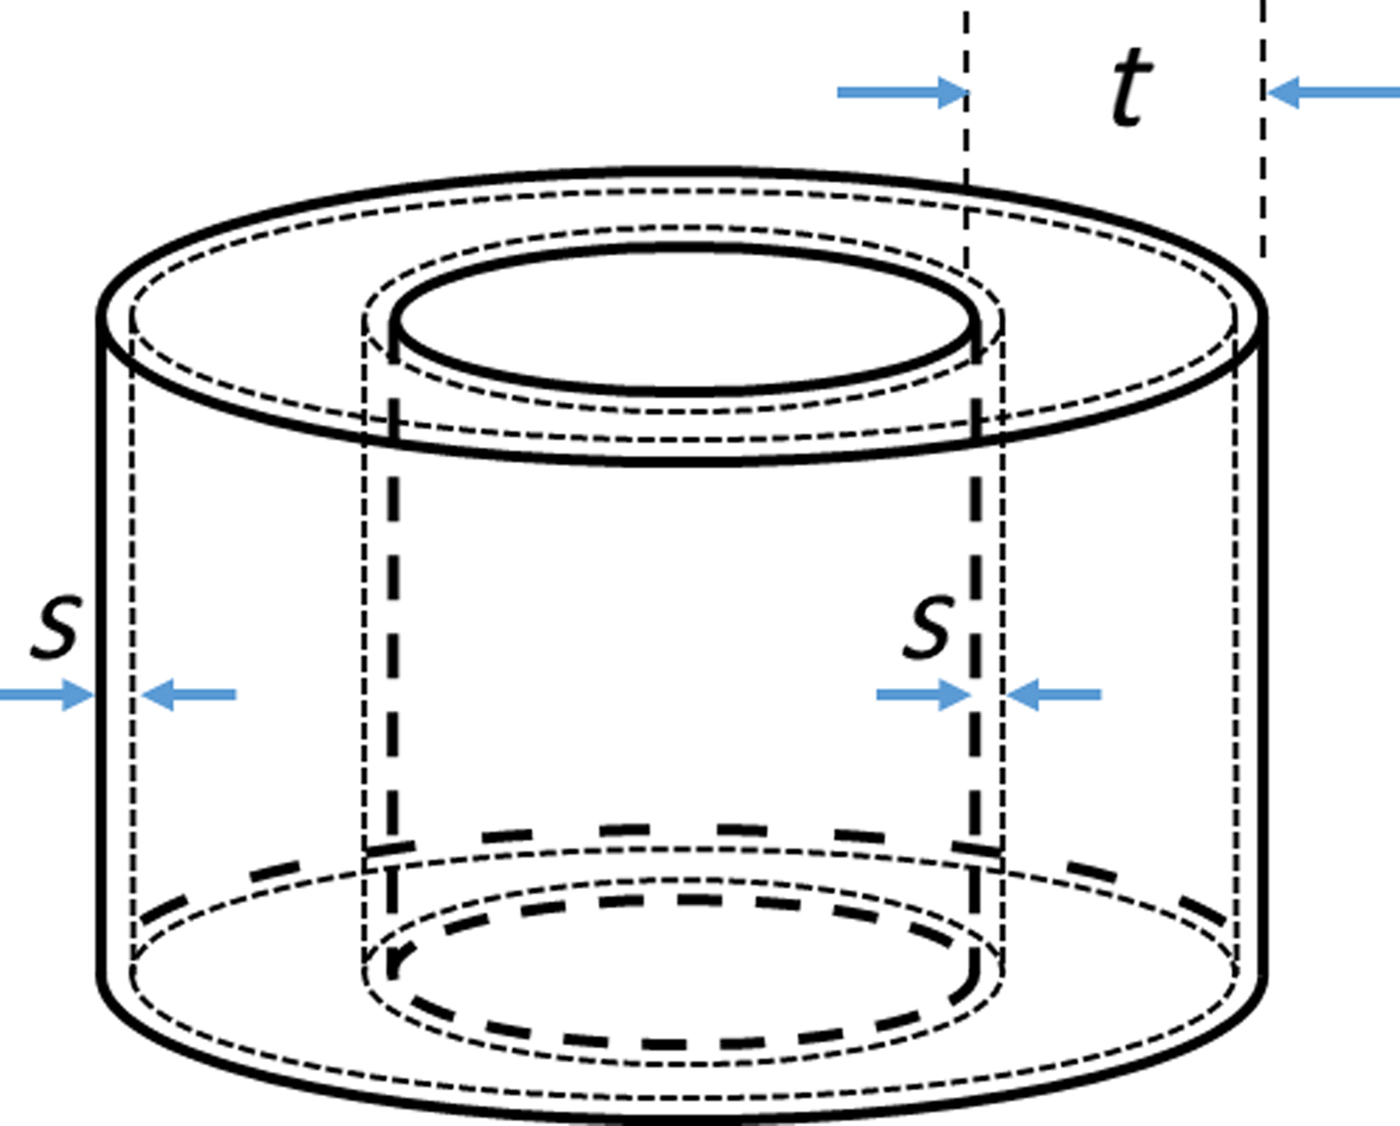
A rationalization of the observed decrease in uniaxial compression flow stress as the characteristic specimen dimension decreases is offered by the surface layer model, which states that a layer next to the specimen free surface possesses a decreased flow stress as compared with that of the specimen interior, taken as the bulk flow stress σ b.[Reference Geiger, Kleiner, Eckstein, Tiesler and Engel1, Reference Fu and Chan14–Reference Lai, Peng, Hu, Lan and Ni19] Figure 4 shows schematically a ring-shaped specimen, with the two surface layers of thickness s beneath the ring outer and inner surfaces. Ignoring end effects, the volume fraction of the two surface layers within the ring specimen, f s, is given by
 $$f_{\rm s} = \displaystyle{{2s} \over t},$$
where s and t are respectively, the surface layer thickness and the wall thickness of the ring. To first order, the surface layer model assumes that the stress responses are uniform in the surface layers (σ s) and in bulk (σ b), respectively. The overall flow stress of the ring can be approximated by the rule of mixture:[Reference Fu and Chan14]
 $$\sigma _{{\rm ring}} = (1 - f_{\rm s} )\sigma _{\rm b} + f_{\rm s} \sigma _{\rm s}. $$
A schematic illustration of the Al ring specimen and the surface layer model.
Due to the different magnitudes of plastic deformation in the surface layer and the bulk, a slight load transfer exists at the surface/bulk interfaces, leading to a deviation of σ ring from the rule of mixture estimation. However, this deviation is extremely small according to our finite element analysis, and does not affect the validity of Eq. (4).
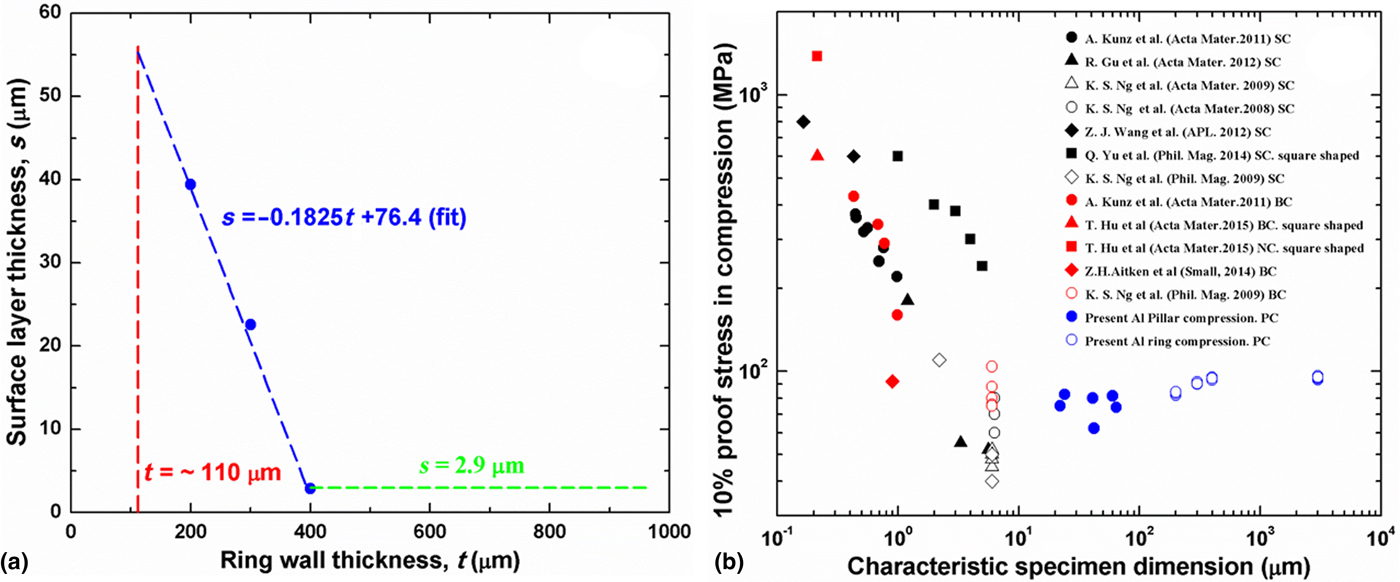
Taking the surface layer model literally, we assume that the respective stress responses of the surface layer and the bulk remain unique when different samples are considered, i.e., the values of σ s and σ b are constants within the realm where the surface layer model remains applicable. We identify the bulk behavior with the result of present compression measurement on the 3 mm diameter Al cylinder specimen, i.e., σ b = σ 3000. In particular, the 10% proof stress in compression for σ 3000, and therefore σ b, is 94.5 MPa. We further identify the surface layer behavior with the presently available literature data on compression response of Al pillars with the largest diameter, which is ~6 µm.[Reference Ng and Ngan20, Reference Ng and Ngan21] According to this data of Ng and Ngan, the average of 10% proof stress in compression for single crystal and bi-crystal 6 µm diameter Al pillars is 66.7 MPa, which is taken to be the 10% proof stress of σ s. Knowing σ sand σ b, we then obtained the values of s from measured results for σ ring, in particular, the value of its 10% proof stress in compression, following Eqs. (3) to (4). The result of this determination is s 200 = 39.4 µm, s 300 = 20.6 µm, and s 400 = 2.9 µm. The variation of s with respect to the ring wall thickness, t, is shown in Fig. 5(a) (blue solid circles), together with a simple linear fit to the three data points (blue dashed line). This linear fit indicates that s reaches ~55 µm when t decreases to ~110 µm. That is, 2s approaches t as t decreases to ~110 µm, and the surface layer volume fraction approaches 1. As the characteristic dimension of the specimen increases beyond ~400 µm, the exact magnitude of the surface layer thickness becomes increasingly less material, as σ b dominates its overall mechanical response. For convenience, we assume that the surface layer thickness approaches a constant in this limit, i.e., s = 2.9 µm for t > 400 µm. As such, a complete description of the function s(t) for t > ~110 µm is shown in Fig. 5(a).
(a) The calculated surface layer thickness as a function of the wall thickness of Al ring specimens; (b) a “master curve” showing the variation in the 10% proof stress in compression of Al as the characteristic specimen dimension varies from ~0.2 to ~3000 µm. SC, BC, and PC denote, respectively, single crystal, bi-crystal, and poly-crystal.
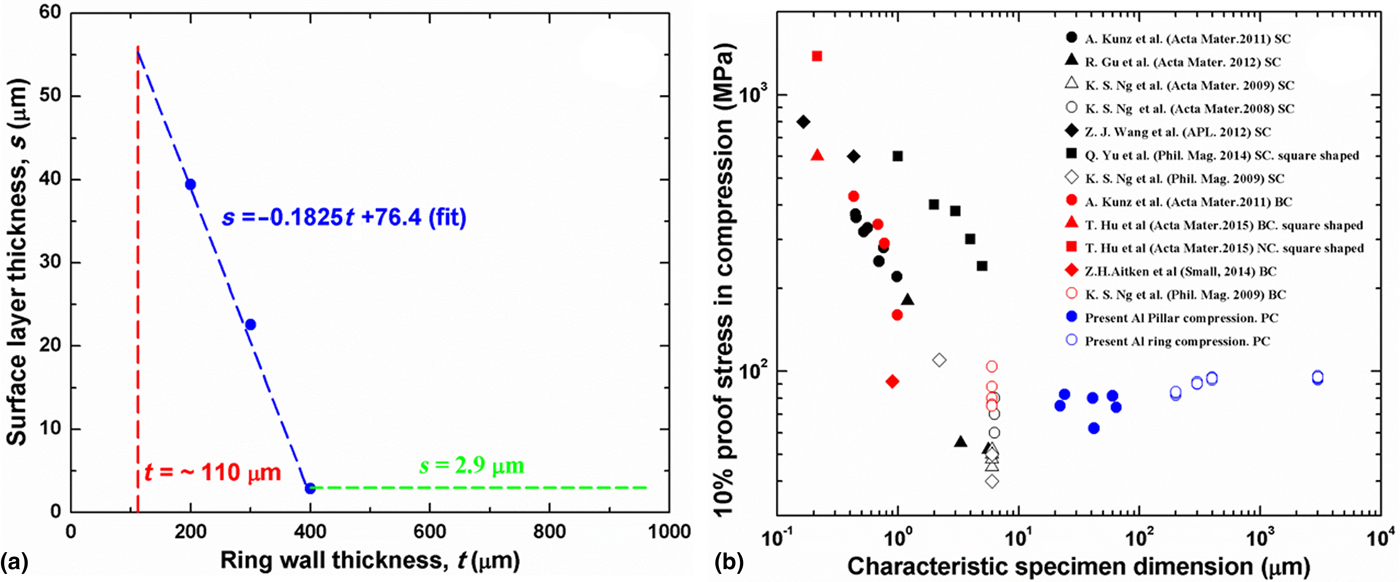
It is well acknowledged that the surface grains of a material are subjected to less constraints as compared with internal grains, therefore leading to significantly lower dislocation densities near the grain boundaries as well as within the grain interior.[Reference Miyazaki, Shibata and Fujita15, Reference Gao and Huang22] Correspondingly, a common practice of defining the surface layer is to identify the thickness of the surface layer with the average grain size, i.e., s–d. Accordingly, the surface layer thickness should be identical for samples with identical, uniform grain sizes. However, the present data suggest that thickness of the surface layer s is strongly dependent on the sample size t. Although s is comparable with d for t of ~300 µm, s is only around 10% of d for large samples (t > 400 µm) and exceeds d for smaller specimens (t = 200 µm). This contradiction suggests that the classical surface layer model may be inadequate in describing the actual materials behavior in the mesoscale in two regards. First, under the assumption of a unique surface layer mechanical response, the thickness of the surface layer may not be necessarily coupled to the grain size of the sample. This calls for a more definitive way to distinguish the surface layer from the bulk. Second, under the assumption of s–d unity, i.e., s ~ d, the constitutive behavior of the surface layers may not be unique across samples with different sizes, and thus needs to be better understood. Reconciliation of both aspects rests in better understanding towards the near-surface evolution of dislocation structures and remains to be clarified in future studies combining in situ micro-scale testing with grain level computational plasticity modeling.
The present Al ring compression experiments left a gap in the compression response of Al in the characteristic specimen dimension range from ~10 to ~200 µm. Additional compression experiments were therefore conducted on PFIB fabricated Al micro-pillars with diameters ranging from ~20 to ~60 µm. Collecting the present ring compression and pillar compression data together with existing Al pillar compression data in the literature,[Reference Ng and Ngan20, Reference Ng and Ngan21, Reference Ng and Ngan23–Reference Kim, Lee, Jeon, Kim, Lee, Oh and Han30] Fig. 5(b) plots the dependence of the uniaxial compression response of Al, in terms of the 10% proof stress in compression, versus the characteristic specimen dimension in a “master curve” fashion. For the present compression experiments conducted on Al ring specimens, six data points, corresponding to six compression tests, are shown for each ring wall thickness. The “smaller is stronger” and “smaller is weaker” trends are observed at the two extremes of length scales. At 200 µm and above, due to the softening effect of the surface layers, the flow stress reduces with reducing length scale – smaller is weaker. On the other hand, at 5 µm and below, dimensional reduction leads to significant increase in strength due to the dislocation starvation mechanism – smaller is stronger.
Several comments are in order. First, it should be noted that the exact value of the surface layer thickness, according to the literal interpretation of the surface layer model, is dependent upon the choice of the value of σ s. For example, if σ s is taken instead as the average 10% proof stress in compression obtained from the present experiments on ~20 µm diameter Al pillars, ~77 MPa, the surface layer thickness s would then have been 4.6, 32.7, and 62.6 µm at t = 400, 300, and 200 µm, respectively. While the s values vary, the same trend that s increases significantly with decreasing t remains. Second, the present results indicate that f s approaches 100% at characteristic specimen dimensions of ~110 µm (or ~150 µm if σ s is taken to be 77 MPa). This gives an estimated limit of applicability for the surface layer model: the surface layer softening effect no longer dominates the mechanical response as f s approaches 100%. This is also consistent with the master curve plot of Fig. 5(b), where the softening trend at 200 µm and above does not seem to continue to the data points at 100 µm and below. In particular, the pillar compression data at pillar diameters of 20–60 µm indicate a relatively flat response versus the external specimen size. Third, as has been pointed out before,[Reference Ng and Ngan20, Reference Kunz, Pathak and Greer24] large scatter in flow stress exists in the transition range of 5 to 100 µm, where the detailed structures of each pillar, whether it is a single crystal, bi-crystal with different boundary orientation, or poly-crystal, give rise to significantly different measured responses.
In summary, the present work extends data on uniaxial compression response of elemental Al to characteristic dimensions below 500μm, and confirms the “smaller is weaker” trend in the mesoscale range of 200–500 µm. The present work partially fills in the data gap for the compression response of Al in the mesoscale by bridging the nm to the mm scale, reveals aspects of the surface layer model that require further understanding and clarification, and provides a baseline for delineating deformation mechanisms truly important to metal micro-forming operations.
Supplementary Material
The supplementary material for this article can be found at https://doi.org/10.1557/mrc.2018.81
Acknowledgments
The authors gratefully acknowledge partial project support from the US National Science Foundation (NSF OIA-1541079). The experimental work used facilities at the LSU shared instrumentation facility (SIF), a part of the NSF EPSCoR CIMM core user facilities (CUFs).