Introduction
Epidemiological surveys of child–adolescent mental disorders consistently find high co-morbidity (Fergusson et al. Reference Fergusson, Horwood and Lynskey1994; Newman et al. Reference Newman, Moffit, Caspi, Magdol, Silva and Stanton1996; Angold et al. Reference Angold, Costello and Erkanli1999). Several longitudinal studies have examined temporal progression among these co-morbid disorders (Pine et al. Reference Pine, Cohen, Gurley, Brook and Ma1998; Stein et al. Reference Stein, Fuetsch, Muller, Hofler, Lieb and Wittchen2001; Reinke & Ostrander, Reference Reinke and Ostrander2008). However, these studies have generally (McGee et al. Reference McGee, Feehan, Williams and Anderson1992; Fergusson et al. Reference Fergusson, Horwood and Lynskey1993; Costello et al. Reference Costello, Angold, Burns, Stangl, Tweed, Erkanli and Worthman1996), although not always (Lieb et al. Reference Lieb, Isensee, von Sydow and Wittchen2000; Shankman et al. Reference Shankman, Lewinsohn, Klein, Small, Seeley and Altman2009), focused on point prevalence in each wave or the cumulation of point prevalence estimates across multiple waves (Costello et al. Reference Costello, Mustillo, Erkanli, Keeler and Angold2003; Kim-Cohen et al. Reference Kim-Cohen, Caspi, Moffitt, Harrington, Milne and Poulton2003). For example, the Great Smoky Mountain Study assessed 3-month mental disorders once yearly in three cohorts of children (Costello et al. Reference Costello, Mustillo, Erkanli, Keeler and Angold2003). This approach makes it impossible to distinguish associations of primary disorders with onset versus persistence of secondary disorders. Such a distinction, which would require examining temporal sequencing across lifetime rather than recent disorders, could have value in interpreting longitudinal associations and strategizing about intervention possibilities (Angold et al. Reference Angold, Costello and Erkanli1999). There are exceptions, however. For example, the Early Developmental Stages of Psychopathology Study (Wittchen et al. Reference Wittchen, Perkonigg, Lachner and Nelson1998) is a large-scale longitudinal study that examined temporal sequencing of lifetime disorders in a cohort of adolescents followed into adulthood. Among the important findings this design allowed are that temporally prior generalized anxiety disorder (GAD) predicts the subsequent onset of other anxiety disorders more strongly than the subsequent onset of depression (Beesdo et al. Reference Beesdo, Pine, Lieb and Wittchen2010) and that social phobia is associated with subsequent onset of temporally secondary depression (Beesdo et al. Reference Beesdo, Bittner, Pine, Stein, Hofler, Lieb and Wittchen2007). However, this kind of analysis has never been used to examine temporal sequencing of disorder onsets across the full range of commonly occurring mental disorders.
The current report presents results of a preliminary analysis of the associations between temporally prior lifetime disorders and the subsequent first onset of temporally secondary disorders based on the data collected in the US National Comorbidity Survey Replication Adolescent Supplement (NCS-A), a national survey of adolescent DSM-IV disorders (Merikangas et al. Reference Merikangas, Avenevoli, Costello, Koretz and Kessler2009). The results are only preliminary because the data are cross-sectional and temporal associations are inferred from retrospective age-of-onset (AOO) reports. Nonetheless, intriguing results emerge that could be useful in generating hypotheses to be examined in subsequent longitudinal studies. Previous studies would lead us to expect stronger inter-temporal associations within than between anxiety-mood and behavioral disorders (Reinke & Ostrander, Reference Reinke and Ostrander2008; Copeland et al. Reference Copeland, Shanahan, Costello and Angold2009) and strong associations of temporally primary behavior disorders with later substance disorders (Tapert et al. Reference Tapert, Baratta, Abrantes and Brown2002; Elkins et al. Reference Elkins, McGue and Iacono2007; Copeland et al. Reference Copeland, Shanahan, Costello and Angold2009), but we had no initial hypotheses about other specifications.
Method
Sample
Adolescents (ages 13–17 years) were interviewed between February 2001 and January 2004 in dual-frame household and school samples described elsewhere (Kessler et al. Reference Kessler, Avenevoli, Costello, Green, Gruber, Heeringa, Merikangas, Pennell, Sampson and Zaslavsky2009a , Reference Kessler, Avenevoli, Costello, Green, Gruber, Heeringa, Merikangas, Pennell, Sampson and Zaslavsky b ). The household sample included 904 adolescents (879 in school, 25 drop-outs) from households in the National Comorbidity Survey Replication (NCS-R; Kessler & Merikangas, Reference Kessler and Merikangas2004). The school sample included 9244 adolescents from a representative sample of schools in the adult sample areas of that survey. The conditional adolescent response rate was 86.8–82.6% (household and school samples respectively). The household sample includes school drop-outs and adolescents residing in areas where schools refused to participate. A high (72.0%) percentage of initially selected schools refused to participate and were replaced with matched replacement schools. Comparison of household sample respondents from non-participating schools with school sample respondents from replacement schools found no evidence of bias in estimates of either disorder prevalence or correlates (Kessler et al. Reference Kessler, Avenevoli, Costello, Green, Gruber, Heeringa, Merikangas, Pennell, Sampson and Zaslavsky2009a ).
One parent or surrogate (henceforth referred to as parents) of participating adolescents was asked to complete a self-administered questionnaire about the adolescent's developmental history and mental health. The conditional response rate was 82.5–83.7% (household and school samples respectively). This report focuses on the 6483 adolescent–parent pairs where complete data are available from both adolescents and parents. The fact that parent data were available for only a subset of adolescent respondents was taken into consideration by weighting the data in complete parent–adolescent pairs to adjust for differences with incomplete pairs. These weighting procedures are discussed in detail elsewhere (Kessler et al. Reference Kessler, Avenevoli, Costello, Green, Gruber, Heeringa, Merikangas, Pennell, Sampson and Zaslavsky2009a , Reference Kessler, Avenevoli, Costello, Green, Gruber, Heeringa, Merikangas, Pennell, Sampson and Zaslavsky b ).
Written parent informed consent and adolescent assent were obtained before surveying either the parent or adolescent. Each respondent was given US$50 for participation. These recruitment and consent procedures were approved by the Human Subjects Committees of both Harvard Medical School and the University of Michigan. Once the survey was completed, cases were weighted for within-household probability of selection (household sample) and deviation from Census population sociodemographic/geographic distributions, making each sample nationally representative on the sociodemographic/geographic variables. The samples were then merged with sums of weights proportional to relative sample sizes adjusted for design effects in estimating disorder prevalence. These procedures are detailed elsewhere (Kessler et al. Reference Kessler, Avenevoli, Costello, Green, Gruber, Heeringa, Merikangas, Pennell, Sampson and Zaslavsky2009a , Reference Kessler, Avenevoli, Costello, Green, Gruber, Heeringa, Merikangas, Pennell, Sampson and Zaslavsky b ).
Diagnostic assessment
Adolescents were administered the fully structured Composite International Diagnostic Interview (CIDI) modified to simplify language and use examples relevant to adolescents (Merikangas et al. Reference Merikangas, Avenevoli, Costello, Koretz and Kessler2009). The 15 DSM-IV disorders assessed include mood disorders (major depressive disorder/dysthymia, bipolar I–II disorder and subthreshold bipolar disorder), anxiety disorders [panic disorder with or without agoraphobia, agoraphobia without panic disorder, social phobia, specific phobia, GAD, post-traumatic stress disorder (PTSD), separation anxiety disorder (SAD)], behavior disorders [attention deficit hyperactivity disorder (ADHD), oppositional defiant disorder (ODD), conduct disorder, eating disorders (anorexia nervosa, bulimia nervosa, binge-eating behavior)] and substance disorders (alcohol and drug abuse, alcohol and drug dependence with abuse). There were no other exclusionary diagnoses. These disorders include all those assessed in most previous adolescent epidemiological studies.
Adolescent interviews assessed all disorders. Parent questionnaires assessed only disorders for which parent reports have previously been found important in diagnosis: behavior disorders (Johnston & Murray, Reference Johnston and Murray2003) and depression/dysthymia (Braaten et al. Reference Braaten, Biederman, DiMauro, Mick, Monuteaux, Muehl and Faraone2001). Parent and adolescent reports were combined at the symptom level using an ‘or’ rule (except in the case of ADHD, where only parent reports were used based on evidence of invalidity of adolescent reports). All diagnoses were made using DSM-IV distress/impairment criteria and organic exclusion rules, but diagnostic hierarchy rules were not used because we wanted to study co-morbidity among hierarchy-free disorders.
A clinical reappraisal study interviewed adolescent–parent pairs by telephone with the Schedule for Affective Disorders and Schizophrenia for School-Age Children (K-SADS) Lifetime Version (Kaufman et al. Reference Kaufman, Birmaher, Brent, Rao, Flynn, Moreci, Williamson and Ryan1997). As detailed elsewhere, concordance was good between survey and clinical diagnoses (Kessler et al. Reference Kessler, Avenevoli, Green, Gruber, Guyer, He, Jin, Kaufman, Sampson and Zaslavsky2009c ), with an area under the receiver operating characteristic curve (AUC) of 0.81–0.94 for fear disorders, 0.79–0.86 for distress disorders, 0.78–0.98 for behavior disorders, and 0.92–0.98 for substance disorders. Parent and adolescent reports both contributed to the AUC when both were assessed for depression/dysthymia (0.75, 0.71 and 0.87 for adolescent, parent and combined reports respectively), ODD (0.71, 0.66 and 0.85) and conduct disorder (0.59, 0.96 and 0.98), but only parent reports contributed to the AUC for ADHD (0.57, 0.71 and 0.78). Adolescent disorder AOO reports were obtained retrospectively using probes shown experimentally to maximize recall accuracy among adults (Knauper et al. Reference Knauper, Cannell, Schwarz, Bruce and Kessler1999).
Analysis methods
AOO curves were generated using the actuarial method (Halli et al. Reference Halli, Rao and Halli1992). Tetrachoric factor analysis (principal axis method) with promax rotation was used to examine bivariate co-morbidity. Temporal unfolding was studied by examining predictive associations between temporally primary disorders (based on retrospective AOO reports) and first onset of later disorders with multivariate discrete-time survival models using a person-year dataset (Willett & Singer, Reference Willett and Singer1993). The details of this modeling procedure, which we have used extensively in previous NCS reports, are presented elsewhere (Kessler et al. Reference Kessler, Berglund, Demler, Jin, Merikangas and Walters2005). Each model predicted first onset of one disorder from information about prior lifetime occurrence of the other 14 disorders controlling basic sociodemographic variables [sex, race/ethnicity (Non-Hispanic White, Non-Hispanic Black, Hispanic, Other), region of the country (Northeast, Midwest, South, West), urbanicity (Major Metropolitan Area, other urbanized area, rural area), parent education (less than high school, high school, some college, college graduate, coded for the parent with the higher level of education), number of biological parents with whom the adolescent lives (0–2), birth order (only child, oldest, youngest, other), number of siblings, and age].
Several more complex models allowed non-additive associations to exist among the predictor disorders. One of these added to the additive multivariate model a series of dummy variables for number of prior lifetime disorders beginning with two. These dummy variables represent gross interaction terms that require the coefficient to be the same for all combinations of disorders of a given number (e.g. all pairs of disorders, all sets of three disorders). A somewhat more complex model weighted the disorders in each of these sets to have differential slopes proportional to the main effects of the disorders. Another specification allowed for interactions between a continuous measure of number of prior lifetime disorders and each type of prior lifetime disorders. More detailed information about these models has been presented in a previous report (Alonso et al. Reference Alonso, Vilagut, Chatterji, Heeringa, Schoenbaum, Bedirhan Üstün, Rojas-Farreras, Angermeyer, Bromet, Bruffaerts, de Girolamo, Gureje, Haro, Karam, Kovess, Levinson, Liu, Medina-Mora, Ormel, Posada-Villa, Uda and Kessler2011). The best-fitting model among these alternatives was selected using Akaike's Information Criterion (AIC; Burnham & Anderson, Reference Burnham and Anderson2002). Survival coefficients and standard errors were exponentiated to produce odds ratios (ORs) and 95% confidence intervals (CIs).
Population attributable risk proportions (PARPs) were calculated to describe the strength of association between predictor disorders and outcome disorders. PARPs are the proportions of outcome disorders that would not have occurred in the absence of predictor disorders under the model if the survival coefficients represent causal effects. The proportions were calculated by generating a conditional predicted probability of first onset of each outcome disorder at each year of life of each respondent from the coefficients in the best-fitting survival model twice: once using all model coefficients and then again omitting coefficients for the predictor disorders. The actuarial method (Halli et al. Reference Halli, Rao and Halli1992) was used to cumulate conditional predicted probabilities to respondent age at interview. PARP was defined as 1 – R, where R represents the ratio of the mean cumulative predicted probability in the second specification divided by the mean cumulative predicted probability in the first specification.
As the survey data are both clustered and weighted, the design-based Taylor series linearization method implemented in the SUDAAN software system (SUDAAN, 2002) was used to estimate standard errors of prevalence estimates and 95% CIs of ORs. Significance of predictor sets was evaluated using Wald χ2 tests based on design-based variance–covariance matrices. Statistical significance was consistently evaluated using 0.05-level two-sided tests.
Results
Lifetime prevalence and co-morbidity
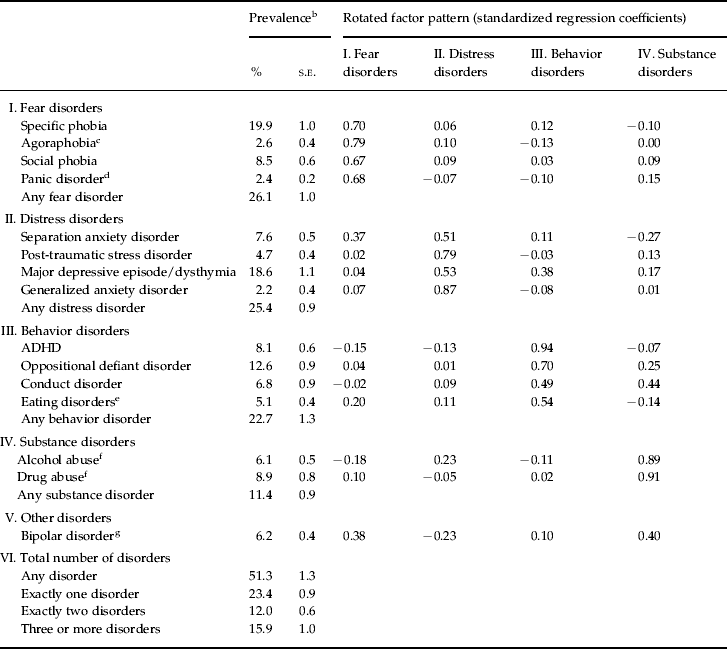
A previous NCS-A report documented high lifetime prevalence of disorders (Merikangas et al. Reference Merikangas, He, Burstein, Swanson, Avenevoli, Cui, Benjet, Georgiades and Swendsen2010). Overall prevalence is even higher in the current data because we included subthreshold bipolar disorder, which was omitted from the earlier report (Table 1). Co-morbidity is also more common because we analyze hierarchy-free diagnoses, with 27.9% of respondents meeting criteria for two or more disorders and a mean of 3.5 disorders among those with co-morbidity. All but two of the 105 tetrachoric correlations among disorder pairs [(15×14)/2] are positive (82.5% statistically significant), with a median of 0.29 and interquartile range (IQR, 25th–75th percentiles) of 0.20–0.37. (The tetrachoric correlation matrix is available on request.)
Lifetime prevalence of estimated DSM-IV disorders along with standard errors of prevalence estimates (s.e.) and rotated (promax) factor pattern of co-morbid disorders in the subsample with complete parent data (n=6483)Footnote a

ADHD, Attention deficit hyperactivity disorder; s.e., standard error.
a Eigenvalues of unrotated factors: 5.2, 2.2, 1.1, 1.0, 0.9. Correlations among factors in promax rotated four-factor solution: I–II 0.44; I–III 0.25, I–IV 0.16, II–III 0.31, II–IV 0.29, III–IV 0.43.
b The prevalence estimates reported here are higher than those in an earlier NCS-A report (Merikangas et al. Reference Merikangas, He, Burstein, Swanson, Avenevoli, Cui, Benjet, Georgiades and Swendsen2010) because disorders were defined here without diagnostic hierarchy rules and included subthreshold bipolar disorder. Estimated co-morbidity is higher than in the earlier report because hierarchy rules were not used.
c Agoraphobia is assessed with or without panic disorder.
d Panic disorder is assessed with or without agoraphobia.
e Includes anorexia nervosa, bulimia nervosa and binge-eating disorder.
f With or without dependence.
g Includes bipolar I, bipolar II and subthreshold bipolar disorder.
Factor analysis finds four factors with unrotated eigenvalues >1.0. Oblique (promax) rotation shows that the first factor is similar to what previous studies referred to as a fear factor (Krueger, Reference Krueger1999; Watson, Reference Watson2005), with high loadings for panic and phobias (0.67–0.79) (Table 1). The second factor represents what previous studies referred to as a distress factor, including depression, GAD, PTSD and SAD (0.51–0.87). The third factor represents behavior disorders (0.49–0.94) and the fourth represents alcohol–drug disorders (0.89–0.91), although conduct disorder (0.44) and bipolar disorder (0.40) also have elevated loadings. Disorders in the fear factor are the most common (26.1%), followed by distress (25.4%), behavior (22.7%) and substance (11.4%) disorders. The factors are all significantly correlated with each other, from a high Pearson correlation of 0.44 between fear and distress disorders to a low correlation of 0.16 between fear and substance disorders.
AOO distributions
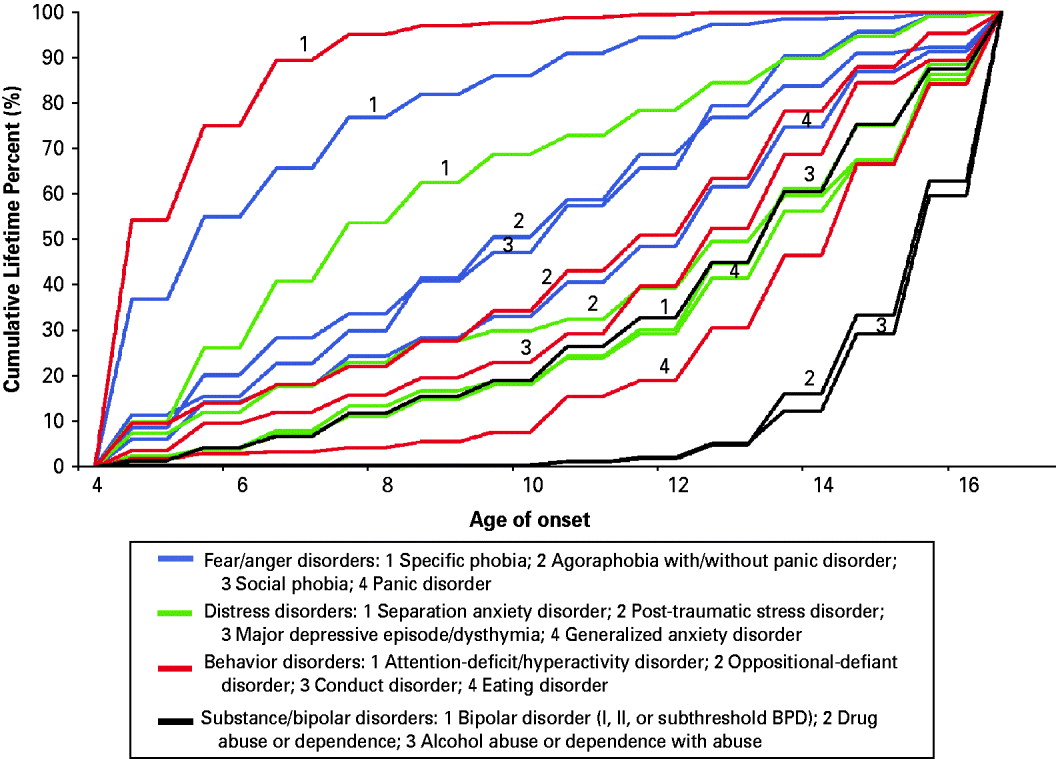
The retrospectively reported median (IQR) AOO of any disorder is 8 (6–13) years. A clear temporal order exists across disorders within classes (Fig. 1) Specific phobia has the earliest AOO (median) within fear disorders (6), SAD within distress disorders (8), and ADHD within behavior disorders (6). The next earliest AOO distributions are for other fear (11–12) and behavior (12–13) disorders. Bipolar disorder (14), the remaining distress disorders (14), eating disorders (15), and substance disorders (16) have the latest median AOO.
Age-of-onset (AOO) distributions based on retrospective AOO reports among respondents with lifetime DSM-IV/Composite International Diagnostic Interview (CIDI) disorders.

Bivariate associations between earlier and later disorders
We estimated 210 (14×15) bivariate survival models, each with one lifetime disorder as a time-varying predictor of subsequent first onset of one other disorder, controlling for sociodemographics. In total, 89.3% of coefficients were positive and 59.5% significant. (Detailed results are available upon request.) The median (IQR) OR of the significant positive survival coefficients was 3.1 (2.3–3.9). Only two coefficients were negative and significant, both involving associations of substance disorders with later agoraphobia.
The best-fitting model
The best-fitting multivariate model pooled across all outcomes predicted first onset of each disorder from dummy variables for prior disorders plus summary measures of number of prior disorders. (Detailed results of model fitting are available on request.) The number-of-disorders measures include dummy variables for 2 to ⩾7 disorders.
Coefficients associated with pure disorders
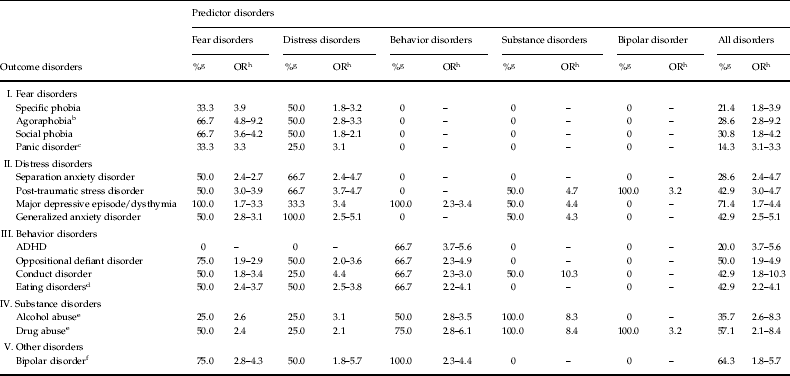
The disorder type coefficients in the best-fitting model represent predictive associations of disorders that occur to people with no prior disorders. As there are a large number of coefficients for these pure disorders, it is useful to focus on summary statistics. (Detailed results are available on request.) A total of 40.0% of pure-disorder coefficients are positive and statistically significant (Table 2). The median (IQR) OR is 3.1 (2.4–3.9). Only one of the 210 coefficients is negative and significant. Approximately two-thirds (63.2%) of within-class coefficients are significant versus 33.0% of between-class coefficients. The median (IQR) significant within-class OR [3.9 (3.0–4.8)] is higher than the comparable between-class OR [2.9 (2.4–3.5)].
Predictive associations (percent significant and range of significant odds ratios) of temporally primary pure lifetime estimated DSM-IV disorder types with the subsequent first onset of other estimated DSM-IV disorders based on the best-fitting multivariate survival model (n=6483)Footnote a

OR, Odds ratio; ADHD, attention deficit hyperactivity disorder.
a Based on a discrete-time (person-year) survival model in which first lifetime onset of each of the 15 estimated DSM-IV disorders is predicted by 14 dummy variables for prior lifetime history of the other disorders, dummy variables for number of prior lifetime disorders (2 to ⩾7), and sociodemographic controls (sex, race/ethnicity, region of the country, urbanicity, parent education, number of biological parents with whom the adolescent lives, birth order, number of siblings, and age).
b Agoraphobia is assessed with or without panic disorder.
c Panic disorder is assessed with or without agoraphobia.
d Includes anorexia nervosa, bulimia nervosa and binge-eating disorder.
e With or without dependence.
f Includes bipolar I, bipolar II and subthreshold bipolar disorder.
g Percentage of coefficients that are significant at the 0.05 level using two-sides design-based significance tests.
h Range of significant ORs.
The same general pattern holds within each class of disorders, with 50.0–100% of within-class ORs being significant versus 15.9–64.3% of between-class coefficients. The percentage of significant between-class coefficients is much lower in predicting fear (15.9%) than other (29.6–64.3%) disorders. One or two disorders are the most powerful within-class predictors in each class: specific phobia and social phobia among the fear disorders; major depression for distress disorders; and ADHD and conduct disorders for behavior disorders. Fear disorders have the highest proportion of significant between-class coefficients predicting other disorders (52.3%), followed by distress (36.4%), behavior (29.6%) and substance (15.4%) disorders. Two of the three most consistent predictors are fear disorders [social phobia (81.8%) and specific phobia (72.7%)], the other being major depression (72.7%).
Coefficients associated with co-morbidity
The coefficients associated with number of predictor disorders in the best-fitting model represent predictive associations of co-morbidity expressed as deviations from the pure-disorder coefficients. For example, absent effects of co-morbidity, respondents with three predictor disorders having pure-disorder ORs of, say, 1.3, 1.5 and 1.7 would have an expected OR of 3.3 (i.e. 1.3×1.5×1.7). If the actual OR for these respondents is 4.0, then the number-of-disorders OR would be 1.2 (i.e. 4.0/3.3), indicating that the predictive effect of co-morbidity is 20% higher than expected from the pure-disorder coefficients. The best-fitting model assumes that these number-of-disorders coefficients are a function of each respondent's weighted number of predictor disorders, with weights defined by the pure-disorder coefficients.
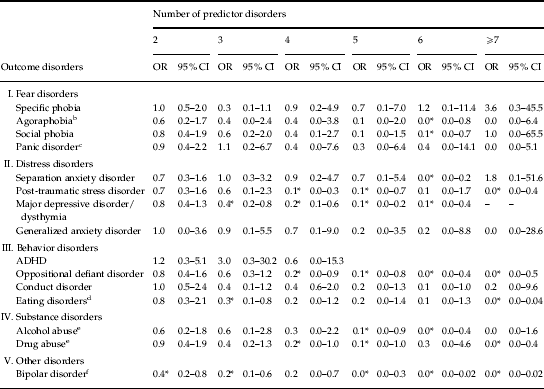
With this interpretation in mind, 87.2% of the number-of-disorder coefficients in the best-fitting model are less than 1.0 across equations, indicating a general pattern of subadditive interaction in the logistic specification; that is, a pattern in which the joint effects of the interacting predictors are significantly less than those estimated in a model that assumes that no interactions exist (Table 3). One-third of these subadditive coefficients are statistically significant whereas none of the ORs greater than 1.0 are significant. This pattern of the predictive associations of co-morbidity generally being less than the product of their parts becomes stronger as the number of disorders in the co-morbid profile increases from a median OR of 0.8 for two disorders to 0.1 for seven or more disorders.
Predictive associations (odds ratios) along with 95% confidence intervals (CIs) of number of lifetime estimated DSM-IV disorders with the subsequent first onset of other estimated DSM-IV disorders based on the best-fitting multivariate survival model (n=6483)Footnote a

OR, Odds ratio; ADHD, attention deficit hyperactivity disorder.
a Based on a discrete-time (person-year) survival model in which first lifetime onset of each of the 15 estimated DSM-IV disorders is predicted by 14 dummy variables for prior lifetime history of the other disorders, dummy variables for number of prior lifetime disorders (2 to ⩾7), and sociodemographic controls (sex, race/ethnicity, region of the country, urbanicity, parent education, number of biological parents with whom the adolescent lives, birth order, number of siblings, and age).
b Agoraphobia is assessed with or without panic disorder.
c Panic disorder is assessed with or without agoraphobia.
d Includes anorexia nervosa, bulimia nervosa and binge-eating disorder.
e With or without dependence.
f Includes bipolar I, bipolar II and subthreshold bipolar disorder.
* Significant at the 0.05-level, two-sided test.
PARPs
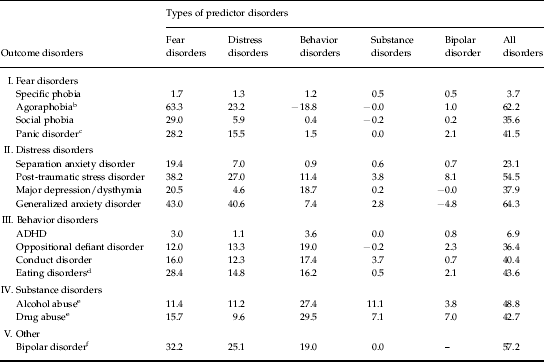
PARPs vary widely across outcomes (IQR 35.6–54.5%) (Table 4). The lowest PARPs in terms of the outcomes are associated with specific phobia (3.7%) and ADHD (6.9%), the two earliest-onset disorders. This reflects the low prevalence and generally insignificant association of prior disorders predicting these two disorders. A similar interpretation applies to SAD, the outcome disorder with the next lowest risk proportion (23.1%). SAD has a comparatively early AOO distribution and is predicted by a lower than average proportion of prior disorders. The other 12 disorders, when considered as outcomes, all have risk proportions of 35.0% or higher. Those with the highest risk proportions have comparatively late AOO distributions and are either significantly predicted by the majority of other disorders (alcohol abuse, bipolar disorder), very strongly predicted by a smaller number of other disorders (panic disorder, agoraphobia), or less strongly predicted by highly prevalent disorders (GAD).
Population attributable risk proportions (PARPs) of temporally primary lifetime estimated DSM-IV disorder types predicting subsequent first onset of other estimated DSM-IV disorders based on the best-fitting multivariate survival model (n=6483)Footnote a

ADHD, Attention deficit hyperactivity disorder.
a Based on a discrete-time (person-year) survival model in which first lifetime onset of each of the 15 DSM-IV/CIDI disorders is predicted by 14 dummy variables for prior lifetime history of the other disorders, dummy variables for number of prior lifetime disorders (2 to ⩾7), and sociodemographic controls (sex, race/ethnicity, region of the country, urbanicity, parent education, number of biological parents with whom the adolescent lives, birth order, number of siblings, and age).
b Agoraphobia is assessed with or without panic disorder
c Panic disorder is assessed with or without agoraphobia
d Includes anorexia nervosa, bulimia nervosa, and binge-eating disorder
e With or without dependence
f Includes bipolar I, bipolar II and subthreshold bipolar disorder.
Focusing on predictor disorders, the fear disorders have the highest PARPs in predicting nearly three-quarters of all outcome disorders, including other fear disorders, all four distress disorders, eating disorder, and bipolar disorder. There are only five exceptions: ADHD, where, as noted earlier, the risk proportion is very low overall; ODD and conduct disorders, where the highest risk proportions are associated with other behavior disorders; and substance disorders, where the highest risk proportions are associated with behavior disorders. As predictors, substance disorders consistently have the lowest risk proportions. Distress disorders generally have higher proportions than behavior disorders in predicting fear and distress disorders, but lower in predicting behavior and substance disorders.
Discussion
It is important to recognize that the analyses reported here focused on predictors of first onset of co-morbid conditions. The investigation of persistence is a separate matter that requires additional analysis not undertaken here. Furthermore, with regard to onset, the analysis examined only aggregate associations and did not consider the possibility of variation in the structure or predictors of co-morbidity in childhood versus adolescence, among boys versus girls, or by other potentially important subgrouping distinctions.
Three sample limitations are noteworthy: that the school-level response rate was fairly low, the individual-level response rate relatively low, and the sample excluded adolescents not enrolled in school. Methodological analysis reported elsewhere reduces concern about the first limitation, as no evidence of bias was found due to school replacement (Kessler et al. Reference Kessler, Avenevoli, Costello, Green, Gruber, Heeringa, Merikangas, Pennell, Sampson and Zaslavsky2009a ). The finding in previous methodological studies that non-respondents have higher rates of mental illness than respondents implies that the second limitation probably led prevalence estimates to be conservative, although estimates of predictive associations might be biased either upward or downward and differentially across predictor disorders (Kessler et al. Reference Kessler, Little and Groves1995). The third limitation reduces the external validity of findings.
Two limitations concerning measurement are also noteworthy: that diagnoses were based on lay interviews and questionnaires rather than clinical assessments and that lifetime diagnoses and AOO reports were based on retrospective recall rather than prospective data. Concern about the first limitations is somewhat reduced by the good concordance with clinical diagnoses (Kessler et al. Reference Kessler, Avenevoli, Green, Gruber, Guyer, He, Jin, Kaufman, Sampson and Zaslavsky2009c ). The second limitation presumably reduced lifetime prevalence estimates (Patten, Reference Patten2009; Moffitt et al. Reference Moffitt, Caspi, Taylor, Kokaua, Milne, Polanczyk and Poulton2010), distorted AOO reports (Simon & von Korff, Reference Simon and von Korff1995), and could have biased estimates of predictive associations differentially across disorders depending on between-disorder differences in failure to recall lifetime occurrence and/or AOO. It would be very valuable to correct these limitations by replicating the complex analyses carried out here with long-term longitudinal data.
As several prospective studies of child–adolescent mental disorders exist (Newman et al. Reference Newman, Moffit, Caspi, Magdol, Silva and Stanton1996; Pine et al. Reference Pine, Cohen, Gurley, Brook and Ma1998; Costello et al. Reference Costello, Mustillo, Erkanli, Keeler and Angold2003; Reinke & Ostrander, Reference Reinke and Ostrander2008), a question can be raised why retrospective analysis of the sort reported here has value. The answer is that most existing prospective studies, with a few notable exceptions (Wittchen et al. Reference Wittchen, Perkonigg, Lachner and Nelson1998; Olino et al. Reference Olino, Klein, Lewinsohn, Rohde and Seeley2010), did not obtain data on lifetime prevalence of mental disorders, making it impossible to carry out analyses of the associations between prior lifetime disorders and subsequent first lifetime onset of secondary disorders in the majority of such studies. Replication of the kinds of analyses reported here should be encouraged in the prospective studies that would support them. The results of the current analyses should be useful in providing preliminary hypotheses to be investigated in these prospective studies. This has traditionally been a major value of retrospective studies (Mantel & Haenszel, Reference Mantel, Haenszel, Buck, Liopis, Najera and Terris1988).
In the context of these limitations, the differential AOO patterns found here are consistent with considerable previous evidence that ADHD, specific phobia and SAD have the earliest age of onset and that generalized anxiety, depressive and substance disorders have the latest age of onset of the adolescent disorders considered here (Kessler et al. Reference Kessler, Amminger, Aguilar-Gaxiola, Alonso, Lee and Üstün2007). Very similar patterns were found in parallel analyses carried out previously in a cross-national sample of adults (Kessler et al. Reference Kessler, Ormel, Petukhova, McLaughlin, Green, Russo, Stein, Zaslavsky, Aguilar-Gaxiola, Alonso, Andrade, Benjet, de Girolamo, de Graaf, Demyttenaere, Fayyad, Haro, Hu, Karam, Lee, Lepine, Matchsinger, Mihaescu-Pintia, Posada-Villa, Sagar and Ustun2011). The high co-morbidity found among disorders is also consistent with previous evidence (Angold et al. Reference Angold, Costello and Erkanli1999).
The four-factor structure found in the NCS-A is also generally similar to findings from previous studies (Krueger, Reference Krueger1999; Vollebergh et al. Reference Vollebergh, Iedema, Bijl, de Graaf, Smit and Ormel2001; Watson, Reference Watson2005; Kessler et al. Reference Kessler, Avenevoli, Costello, Green, Gruber, Heeringa, Merikangas, Pennell, Sampson and Zaslavsky2009b ). Although several different specifications of the factor analysis model (e.g. at the person-level versus person-year level, with and without subthreshold bipolar disorder, with and without corrections for differential validity of diagnoses) yielded very similar results, replication in independent datasets is needed before considering this pattern stable.
One exception to the consistency of the NCS-A results with previous factor analyses is that SAD loaded with distress disorders in the NCS-A but with fear disorders in some previous studies (Lahey et al. Reference Lahey, Applegate, Waldman, Loft, Hankin and Rick2004). It is unclear why this occurred, but it is noteworthy that the loading of SAD on the distress factor was the weakest among all distress disorders and that SAD had the largest cross-loading with the fear factor of any distress disorder.
Another discrepancy with previous factor analysis studies is that substance disorders loaded separately from behavior disorders in the NCS-A. Substance and behavior disorders have generally loaded together in previous studies. However, this might reflect the fact that most previous factor analysis studies did not include as many behavior disorders as the NCS-A. The fact that substance and behavior disorders loaded separately in the NCS-A suggests that they have unique underlying psychopathological processes in adolescence (Krueger, Reference Krueger1999), a possibility that is indirectly consistent with the finding in behavior genetic studies that substance disorders have unique genetic loadings not shared with behavior disorders (Kendler et al. Reference Kendler, Prescott, Myers and Neale2003) that vary in importance across the life course (Kendler et al. Reference Kendler, Schmitt, Aggen and Prescott2008).
A final factor analysis result that warrants comment is that the summary measure of eating disorders in the NCS-A loaded with behavior disorders rather than with distress disorders. Previous research has generally found that anorexia nervosa is more strongly related than bulimia nervosa or binge-eating disorder to internalizing disorders (e.g. Godart et al. Reference Godart, Berthoz, Rein, Perdereau, Lang, Venisse, Halfon, Bizouard, Loas, Corcos, Jeammet, Flament and Curt2006), whereas bulimia nervosa and binge-eating disorder are strongly related to behavioral disorders (e.g. Marmorstein et al. Reference Marmorstein, von Ranson, Iacono and Succop2007). It is relevant in this regard that the vast majority of NCS-A respondents with eating disorders had bulimia nervosa or binge-eating disorder rather than anorexia nervosa.
The finding of stronger within-class than between-class predictive associations is consistent with previous longitudinal studies of prevalent disorders among youth (Newman et al. Reference Newman, Moffit, Caspi, Magdol, Silva and Stanton1996; Costello et al. Reference Costello, Mustillo, Erkanli, Keeler and Angold2003; Reinke & Ostrander, Reference Reinke and Ostrander2008), although we are unaware of previous comparable studies of first onset of lifetime disorders. Comparable results were also found in our previous cross-national study of the development of co-morbidity among adults (Kessler et al. Reference Kessler, Ormel, Petukhova, McLaughlin, Green, Russo, Stein, Zaslavsky, Aguilar-Gaxiola, Alonso, Andrade, Benjet, de Girolamo, de Graaf, Demyttenaere, Fayyad, Haro, Hu, Karam, Lee, Lepine, Matchsinger, Mihaescu-Pintia, Posada-Villa, Sagar and Ustun2011). The finding that fear disorders are the most important between-class predictors is consistent with, but goes beyond, previous research showing that early-onset anxiety disorders predict later distress disorders (Lewinsohn et al. Reference Lewinsohn, Gotlib and Seeley1995; Pine et al. Reference Pine, Cohen, Gurley, Brook and Ma1998; Stein et al. Reference Stein, Fuetsch, Muller, Hofler, Lieb and Wittchen2001; Costello et al. Reference Costello, Mustillo, Erkanli, Keeler and Angold2003). Substance use disorders, at the other extreme, generally do not predict later disorders but are predicted strongly by earlier disorders. Although associations of behavior disorders with later substance disorders are well documented (Costello et al. Reference Costello, Erkanli, Federman and Angold1999; Fergusson et al. Reference Fergusson, Horwood and Ridder2007), the predictive associations of primary fear and distress disorders have been less consistently examined (Costello et al. Reference Costello, Mustillo, Erkanli, Keeler and Angold2003).
The asymmetric associations across time-lagged disorder pairs could be due either to unmeasured common causes (e.g. genetic influences) or to causal influences of the predictor disorders on outcome disorders. There is no definitive way to distinguish these two possibilities with either retrospective or prospective non-experimental data. To the extent that the primary disorders are causes, however, successful early intervention might help to prevent the onset of subsequent co-morbid disorders. To the extent that predictive associations are due to underlying common causes, temporally primary disorders might be useful risk markers (Kraemer et al. Reference Kraemer, Kazdin, Offord, Kessler, Jensen and Kupfer1997) in targeting indicated interventions. Fear disorders stand out as especially important in the latter regard because they are such consistently strong predictors of later disorders. It is noteworthy in this regard that childhood-onset specific phobias can often be treated very effectively with inexpensive exposure-based therapies (Gros & Anthony, Reference Gros and Antony2006; Hamm, Reference Hamm2009).
We are aware of no previous broad-based analysis of lifetime co-morbidity predicting the subsequent first onset of a range of secondary disorders other than our own prior cross-national cross-section study of adults (Kessler et al. Reference Kessler, Ormel, Petukhova, McLaughlin, Green, Russo, Stein, Zaslavsky, Aguilar-Gaxiola, Alonso, Andrade, Benjet, de Girolamo, de Graaf, Demyttenaere, Fayyad, Haro, Hu, Karam, Lee, Lepine, Matchsinger, Mihaescu-Pintia, Posada-Villa, Sagar and Ustun2011). Our finding of largely subadditive predictive associations of co-morbid disorders, which we also found in our adult study, is consequently unique. It is important to note that this subadditivity is based on a logistic model, which means that an additive specification with a linear or other link function might fit the data. However, our efforts to find an alternative link function that provided a better fit of the data with an additive specification was unsuccessful. This subadditive pattern has potentially important implications for intervention because it suggests that intervening with a single co-morbid disorder might not be effective in preventing subsequent disorder onset, as incremental predictive effects of individual disorders decrease with the number of other disorders. To the extent that primary disorders are causes, treatment of the entire cluster of co-morbid disorders is likely to be more effective than treatment of individual primary disorders in secondary prevention among patients with co-morbidity (Moses & Barlow, Reference Moses and Barlow2006). Perhaps even more important, however, we have shown that the innovative methodology used here yields substantively plausible results. Although many of these results do little more than replicate previous findings, the methodology has the potential to yield much more nuanced results when applied, as we hope it will be in the future, to prospective datasets.
Acknowledgements
The NCS-A is supported by the National Institute of Mental Health (NIMH; U01-MH60220, R01-MH66627 and U01MH060220-09S1) with supplemental support from the National Institute on Drug Abuse (NIDA), the Substance Abuse and Mental Health Services Administration (SAMHSA), the Robert Wood Johnson Foundation (RWJF; Grant 044780), and the John W. Alden Trust. The work of Dr Merikangas is supported by the NIMH Intramural Research Program. The work of Dr Zaslavsky is supported by NIMH Grant R01-MH66627. A complete list of NCS-A publications can be found at www.hcp.med.harvard.edu/ncs. A public use version of the NCS-A dataset is available for secondary analysis. Instructions for accessing the dataset can be found at www.hcp.med.harvard.edu/ncs/index.php. The NCS-A is carried out in conjunction with the World Health Organization World Mental Health (WMH) Survey Initiative. We thank the staff of the WMH Data Collection and Data Analysis Coordination Centres for assistance with instrumentation, fieldwork and consultation on data analysis. The WMH Data Coordination Centres have received support from NIMH (R01-MH070884, R13-MH066849, R01-MH069864, R01-MH077883), NIDA (R01-DA016558), the Fogarty International Center of the National Institutes of Health (FIRCA R03-TW006481), the John D. and Catherine T. MacArthur Foundation, the Pfizer Foundation, and the Pan American Health Organization. The WMH Data Coordination Centres have also received unrestricted educational grants from AstraZeneca, Bristol-Myers Squibb, Eli Lilly & Company, GlaxoSmithKline, Ortho-McNeil, Pfizer, Sanofi-Aventis, and Wyeth. A complete list of WMH publications can be found at www.hcp.med.harvard.edu/wmh/. The views and opinions expressed in this report are those of the authors and should not be construed to represent the views of any of the sponsoring organizations, agencies, or the US Government. All authors had full access to the survey data. Dr Kessler takes responsibility for the integrity of the data and the accuracy of the data analysis.
Declaration of Interest
R. C. Kessler has been a consultant for AstraZeneca, Analysis Group, Bristol-Myers Squibb, Cerner-Galt Associates, Eli Lilly & Company, GlaxoSmithKline Inc., HealthCore Inc., Health Dialog, Integrated Benefits Institute, John Snow Inc., Kaiser Permanente, Matria Inc., Mensante, Merck & Co., Inc., Ortho-McNeil Janssen Scientific Affairs, Pfizer Inc., Primary Care Network, Research Triangle Institute, Sanofi-Aventis Groupe, Shire US Inc., SRA International, Inc., Takeda Global Research & Development, Transcept Pharmaceuticals Inc., and Wyeth-Ayerst; has served on advisory boards for Appliance Computing II, Eli Lilly & Company, Mindsite, Ortho-McNeil Janssen Scientific Affairs, and Wyeth-Ayerst; and has had research support for his epidemiological studies from Analysis Group Inc., Bristol-Myers Squibb, Eli Lilly & Company, EPI-Q, GlaxoSmithKline, Johnson & Johnson Pharmaceuticals, Ortho-McNeil Janssen Scientific Affairs., Pfizer Inc., Sanofi-Aventis Groupe, and Shire US, Inc.