I. INTRODUCTION
Environmental pollution is a global problem, which has attracted great attention of human being. Semiconductor photocatalysis is one of the environmentally friendly processing technologies rising in recent years.Reference Zhang, Xia, Shang, Wallenmeyer, Katelyn, Peterson, Murowchick, Dong and Chen1–Reference Sofianou, Tassi, Psycharis, Boukos, Thanos, Vaimakis, Yu and Trapalis4 It was given intensive attention in environmental improvement, especially in degradation, mineralization of organic pollutants in water owing to its simple equipments, mild reaction conditions, low energy consumption, and less secondary pollution.Reference Sun, Yin, Fan, Huang, Qu, Du, Chen and Ma5–Reference Tao, Han, Cheng, Liu, Wei, Ting and Yin8 High efficient photocatalysts is the core of photocatalysis technology. BiOX (X = Cl, Br, I) compounds, a class of semiconductors, have highly anisotropic layered structure that contributes to the fast separation of photo-generated electrons and holes and charge transfer. Also, its ability of light absorption could be controlled and adjusted elaborately through the species and content of the halogens in compound, and light absorption can be extended from ultraviolet to visible light region. Therefore, BiOX semiconductors always display obviously photocatalytic activity in degradation of organic pollutants to CO2 and H2O.Reference Chen, Huang, Xiong, Yuan, He, Jia, Yao, Luo, Au and Yin9–Reference Xiao, Zhu, Zhu and Qian12
The microstructure, composition, morphology and crystallinity of BiOX have a significant impact on their photocatalytic efficiency. For example, BiOX1−xYx photocatalyts formed by two halogen elements have higher activity than that of pure BiOX and BiOY.Reference Gnayem and Sasson13,Reference Mao and Fan14 In addition, semiconductor coupling,Reference He, Shi, Gao, Wen, Chen and Song15–Reference Jiang, Zhang, Sun and Zhang17 noble metal depositionReference Cui, Mi, Fa, Zhen and Zeng18–Reference Ye, Liu, Gong, Tian, Peng and Zan20 and surface morphology modificationReference Chen, Huang, Xiong, Yuan, He, Jia, Yao, Luo, Au and Yin9,Reference Cui, An, Liu, Hu and Liang21 can also effectively promote their photocatalytic performance. Xia et al.Reference Xia, Yin, Li, Hui, Yan and Zhang22 used ionic liquid to fabricate hollow BiOI aggregations which showed higher visible photocatalytic activity than corresponding BiOI nanoflakes. Yu et al.Reference Zhang, Wen, Jiang, Li and Yu23 found that BiOBr microsphere has stronger ability to capture light and more easily absorbs heavy metals and dyes in aqueous solution. Three dimensional microspheres assembled by the units of nanoparticles, nanorods, nanosheets, usually have advantages in large specific surface area, easy separation, rich interface, and good stability.Reference Yu, Cao, Li, Li, Xie, Yu, Shu and Fan24–Reference Yu, Yang, Xie, Fan, Yu, Shu and Wang26 The relationships between microstructure, thermostability, and photocatalytic activity of BiOX (X = Cl, Br, I) were explored. Our previous research indicated that BiOCl has good thermostability and no new halogen oxide was produced during its calcination process. But new phases of Bi24O31Br10 and Bi5O7I were generated respectively in the calcination processes of BiOBr and BiOI.Reference Fan27–Reference Yu, Fan, Yu, Zhou and Yang29 The appearance of new compounds formed in phase transition could largely change the photocatalytic performance.
In this study, BiOCl0.5Br0.5 composite microspheres were firstly prepared by coprecipitation method. Then the effects of calcination temperature on the morphology, composition, and structure of BiOCl0.5Br0.5 composite microspheres and photocatalytic performance in degradation of Rhodamine B (RhB) were investigated. It was found that although the composition of microspheres varied during high temperature calcination, its microspheric morphology maintained intact. The calcination under proper temperature obviously enhanced the photocatalytic performance of BiOCl0.5Br0.5 microspheres.
II. EXPERIMENTAL
The catalyst was prepared by co-precipitation. Amount of (0.01 mol) Bi(NO3)3·5H2O was dissolved in 10 mL glacial acetic acid, obtained solution A; 0.005 mol NaCl, 0.005 mol NaBr, and 0.02 mol CH3COONa were dissolved in 10 mL deionized water, obtained solution B. Under vigorous stirring, solution A was quickly added into the solution B and the mixed solution was further stirred for 12 h. The produced precipitate was collected by centrifugation, washed several times with deionized water and ethanol, respectively. Dried in an oven at 80 °C and BiOCl0.5Br0.5 composite microspheres was fabricated. BiOCl and BiOBr were synthesized by the same method. In air atmosphere, BiOCl0.5Br0.5 composite microspheres were calcined at different temperatures in muffle for 120 min with a heating rate of 5 °C/min. The calcination temperatures were 350, 400, 450, 500, 600, 700, and 800 °C, respectively.
The crystallinity and crystal phase of the samples were obtained on a Bruker D8 Advance x-ray diffraction meter (XRD; Bruker, Karlsruhe, Germany) using Cu Kα radiation (λ = 0.15418 nm) with a scan range of 10–90°. The accelerating voltage and the applied current were 40 kV and 40 mA, respectively. The Brunauer, Emmett, and Teller (BET) surface areas of the samples were obtained from N2 adsorption combined with the BET equation on an automatic analyzer (ASAP 2020; Micrometrics, Norcross, Georgia). UV-Vis diffuse reflectance spectra (DRS) were determined by a UV-Vis spectrophotometer (UV-2550; Shimadzu, Kyoto, Japan). Absorption spectra were referenced to BaSO4. The Fourier transform infrared (FT-IR) spectra were recorded on a Nicolet-470 FTIR spectrometer (Thermo Fisher Scientific, Inc., Waltham, Massachusetts) with resolution of 4 cm−1. The microstructure of the samples were measured using a Philips XL30 scanning electron microscope (SEM) (FEI, Eindhoven, The Netherlands). Using thermogravimetric analyzer (TGA-2950) to analyze the thermostability of the samples with a heating rate of 10 °C/min in air flow (30 mL/min).
The photocatalytic activities of the samples were determined by measuring the degradation of RhB dye in an aqueous solution under visible light irradiation. A 300 W halogen lamp was used as light source placed in a quartz tube and circulating water in outer casing was used to cool quartz tube. The photocatalyst (0.05 g) was suspended in 80 mL 10 ppm RhB aqueous solution. The suspension was stirred by magnetic force during the degradation process, and the reaction temperature was maintained at 20 °C by circulation of water. Before light irradiation, the suspension was stirred in dark for 40 min to achieve physical adsorption/desorption equilibrium between catalyst and reaction substrate. After fixed intervals of illumination, 3 mL suspension was taken out and centrifuged to remove catalyst particles. The clear upper layer solution was analyzed using a UV-Vis spectrophotometer (UV-2550). The absorbance was recorded at λ = 554 nm, which is the maximum absorption wave length of RhB. The degradation rate (D) of dye was calculated according to the equation: D = (A 0 − A)/A 0 × 100% (A 0: initial absorbance; A: final absorbance).
III. RESULTS AND DISCUSSION
Figure 1 shows the XRD patterns of all the prepared samples. It was found that BiOCl and BiOBr have almost the same diffraction peaks corresponding to the standard spectra of JCPDS Nos. 01-073-2060 and 01-073-2061 in data base, respectively, which indicated that their crystal structures are tetragonal with space group for P4/nmm(129). We also can see that no characteristic peaks of other impurities were observed from XRD patterns of BiOCl0.5Br0.5 composite microspheres. Over BiOCl0.5Br0.5, the characteristic peaks of both BiOCl and BiOBr were observed, which suggests that two phases of BiOCl and BiOBr coexist in the form of tetragonal crystal system. According to the reported results of Mao's,Reference Mao and Fan14 the radius of Cl− (1.70 Å) is smaller than Br− (1.82 Å). So we could infer that Cl− was incorporated in BiOBr lattice or entered its interstitial sites. Based on Bragg equation: 2d sin θ = nλ, d decreases will lead to the increase of θ and the diffraction peaks shift to the direction of larger angle. Therefore, compared with pure BiOBr, the diffraction peak of BiOCl0.5Br0.5 slightly shifts to the right direction, from which we could determine that part of Br atoms could be replaced by Cl atoms, thus forming the BiOCl0.5Br0.5 solid solution.
The XRD patterns of the samples without calcination and calcined at different temperature.

Figure 1 also shows the XRD patterns of BiOCl0.5Br0.5 composite samples without calcination and calcined at different temperatures. As it is shown that no new diffraction peaks appear when the samples were calcined at temperature below 500 °C, suggesting no phase transition occurs. With the increase in calcination temperature, the intensity of the characteristic diffraction peak at (110) crystal plane increased, which indicated that optimal calcination temperature benefits to the improvement of crystallinity. When calcination temperature arrives at 500 and 600 °C, the diffraction peak at (110) becomes weaker, and new diffraction peaks appear at 2θ = 29.10°, 29.58°, 31.28°, and 31.96°. These new diffraction peaks were attributed to the characteristic peaks at  $\left( {30\bar 4} \right)$,
 $\left( {21\bar 3} \right)$,
 $\left( {10\bar 10} \right)$, and (217) planes of Bi24O31Br10 (JCPDS No. 01-070-4762) with monoclinic system, space group A2/m(12). After calcination at 700 and 800 °C, the diffraction peak of (110) plane further weakened and even disappeared. While the peaks of Bi24O31Br10 phase become more obvious and another new diffraction peak at 30.03° was observed. This weak peak was corresponding to monoclinic phase, (217) plane of Bi24O31Cl10 (JCPDS No. 01-070-4761) with space group P2/c(13). The XRD analysis suggests that when calcination temperature is over 500 °C, BiOCl0.5Br0.5 composite sample gradually releases bromine element and phase transition takes place at the same time.
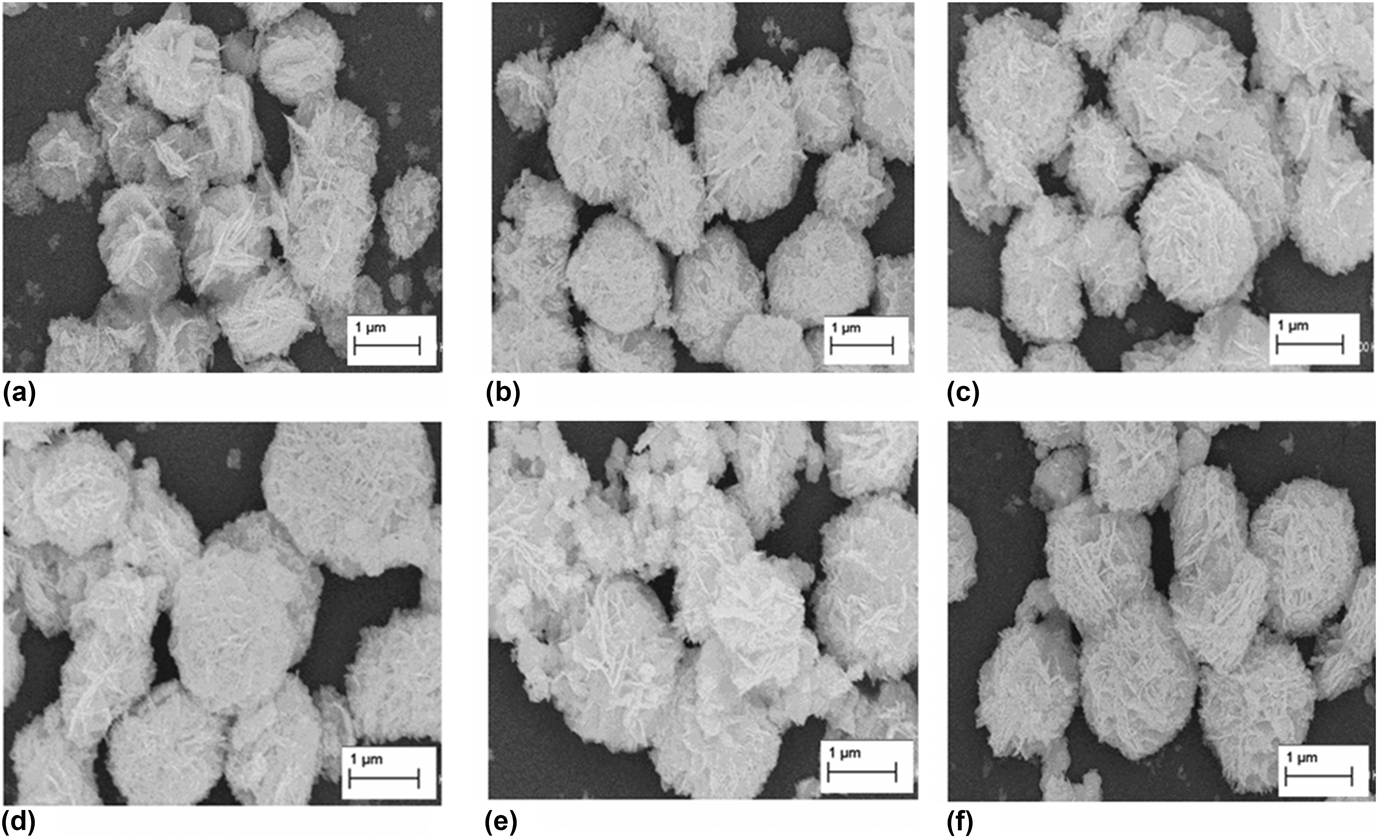
Figure 2 shows the typical SEM images of the fabricated samples, including BiOCl0.5Br0.5 microspheres and samples calcined at 350, 400, 450, 500, and 600 °C, respectively. As we can see from Fig. 2(a), before calcination, BiOCl0.5Br0.5 displays flower-like microsphere morphology with a diameter of 1–1.5 μm. The microspheres are composed of a large quantity of uniform sheet-shape particles. As shown in Figs. 2(b)–2(d), after calcination at 350, 400, and 450 °C, some tiny particles are disappeared and the microspheres become more regular. Three-dimensional microspheres assembled by nanosheets could promote the dye adsorption and light absorption due to rich interface and good stability. As shown in Figs. 2(e) and 2(f), it is interesting to find that the microsphere morphology of catalyst was maintained, which indicates that the composite microspheres have high stability. These BiOCl0.5Br0.5 microspheres are different from some spherical catalysts which are easy to collapse and broken down into individual particles after calcination. Although the former XRD analysis shows the phase transition takes place at high temperature calcination, BiOCl0.5Br0.5 almost maintain its original morphology.
SEM images of BiOCl0.5Br0.5 samples. (a) no calcination; (b) calcined at 350 °C; (c) calcined at 400 °C; (d) calcined at 450 °C; (e) calcined at 500 °C; (f) calcined at 600 °C.
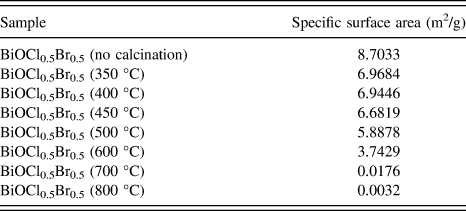
The BET surface areas of the BiOCl0.5Br0.5 before and after calcination are shown in Table I. The specific surface area decreased gradually after calcination at the temperatures from 350 to 500 °C. At very high temperatures from 600 to 800 °C, a rapid decrease in surface area occurred. According to former SEM analysis, although there is no big change in the overall morphology of catalyst during heat treatment, the small particles will sinter, which could be the main reason for the loss of surface area.
Specific surface area, i.e., BET surface area, of the samples.
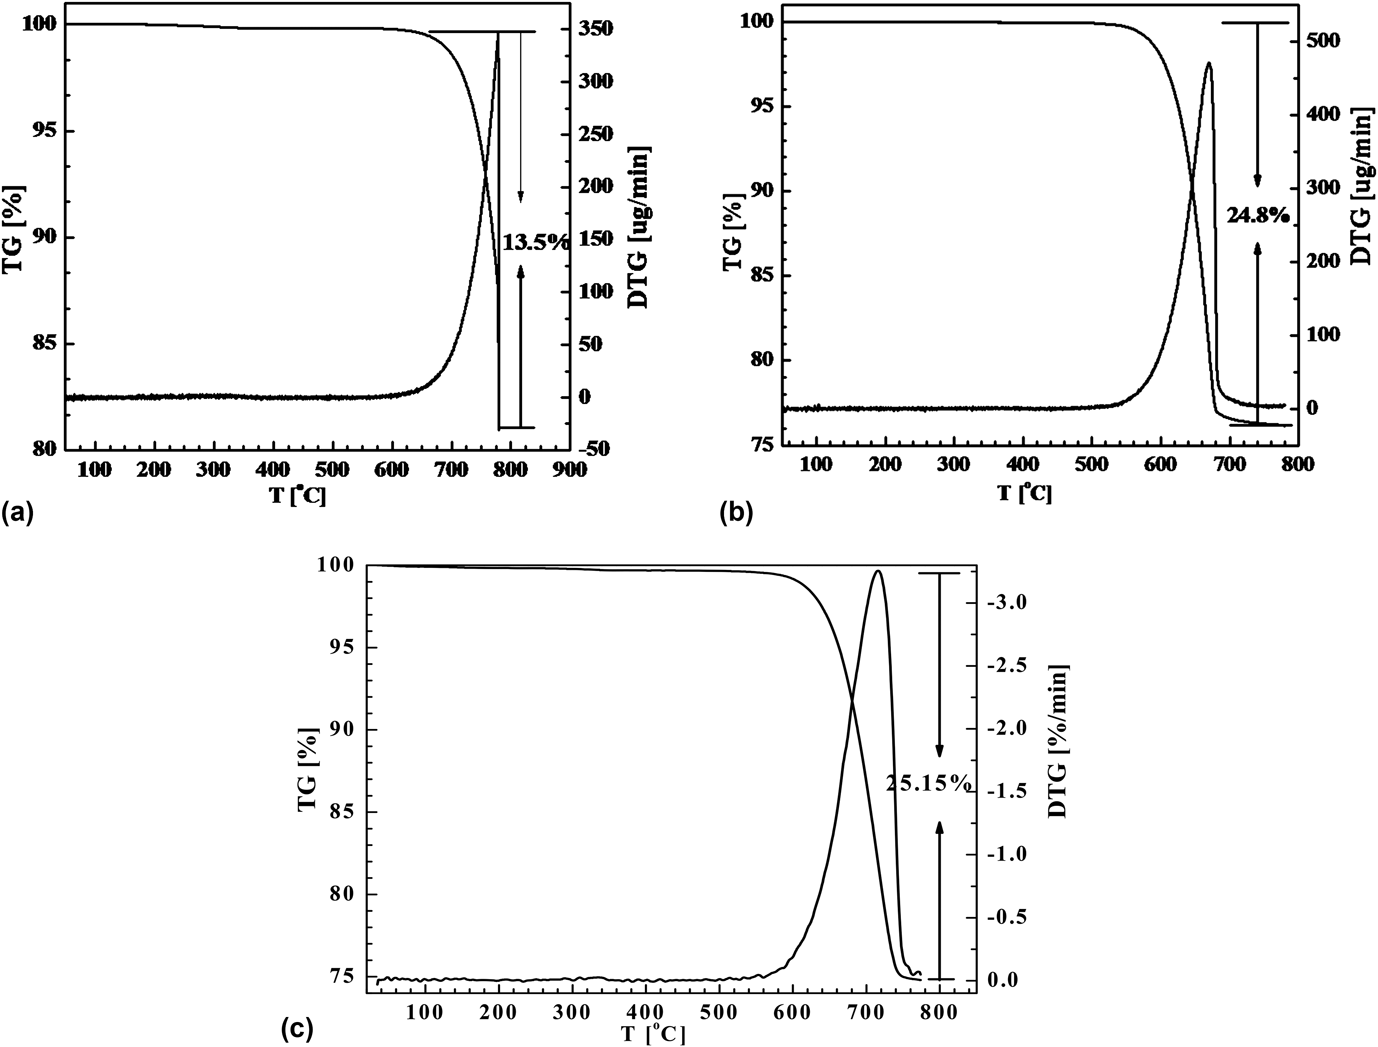
The thermostability and phase transition of BiOCl, BiOBr, and BiOCl0.5Br0.5 were further investigated by TG analyzer in air atmosphere. Figure 3 shows the TG–DTG curve graphs of the three samples. From Figs. 3(a) and 3(b), it can be seen that BiOCl and BiOBr begin to decompose at 650 and 520 °C, respectively. While the weight loss of BiOCl0.5Br0.5 occurs at 575 °C, suggesting its thermostability is between BiOCl and BiOBr and BiOCl is the most stable compound. BiOCl0.5Br0.5 composite sample begins to lose weight at 575 °C. From 575 to 750 °C, the total weight decrease is about 25.15% and the maximum weight loss rate takes place at 716 °C. At 750 °C, the BiOBr could completely transform into Bi2O3 via Bi24O31Br10, while according to the results of XRD analysis, only part BiOCl turn into Bi24O31Cl10 at this temperature. As for BiOCl0.5Br0.5 composite, its stability is lower than BiOCl and the possible transformation reaction is indicated as following: 4BiOCl0.5Br0.5 + O2 → 2Bi2O3 + Cl2 + Br2 (i); 4BiOCl + O2 → 2Bi2O3 + 2Cl2 (ii). The total weight loss in Eqs. (1) and (2) is around 27.13% which is almost consistent with the result of TGA.
TG–DTG curves of the samples. (a) BiOCl; (b) BiOBr; (c) BiOCl0.5Br0.5.
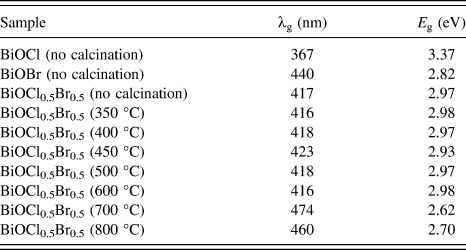
The light absorption ability of the samples at different wavelengths was analyzed by UV-Vis DRS and the results are shown in Fig. 4. The band gap energy (E g) for the catalyst was calculated with E g = 1240/λg, where λg is the absorption edge, which was obtained from the intercept between the tangent of the absorption curve and the abscissa. The calculated band gap energies of the different samples are listed in Table II. Figure 4 shows that all samples have strong UV-light absorption from 200 to 350 nm. Single BiOCl has no absorption in the visible light range and its absorption edge is around 370 nm. BiOBr absorption edge is about 440 nm and has certain ability of absorption in visible light region. With respect to BiOCl, the light absorption of BiOCl0.5Br0.5 obviously shifts to visible light region. After calcination treatment, light absorption of BiOCl0.5Br0.5 moves to the direction of long wave length. The total variation trend is that with the increase of calcination temperature, the absorption edge gradually shifts to the direction of long wavelengths. These results indicate that heat treatment at optimum temperature could improve the visible light absorption.
UV-Vis DRS of BiOCl, BiOBr and BiOCl0.5Br0.5 samples without calcination and calcined at different temperatures.
Light absorption edge and band gap of the samples.
Figure 5 gives the infrared spectra of all samples, from which we can analyze the changes in the surface properties of BiOCl0.5Br0.5 before and after calcination. All samples have a wide peak at 3440 cm−1 which is assigned to the stretching vibration and bending vibration of surface –OH groups formed from the surface adsorption of water. Based on some Reference Umadevi, Sangari, Parimaladevi, Sivanantham and MayandiRefs. 30 and Reference Yu, Yu and Chan31, in photocatalytic reaction, the photocatalytic activity is closely related to the amount of –OH groups on the catalysts surface, because –OH can capture the photo-generated hole (h+) and transform to ˙OH radicals. The capturing of h+ also accelerates the separation of h+ and photo-generated electronic (e−), which makes more e− react with O2 to produce O2–˙ radicals. Both ˙OH and O2−˙ radicals can effectively decompose organic dyes. As we can see from this figure, in certain calcination temperature range (from 350 to 500 °C), the calcination leads to a slight increase in the intensity of –OH. However, elevated temperature (from 600 to 800 °C) caused a big decrease in intensity of –OH, which could be attributed to the surface dehydroxylation reaction and the loss of surface area. The absorption peak at 1640 cm−1 was assigned to bending vibration of free water (H–O–H) on the surface of the material and the intensity gradually weakened with the increase of calcination temperature. The peak at 500 cm−1 was attributed to the stretching vibration of the Bi–O bond. In the temperature range (from 350 to 500 °C), the intensity of this peak becomes strong gradually, suggesting more Bi–O bonds were produced. However, the intensity of this peak began decreasing when the temperature increased to 700, 800 °C, which was caused by the changes in composition and structure of BiOCl0.5Br0.5.
FT-IR spectra of BiOCl0.5Br0.5 samples without calcination and calcined at different temperatures.
The photocatalytic activities of the samples were evaluated by measuring the degradation of RhB in an aqueous solution under visible light irradiation. Figure 6 displays the effect of calcination temperature on photocatalytic activity of BiOCl0.5Br0.5. Compared with the original sample, the calcination from 350 to 450 °C resulted obvious increase in activity and the degradation rate of RhB reached to the maximum value (92.2%). The analysis results of XRD, SEM, TG, and IR indicates that when BiOCl0.5Br0.5 was calcined at temperatures below 450 °C, the crystallinity of BiOCl0.5Br0.5 increased and rich surface –OH groups appeared. At the same time, the best spherical morphology was produced. These factors benefited the improvement in activity. The increase in crystallinity could accelerate separation rate of photo-generated electrons and holes, then produced more active free radicals to speed up the degradation of dye, thus resulting in enhancement in catalytic activity. In addition, the results of XRD shows that when calcination temperature is below 450 °C, there is no change in the composition of BiOCl0.5Br0.5. The enhanced photocatalytic activity was also related to the energy and structure of compound. The E VB of BiOCl and BiOBr were calculated to be 3.60 and 3.11 eV, respectively. Thus, the E CB of BiOCl and BiOBr were estimated to be 0.12 and 0.27 eV, respectively. The VB edge of BiOBr could rise up to a higher potential (0.11 eV)Reference Zhang, Zhang, Xie and Wang32 edge under visible light irradiation. As shown in Fig. 7, the CB edge potential of BiOBr is negative than that of BiOCl, the photoinduced electrons on the BiOBr surface can easily transfer to the CB of BiOCl because of the inner field strength, following the reaction with O2 adsorbed on the surface to produce ˙O2−. Thus, the photoinduced holes and electrons could separate effectively and react with H2O to produce ˙OH. In this way, the composite could effectively reduce the recombination of photoinduced carrier, and produce more active species to take part in photodegradation process.
Effects of calcination temperature on the photocatalytic activity of BiOCl0.5Br0.5 (a) the change dye concentration versus time; (b) degradation rate of dye after 40 min irradiation.
The band structure of the composite and the possible charge transfer process.
However, a further increase in calcination temperature produced a big negative effect on activity. When calcined at 700 and 800 °C, the catalysts displayed very weak degradation activity. The TG analysis shows that BiOCl0.5Br0.5 began to decompose at 575 °C. The variation in composition may cause the decrease in activity. When the calcination temperature exceeded 700 °C, although the catalyst maintained spherical morphology, the prime and small particles sintered and agglomerated, which caused the descend of dispersion. At the same time, the decrease in specific surface area and –OH group number directly affected the substrate adsorption and light absorption, in turn leading to the decrease of activity. Despite of the absorption edge took place redshift when the sample calcined over 700 °C, as shown UV-Vis, the trend of declining in catalytic activity has not been reversed, because the physical structure and surface properties of catalyst has played a leading negative role at this point.
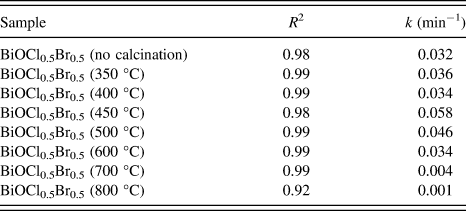
To quantitatively understand the reaction kinetics of the RhB degradation over different samples, pseudo-first order kinetics equation ln(C 0/C) = kt was used to calculate the rate constants of all the samples,Reference Yu, Fan, Yu, Zhou and Yang29 where C 0 and C are the concentrations of dye in the solution at time 0 and t, respectively, and k is the pseudo-first order rate constant. The first order kinetics regression analysis results obtained from the dates of catalytic reaction in Fig. 6 are listed in Table III. A rather good correlation with pseudo-first order reaction kinetics (R 2 ≥ 0.92) was found. And the highest reaction rate constant was 0.058 min−1 for the BiOCl0.5Br0.5 calcined at 450 °C.
The first-order reaction rate constant (k) of the catalysts in degradation of RhB over different photocatalysts.
Figure 8 shows the changing curve with different time decomposed processes for photocatalytic degradation of RhB under visible light irradiation. It was found that with the increasing of irradiation time, the absorption peak at 554 nm drops constantly, blue-shifts and turns broadened at the same time. This agrees well with the relevant reports,Reference Zhao, Chen, Li, Zhao, Hidaka and Serpone33 the blue-shift of absorption band is attributed to the de-ethylation of RhB. When the de-ethylated process is fully completed, the absorption band shifts to about 498 nm and RhB turns to rhodamine. Then rhodamine is gradually decomposed due to the destruction of the conjugated structure.
Temporal evolution of the absorption spectrum of the RhB solution under visible light irradiation, BiOCl0.5Br0.5 calcined at 450 °C.
The stability of photocatalytic property was estimated using sample BiOCl0.5Br0.5 calcined at 450 °C. As shown in Fig. 9, after four times recycle photocatalytic tests, no more decrease in photocatalytic activity was detected, which indicated that BiOCl0.5Br0.5 microspheres have good stability.
Stability of photocatalytic property for BiOCl0.5Br0.5 calcined at 450 °C.
IV. CONCLUSIONS
1–1.5 μm BiOCl0.5Br0.5 composite microspheres were successfully prepared by coprecipitation method. The produced BiOCl0.5Br0.5 microspheres were calcined at different temperatures. The thermostability of the samples and the effects of calcination temperature on photocatalytic performance in degradation of RhB were investigated. It shows that the thermostability of BiOCl0.5Br0.5 microspheres is between BiOCl and BiOBr. Although BiOCl0.5Br0.5 began to lose weight and decompose at 575 °C, the overall microsphere morphology is maintained well. Calcination below 500 °C could obviously improve crystallinity and increase photocatalytic activity. When the calcination temperature was increased to even high temperatures (600, 700, 800 °C), phase transition occurred over BiOCl0.5Br0.5, Br element was gradually released, and Bi24O31Br10 new phase appeared. The band gap energy gradually decreased with the increase of calcination temperature. But very high calcination temperature resulted in the sintering of small particles, the loss of specific surface area and surface hydroxyl decrease, thus leading to a large decrease in photocatalytic activity.
ACKNOWLEDGMENTS
This work was financially supported by the National Natural Science Foundation of China (Nos. 21567008, 21067004, 21263005), Jiangxi Province Natural Science Foundation of Youth Science Fund Program (No. 20133BAB21003), Jiangxi Province Education Department of Science and Technology Project (No. KJLD14046), Jiangxi Province Yuan Hang Gong Cheng Project (No. 2014-154), Jiangxi Province Youth Scientists Cultivating Object Program (No. 20122BCB23015), Jiangxi Province Graduate Student Innovation Foundation Project 2014 (Nos. 3104000089, 3104100013), Jiangxi University of Science and Technology Graduate Student Innovation Foundation Project 2013 (No. 3104100039).