Introduction
Rab proteins are the largest branch of the Ras superfamily of GTPases. They modulate vesicle-mediated transport processes in both biosynthetic/secretory and endocytic pathways, particularly in docking, tethering and fusion of the transport vesicles with their target membranes (reviewed by Martinez & Goud, Reference Martinez and Goud1998). Although most Rab GTPases are ubiquitously expressed in a variety of cell types, some Rabs are distributed in a cell type- or tissue-specific fashion. Different Rabs are distributed in distinct intracellular compartments, which correlate with their function in regulating protein transport between these compartments. For example, Rab3 exists only in neurons and neuroendocrine cells (Darchen et al., Reference Darchen, Zahraoui, Hammel, Monteils, Tavitian and Scherman1990; Fischer von Mollard et al., Reference Fischer Von Mollard, Mignery, Baumert, Perin, Hanson, Burger, Jahn and Sudhof1990) and specifically modulates neurotransmitters.
Rab1 and Rab6 are localized in the endoplasmic reticulum (ER) and the Golgi apparatus and work as a pair to modulate vesicle-mediated cargo transport between these two compartments. Specifically, Rab1 regulates anterograde transport of newly synthesized proteins from the ER to the Golgi (Plutner et al., Reference Plutner, Cox, Pind, Khosravi-Far, Bourne, Schwaninger, Der and Balch1991; Tisdale et al., Reference Tisdale, Bourne, Khosravi-Far, Der and Balch1992; Nuoffer et al., Reference Nuoffer, Davidson, Matteson, Meinkoth and Balch1994; Jedd et al., Reference Jedd, Richardson, Litt and Segev1995; Saraste et al., Reference Saraste, Lahtinen and Goud1995; Wu et al., Reference Wu, Zhao and He2003; Filipeanu et al., Reference Filipeanu, Zhou, Claycomb and Wu2004, Reference Filipeanu, Zhou, Fugetta and Wu2006), whereas Rab6 modulates retrograde protein transport from the Golgi to the ER (Goud et al., Reference Goud, Zahraoui, Tavitian and Saraste1990; Antony et al., Reference Antony, Cibert, Geraud, Santa Maria, Maro, Mayau and Goud1992; Jasmin et al., Reference Jasmin, Goud, Camus and Cartaud1992; Deretic & Papermaster, Reference Deretic and Papermaster1993; Tixier-Vidal et al., Reference Tixier-Vidal, Barret, Picart, Mayau, Vogt, Wiedenmann and Goud1993; Feldmann et al., Reference Feldmann, Durand-Schneider and Goud1995; Johannes et al., Reference Johannes, Tenza, Antony and Goud1997; Dong & Wu, Reference Dong and Wu2007). Both Rab1 and Rab6 GTPases have been found in the outer retina and likely play an important role in maintaining the structure and function of photoreceptors. In Drosophila photoreceptors, attenuation of the Rab1 function in its dominant-negative mutants blocked the rhodopsin transport from the ER to the Golgi body and inhibited the maturation of rhodopsin (Satoh et al., Reference Satoh, Tokunaga, Kawamura and Ozaki1997), whereas Rab6 plays a role in the post-Golgi trafficking of rhodopsin (Deretic, Reference Deretic1997, Reference Deretic1998; Shetty et al., Reference Shetty, Kurada and O’Tousa1998).
However, Rab GTPases have not been studied in the inner retinas. As an initial approach to investigate the function of Rab GTPases in the inner retinas, we determined the anatomical distribution and expression of Rab1 and Rab6 GTPases. Rab1 and Rab6 were chosen for our study since they are the most extensively studied and the best understood Rab GTPases and are involved in the transport of newly synthesized cargos along the early secretory pathway. This transport is a fundamental process in maintaining cell homeostasis. We addressed the following two basic questions in this study: (i) Are Rab1 and Rab6 GTPases specifically expressed in certain cell types in the inner retina? (ii) Does the expression of Rab1 and Rab6 in the inner retina depend on the ambient light?
Our data showed that both Rab1 and Rab6 GTPases were specifically expressed in certain retinal cells in the inner retina. The expression levels of both Rab1 and Rab6 strongly relied on the ambient light stimulation. The data suggested that Rab1 and Rab6 GTPases may play a role in modulating the function of retina by mediating the transport of nascent proteins along the early secretary pathway, particularly in the process of the light adaptation.
Materials and methods
Animals
The animal care guidelines comparable to those published by the Institute for Laboratory Animal Research (Guide for the Care and Use of Laboratory Animals) were followed. All procedures, which were approved by the campus animal use committee of Tulane University, adhered to the Statement of Association for Research in Vision and Ophthalmology (ARVO) for the Use of Animals in Ophthalmic and Vision Research and were in compliance with the National Institutes of Health guidelines. Mice (C57BL/6) and rats (Sprague-Dawley) were obtained from Charles River Farm (California) at ages ranging from 4 to 5 months and maintained on a 12-h light (6:00–18:00)/12-h dark (18:00–6:00) cycle. The light intensity for the light cycle was 2.83 × 10² μW/cm2. For the dark-adapted retinas, the animals were kept in complete darkness overnight (18:00–12:00) prior to experiments. The animals were euthanized at the middle of the day (12:00). All procedures for the dark-adapted experiments, including animal surgery and dissection and fixation, were performed in complete darkness. Infrared goggles were used to visualize the tissue on the dissecting microscopes and to maneuver in the dark room.
Antibodies
Rabbit anti-Rab1A and anti-Rab6 antibodies (catalog numbers sc-311 and sc-310, respectively, Santa Cruz Biotechnology Inc., Santa Cruz, CA) were used to determine the cellular distribution and expression of Rab1 and Rab6 in the mammalian retinas. For localization of Rab1 and Rab6 by confocal microscopy, the antibodies were used at 1:100 dilution. For Western blot analysis of Rab expression, the antibodies were used at 1:1000 dilution. Mouse anti-protein kinase Cα (PKCα) antibodies (GeneTex®, Inc., San Antonio, TX) were used to identify the rod bipolar cells at 1:75 dilution. Mouse anti-glutamine synthetase (anti-GS) antibodies (BD Transduction Laboratories™, San Jose, CA, catalog number 610517) were used to identify the Müller cells at 1:500 dilution.
Immunohistochemistry
Immunostaining of the retinal slides was carried out as described previously (Wang et al., Reference Wang, Van Der List, Nemargut, Coombs and Chalupa2007). Mice and rats were euthanized by intraperitonial injection of beuthanasia-D (200 mg/kg, NJ07083; Schering-Plough Animal Health Corp. Union, Whitehouse Station, NJ). After enucleation, the eyes were hemisected and fixed for 1–2 h in 4% paraformaldehyde (Sigma, St. Louis, MO) in phosphate buffered saline (PBS) (EM Science, Gibbstown, NJ). The eyecups were subsequently washed in PBS and cryoprotected in a 25% sucrose solution overnight. Each eyecup was then embedded in the optimal cutting temperature medium (Ted Pella, Torrence, CA), and sections were cut at 10 μm on a Microtome Cryostat (HM 550 series; Microm International GmbH, Torrance, CA). The sections chosen for immunohistochemistry were taken from the center of the eye passing through the optic nerve.
All sections were incubated in a blocking solution containing 10% normal serum (donkey or goat), 2% bovine serum albumin, and 0.3% Triton X-100 in 0.1 m PBS for 1 h at room temperature, followed by incubation with primary antibodies overnight at 4°C. For control slides, primary antibodies were omitted. The sections were washed several times with PBS and then incubated with fluorescent secondary antibodies Alexa Fluor 594 (1:600 dilution; goat anti-rabbit IgG; Invitrogen, Carlsbad, CA) or Alexa Fluor 488 (1:600 dilution; donkey anti-mouse IgG; Invitrogen) for 1–2 h. After washing with PBS, the sections were counterstained with DAPI (1:500; KPL, Gaithersburg, MD) for 1 min, rinsed, and then coverslipped with Prolong® Gold antifade mounting medium (Invitrogen).
For negative controls, the blocking peptides (peptide antigens) for the Rab1 and Rab6 antibodies were used to neutralize the antibodies. The Rab1 or Rab6 antibody and its blocking peptide were mixed at 1:5 weight-to-weight ratio in a microfuge tube and then were incubated overnight at 4°C. The antibody/peptide mixture of Rab1 or Rab6 was then used to replace the primary antibodies in immunostaining. The results showed that there was no labeling in retinal slides after neutralized the Rab1 and Rab6 antibodies.
Imaging
All images were acquired on a Leica TCS SP2 confocal microscope (Leica Microsystems, Heidelberg GMbH, Bannockburn, IL) equipped with argon/krypton, HeNe543/594, HeNe 633 lasers, and 405 diode. High-resolution three-dimensional images of each retinal section were obtained using a pixel resolution of 1024 × 1024 (X and Y). Image stacks were collected along the z-axis, and z steps were made at 0.36 μm, the optimal voxel distance for 63 × oil immersion objective. The stack depths were from 7 to 10 μm for retinal sections. The contrast and brightness were enhanced using Adobe Photoshop (Mountain View, CA).
To determine the effect of the light stimulation on the distribution and expression of Rab GTPases, the sections from the light- and dark-adapted retinas were stained in parallel with the same antibody using the identical procedures, and the confocal images were taken under the same acquisition parameters. The retinal sections from dark- and light-adapted retinas were processed on the same slides. In control experiments, the light and dark adaptation did not alter the intensity of nuclear staining with DAPI. To prevent the crosstalk between two fluorophores caused by the simultaneous imaging mode, the sequential scan mode was used. The immunostaining for each group was repeated in at least six retinas from three animals.
The mean fluorescent intensity of a region of interest (ROI) was measured in each scan plane of a stack of images using the intensity statistics quantification tool of Leica Confocal Software and was plotted as a function of its related depth in the z series. For each relative location, the same size of the ROI was selected to compare the mean fluorescent intensities between the light- and dark-adapted retinas (Figs. 6 and 7).
Western blot analysis of Rab1 and Rab6 expression
Eight retinas subjected to the light or dark adaptation as described above were combined and sonicated in a buffer containing 50 mm Tris-HCl, 5 mm EGTA, and 5 mm ethylenediaminetetraacetic acid, pH at 7.5, supplemented with Complete Mini Protease Inhibitor Cocktail (Roche Applied Science, Mannheim, Germany). After centrifugation at 5000 × g for 5 min, the supernatant (50 mg protein) was separated by sodium dodecyl sulfate polyacrylamide gel electrophoresis (12%) and transferred onto polyvinylidene difluoride membranes. The membranes were blocked with 5% dry milk for 1 h, followed by incubation with anti-Rab1 or anti-Rab6 antibodies for another 1 h. The signal was detected using ECL Plus (PerkinElmer Life Sciences, Waltham, MA) and a Fuji Film luminescent image analyzer (LAS-1000 Plus) and quantified using the Image Gauge program (Version 3.4). After immunoblotting with anti-Rab antibodies, the blots were stripped and reprobed with anti-actin antibodies. The expression of actin served as controls for equal protein loading in the light- and dark-adapted retinas.
Results
Cell type-specific expression of Rab1 and Rab6 in mouse and rat retinas
Rab1 and Rab6 have been shown to ubiquitously express in a variety of cells, including neurons (Martinez & Goud, Reference Martinez and Goud1998). However, the distribution of Rab1 and Rab6 in the inner retina remains unknown. As an initial approach to understand the function of Rab1 and Rab6 in the inner retina, we determined whether Rab1 and Rab6 are specifically expressed in certain cell types in the inner retina. In the current study, we first used immunostaining to define the expression patterns of Rab1 and Rab6 in the mouse and rat retinas.
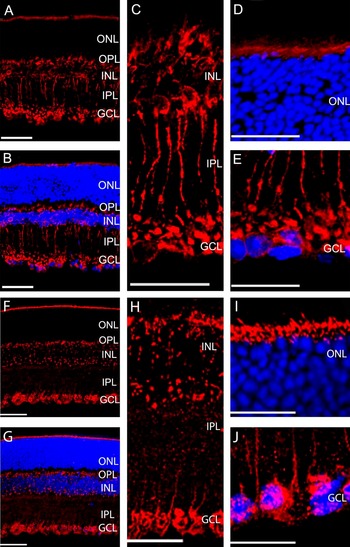
Confocal images of the immunostains of Rab1 antibodies in the transverse sections from a mouse retina are shown in Fig. 1A–1E. Rab1 antibodies heavily labeled the photoreceptor’s inner segments located adjacent to the outer border of the outer nuclear layer (ONL, Fig. 1A and 1D). However, there was no detectable labeling in the ONL. In the inner nuclear layer (INL), Rab1 antibodies selectively labeled a group of cells characterized by short brush-like dendrites, which extended into the outer plexiform layer (OPL). Their axons descend through the inner plexiform layer (IPL) and terminate in the innermost of IPL. In the transverse section, most of the labeled soma lined up close to the outer border of the INL, while some of them formed a second row in the middle of the INL. The labeling of Rab1 antibodies defined the morphologies of stained cells (Fig. 1A and 1C), which resemble the rod bipolar cells. In addition, Rab1 antibodies also labeled some cells in the ganglion cell layer (GCL, Fig. 1E). Similar results were obtained in eight mouse retinas. The labeling of Rab1 was absent in the controls when the primary antibodies were omitted.
Expression of Rab1 (A–E) and Rab6 (F–J) in the transverse sections of the mouse retinas. (A and F) Representative immunostaining with Rab1 (A) and Rab6 (F) antibodies. (B and G) Immunostaining of Rab1 (B) and Rab6 (G) antibodies (red) and nuclear staining of DAPI (blue). (C and H) Enlarged sections of immunostains from the INL to the IPL with Rab1 (C) and Rab6 (H) antibodies. (D and I) Enlarged sections of immunostains from the outer border of ONL with Rab1 (D) and Rab6 (I) antibodies. (E and J) Enlarged sections of immunostains from the GCL with Rab1 (E) and Rab6 (J) antibodies. ONL, outer nuclear layer; OPL, outer plexiform layer; INL, inner nuclear layer; IPL, inner plexiform layer; GCL, ganglion cell layer. Scale bar is 50 μm in (A, B, F, and G), and it is 25 μm in (C–E) and (H–J).

Similar to the immunostaining with Rab1 antibodies, Rab6 antibodies labeled the photoreceptor inner segments close to the outer border of the ONL but not of the ONL. However, unlike Rab1 antibody staining, Rab6 antibody staining scattered throughout the INL and did not reveal the morphology of each labeled cell in the INL. In the IPL, Rab6 antibodies labeled some descending processes (Fig. 1F–1J). In the GCL, Rab6 antibodies labeled the structures that surround the nuclei of the cells. Similar labeling with Rab6 antibodies was revealed in seven mouse retinas. The labeling of Rab6 was absent in the controls when the primary antibodies were omitted. These results demonstrated that Rab1 and Rab6 GTPases were not ubiquitously expressed in every cell; rather, they were specifically expressed in certain types of cells in the mouse inner retina.
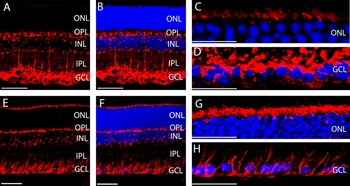
The cell type-specific expression of Rab1 and Rab6 observed in the mouse retina was also found in the rat retina (Fig. 2). Both Rab1 and Rab6 antibodies stained the photoreceptor’s inner segments and specifically labeled certain cells in the INL but not in the ONL. Furthermore, in the INL, Rab1 antibodies identified cell morphology, whereas Rab6 antibodies stained discrete compartments of the cells (Fig. 2B and 2F). In GCL, Rab1 antibodies stained structures beyond the terminals of rod bipolar cells, while Rab6 antibodies labeled structures that surround the nuclei of the cells in GCL. These findings indicate that the cell type-specific expression of Rab1 and Rab6 is common to both rats and mice.
Rab1 (A–D) and Rab6 (E–H) expression in the transverse sections of the rat retinas. (A and E) Immunostaining with Rab1 (A) and Rab6 (E) antibodies. (B and F) Immunostaining of Rab1 (B) and Rab6 (F) antibodies (red) plus DAPI staining of the nuclei (blue). (C and G) Enlarged sections of immunostains from the outer border of ONL with Rab1 (C) and Rab6 (G) antibodies. (D and H) Enlarged sections of immunostains from the GCL with Rab1 (D) and Rab6 (H) antibodies. Scale bar is 50 μm in (A–B) and (E–F); it is 25 μm in (C–D) and (G–H).

Colocalization of Rab1 with PKC in rod bipolar cells
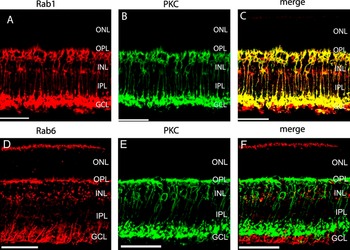
Our preceding data suggest that the cell morphology revealed by staining with Rab1 antibodies is very similar to that of the rod bipolar cells. To confirm if Rab1 is specifically expressed in the rod bipolar cells, we compared the immunostaining of Rab1 and PKCα antibodies in mouse retinas. protein kinase C (PKC) antibodies specifically label the rod bipolar cells in retinas (Greferath et al., Reference Greferath, Grunert and Wassle1990; Grunert & Martin, Reference Grunert and Martin1991; Vaquero et al., Reference Vaquero, Velasco and De La Villa1996; Behrens et al., Reference Behrens, Kasten and Wagner1998; Caminos et al., Reference Caminos, Velasco, Jarrin, Lillo, Jimeno, Aijon and Lara2000). The immunostains with Rab1 and PKC antibodies are shown in Fig. 3A–3C. Consistent with other reports, PKC antibodies labeled the rod bipolar cells with the cell bodies in the INL, the short brush-like dendrites extended into the OPL, and the descending axons terminated in the innermost IPL (Fig. 3B). Double immunostaining with Rab1 and PKC antibodies revealed that these two antibodies labeled the same cells (Fig. 3C). In addition, Rab1 antibodies also labeled some cells in the GCL below the rod bipolar cell terminals (Fig. 4A–4C).
Immunostains of Rab1 (A–C) and Rab6 (D–F) with PKC in the inner mouse retinas. The transverse sections taken from mouse retinas were double stained with antibodies against Rab1 (A–C) or Rab6 (D–F) with PKC, a rod bipolar cell marker. Rab1 colocalized with PKC, while Rab6 did not. Red, Rab staining; green, PKC staining; yellow, colocalization of Rab with PKC. Scale bar: 50 μm.

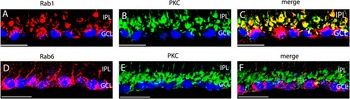
Enlarged sections of immunostains of Rab1 (A–C) and Rab6 (D–F) with PKC in the GCL in mouse retinas. The transverse sections taken from mouse retinas were double stained with antibodies against Rab1 (A–C) or Rab6 (D–F) with PKC. Red, Rab staining; green, PKC staining; yellow, colocalization of Rab with PKC; blue, nuclear staining of DAPI. Scale bar is 25 μm in (A–C) and 30 μm in (D–F).

In contrast, our results showed that immunostains of Rab6 did not overlap with PKC, indicating that Rab6 was expressed in a different cell type from rod bipolar cells in the inner retina (Fig. 3F). The descending processes, labeled by Rab6 antibodies in the IPL, extended beyond the terminals of rod bipolar cells and surrounded the nuclei of the cells in GCL (Fig. 4D–4F).
Relation between Müller cells and the expression of Rab1 and Rab6
In the outer retina, both Rab1 and Rab6 were expressed adjacent to the outer border of the ONL, where the outer limiting membrane and the inner segments of the photoreceptors are located. Moreover, both Rab1 and Rab6 antibodies labeled structures in GCL. Since the outer limiting membrane, which locates adjacent to the outer border of the ONL, and the inner limiting membrane, which locates adjacent to GCL, are formed by Müller cells, it is possible that Rab1 and Rab6 may be expressed in Müller cells at the outer limiting membrane and GCL.
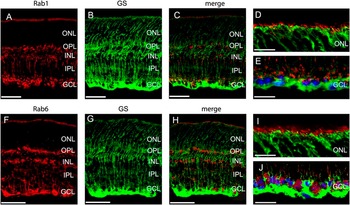
To determine if Rab1 and/or Rab6 expressed in Müller cells, the mouse GS antibodies were used for immunostaining to label Müller cells. We compared the immunostainings of Rab1 and Rab6 with GS antibodies in mouse retinas. GS antibodies specifically label the Müller cells in retinas (Riepe & Norenburg, Reference Riepe and Norenburg1977; Linser et al., Reference Linser, Sorrentino and Moscona1984; Bui et al., Reference Bui, Hu, Acosta, Donaldson, Vingrys and Kalloniatis2009). The immunostains with Rab1 and GS antibodies are shown in Fig. 5A–5E, and the double immunostaining with Rab6 and GS antibodies is shown in Fig. 5F–5J. The results revealed that neither Rab1 nor Rab6 was colocalized with GS, indicating that Rab1 and Rab6 were not expressed in Müller cells.
The transverse sections taken from mouse retinas were double stained with antibodies against Rab1 (A–E) or Rab6 (F–J) with GS, a Müller cell marker. Enlarged sections of immunostains of Rab1 (D–E) and Rab6 (I–J) with GS at the outer border of ONL (D and I) and at the GCL (E and J) in mouse retinas. Neither Rab1 nor Rab6 was colocalized with GS. Red, Rab staining; green, GS staining; blue, nuclear staining of DAPI. Scale bar is 50 μm in (A–C) and (F–H); it is 25 μm in (D–E) and (I–J).

Ambient light-dependent expression of Rab1 and Rab6
Visual adaptation is one of the most remarkable characteristics of the vertebrate visual system, allowing detection of increment and decrement light stimuli over a very wide range of ambient illumination (more than 10 log units). Retinal adaptation involves the functional, structural, and metabolic changes of the retina. Therefore, newly synthesized proteins need to be transported to their functional destinations within the cells in the retina. Since Rab1 and Rab6 modulate vesicle-mediated transport processes, it is interesting to know whether their expression is regulated by the ambient light.
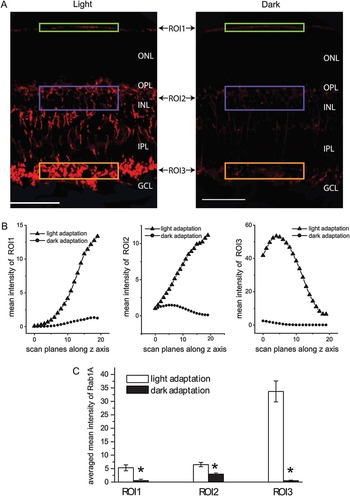
To determine if the expression of Rab1 and Rab6 depends on the ambient light, the parallel immunostaining was carried out with the light- and dark-adapted mouse retinas. The immunostaining intensities with Rab1 (Fig. 6A) and Rab6 (Fig. 7A) antibodies were much higher in the light-adapted retinas than in the dark-adapted retinas. Dark-induced attenuation of the expression of Rab1 and Rab6 was observed in the both outer and inner retinas. In contrast, the light and dark adaptation did not alter the intensity of nuclear staining with DAPI (data not shown), suggesting that the immunostaining differences observed in the light- and dark-adapted retinas were not caused by the experimental procedures. These results indicate that the expression of Rab1 and Rab6 in the retina is light inducible.
Rab1 expression in the mouse retinas was enhanced under the light adaptation compared to that under dark adaptation. (A) Comparison of immunostaining with Rab1 antibodies in the light-adapted (left panel) and dark-adapted (right panel) retinas obtained under the identical procedures. From each immunostain, three ROIs, ROI1 (green box), ROI2 (blue box), and ROI3 (brown box), were selected in the outer border of the ONL, the INL, and the innermost of the IPL, respectively, to quantify the intensity of the immunolabeling with Rab1 antibodies. Scale bar: 50 μm. (B) The mean immunofluorescent intensities from the light- and dark-adapted retinas. For each ROI, 20 scan planes were taken at different depths. The mean fluorescent intensities from each scan plane were plotted as a function of its related depth. (C) The average of the mean immunofluorescent intensities of the 20 scan planes from the light- and dark-adapted retinas as shown in (B). *P < 0.05 versus light adaptation.

Rab6 expression in the mouse retinas was also enhanced under the light adaptation compared to that under dark adaptation. The detailed experimental procedures are essentially the same as described in the legend of Fig. 5 for Rab1. (A) Immunostains of Rab6 antibodies in the light-adapted (left panel) and dark-adapted (right panel) retinas. Scale bar: 50 μm. (B) The mean immunofluorescent intensities of the three ROIs from each scan plane were plotted as a function of its related depth. (C) The average of the mean immunofluorescent intensities of the 20 scan planes from the light- and dark-adapted retinas as shown in (B). *P < 0.05 versus light adaptation.

To further characterize the expression of Rab1 and Rab6 in response to the ambient light, the fluorescent intensities of the immunostains in the light- and dark-adapted retinas were quantified using the intensity statistics quantification tool of Leica Confocal Software. From each retinal section, 20 scan planes were taken along the z-axis and compared between the light- and dark-adapted retinas. In each scan plane, three ROIs, ROI1, ROI2, and ROI3, were selected (Figs. 6A and 6B and 7A and 7B) in the outer border of the ONL, the INL, and the innermost of the IPL, respectively. These regions were heavily labeled by Rab1 and Rab6 antibodies. The mean fluorescent intensity in each ROI was plotted as a function of the depth (Figs. 6B and 7B). At each scan plane, the immunostaining intensities with Rab1 and Rab6 antibodies were higher in the light-adapted retinas than that in the dark-adapted retinas. The reduction in the expression of Rab1 and Rab6 in the dark-adapted retinas was observed in each of the three ROIs measured (Figs. 6B and 7B). The averaged mean intensities in the Rab1 and Rab6 immunostains at each ROI from 20 scan planes were significantly increased by approximately 4- to10-fold in the light-adapted retinas as compared with the dark-adapted retinas (P < 0.05, t-test) (Figs. 6C and 7C).
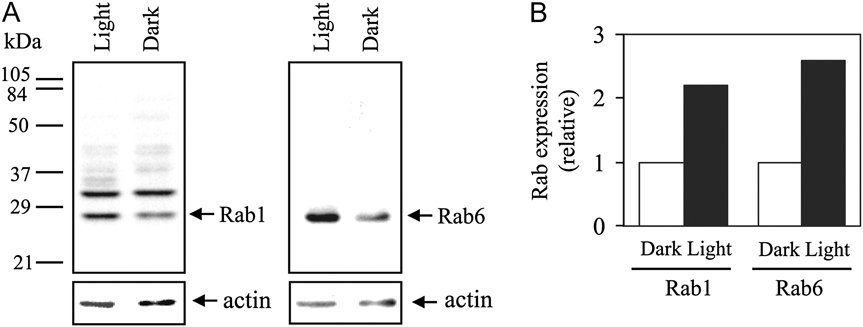
To confirm that the ambient light stimulation upregulates Rab1 and Rab6 in the retina, the expression levels of Rab1 and Rab6 in the light- and dark-adapted mouse retinas were analyzed by immunoblotting. On immunoblots, Rab6 antibodies specifically recognized a single Rab6 band, whereas Rab1 antibodies detected two protein bands with molecular weights of approximately 27 and 32 kDa (Fig. 8A). Based on their molecular weights and their positions relative to Rab6 on the blots, the lower molecular weight band is Rab1 (Karniguian et al., Reference Karniguian, Zahraoui and Tavitian1993). Consistent with the results obtained by confocal imaging, the expression of Rab1 and Rab6 was increased by approximately 2.2- and 2.6-fold, respectively, in the light-adapted retinas compared to the dark-adapted retinas (Fig. 8A and 8B). In contrast, expression of actin, which was used as a control for equal protein loading, remained the same in the light- and dark-adapted retinas. In addition, expression of the Rab1 antibody–recognized 32 kDa protein was also not altered in the light- and dark-adapted retains. These data, together with the results obtained in the immunostaining experiments, strongly demonstrated that expression of both Rab1 and Rab6 GTPases in the retina is highly inducible upon light stimulation.
Western blot analysis of Rab1 and Rab6 expression in the light- and dark-adapted mouse retinas. (A) Representative blots showing that expression of Rab1 (left panel) and Rab6 (right panel) is increased in the light-adapted retinas (light) as compared to the dark-adapted retinas (dark). The numbers indicated on the left are molecular weights. After immunoblotting with anti-Rab antibodies, the blots were stripped and reprobed with anti-actin antibodies (lower panels), which serve as controls for equal protein loading. (B) Quantitative data expressed as fold increase over the dark-adapted retinas. Similar results were obtained in three independent experiments.

Discussion
Rab1 and Rab6 are two well-characterized Rab GTPases involved in the regulation of protein transport between the ER and the Golgi apparatus. As the first study on the Ras-like Rab GTPases in the inner retinas, we used immunohistochemistry combined with confocal microscopy and immunoblotting to analyze the anatomic distribution and expression of Rab1 and Rab6 in the retina. The results presented in this study show that Rab1 was expressed in the rod bipolar cells in the inner retinas, and both Rab1 and Rab6 expressions were inducible by the ambient light.
In contrast to the extensive studies, which show that the Rab1 and Rab6 GTPases are ubiquitously expressed in a variety of cell types, our current results revealed that Rab1 and Rab6 were selectively expressed in the certain cell types in the mouse and rat retinas. Specifically, both Rab1 and Rab6 were expressed in the inner segments of photoreceptors. In the inner retina, Rab1 was expressed in the rod bipolar cells identified by PKC staining, whereas Rab6 was not colocalized with PKC, indicating it may be expressed in a different type of cells from rod bipolar cells. In addition, both Rab1 and Rab6 were expressed beyond the terminals of the rod bipolar cells in the GCL; however, they were not expressed in Müller cells identified by GS antibodies. Rab1 and Rab6 were not detectable in the cells in the ONL under exactly the same immunostaining conditions. This suggests that Rab1 and Rab6 are expressed at very low levels or not at all in these cells. Nevertheless, these data showed that Rab1 and Rab6 were expressed in distinct cell types in the retinas.
In the outer retina, both Rab1 and Rab6 were expressed adjacent to the outer border of the ONL, where the outer limiting membrane and the inner segments of the photoreceptors are located. Since the outer limiting membrane is formed by a row of zonulae adherents between Müller cells, it does not contain the ER or the Golgi structures; therefore, Rab1 and Rab6 are not likely expressed in the outer limiting membrane. This notion is confirmed by the data that the Rab1 and Rab6 did not colocalize with GS at the location of the outer limiting membrane. However, the inner segments of the photoreceptors contain both ER and Golgi. Thus, the locations of the immunostains of Rab1 and Rab6 in the outer retina indicate that Rab1 and Rab6 are expressed in the inner segments of photoreceptors.
In the inner retina, the results that Rab1 colocalized with PKC indicate that Rab1 is expressed in the rod bipolar cells, but Rab6 did not overlap with PKC. These data suggest that Rab6 may be expressed in different type of cells from rod bipolar cells. The differences between the expression patterns of Rab1 and Rab6 may also reflect that Rab1 and Rab6 exist in different subcellular compartments. Consistent with this possibility, Rab1 is strongly expressed in the ER and the Golgi, whereas Rab6 is found in the Golgi complex in cells.
In GCL, although both Rab1 and Rab6 labeling extended beyond the terminals of rod bipolar cells into GCL, they were not expressed in Müller cells identified by GS antibodies. However, the pattern of Rab1 labeling differed from that of Rab6. The Rab1 antibodies labeled structures, which are adjacent to innermost IPL, while the Rab6 antibodies labeled perinuclear structures in GCL. These data suggest that Rab1 and Rab6 may be expressed in different subcellular compartments in ganglion cells.
The most interesting finding presented in this study is that the light adaptation upregulated both Rab1 and Rab6. The enhanced expression of Rab1 and Rab6 in the light-adapted retinas was demonstrated by two independent methods: immunolabeling and immunoblotting analysis of protein expression. However, the antibodies against Rab1 recognized two proteins in retina on immunoblots. In addition to Rab1, another protein with molecular weight of approximately 32 kDa was recognized by the Rab1 antibodies on immunoblots. Our immunolabeling data showing that the stains of the Rab1 antibodies in the outer retina, the inner retina, and the GCL were all enhanced under light adaptation suggest that this unknown protein may not be recognized by the Rab1 antibodies in immunolabeling. Alternatively, this unknown protein, which is recognized by the Rab1 antibodies, may colocalize with Rab1 in retina. Nevertheless, our data strongly demonstrated that the expression of Rab1 and Rab6 was markedly enhanced in response to light adaptation.
The findings, that ambient light enhanced the expression of Rab1 and Rab6, suggest that the expression levels of Rab1 and Rab6 may directly correlate with the function of the retinas in the processing of the light/dark adaptation. The rod bipolar cells are the interneurons in the inner retina, which directly receive inputs from the rods and transfer both light increment and light decrement signals via AII amacrine cells to the cone bipolar cells, which in turn transfer the signals to the ganglion cells (Sharpe & Stockman, Reference Sharpe and Stockman1999). Under dark adaptation, the scotopic vision, the light sensitivity of the retina is very high; therefore, the dim light signals can be detected. The rods are essential for maintaining the high sensitivity of the retinas to the light under the dark adaptation, whereas the rod bipolar cells are critical for transferring the dim light signals within the retinas (Sterling & Demb, Reference Sterling, Demb and Shepherd2004). The results that the expression of Rab1 and Rab6 is highly dependent on the ambient light, as demonstrated in this study, suggest that these two small GTPases may be involved in the retinal adaptation.
Retinal adaptation enables the retina to adjust its sensitivity to the mean intensity and variance (contrast) of ambient light. During light adaptation, the retina decreases its sensitivity to prevent saturation. Adaptation to the mean intensity of ambient light occurs in rod and cone photoreceptors (Pugh et al., Reference Pugh, Nikonov and Lamb1999; Fain et al., Reference Fain, Matthews, Cornwall and Koutalos2001) and at sites in the retinal network (Green et al., Reference Green, Dowling, Siegel and Ripps1975; Naka et al., Reference Naka, Chan and Yasui1979; Green and Powers, Reference Green and Powers1982; Shapley & Enroth-Cugell, Reference Shapley and Enroth-Cugell1984; Page-McCaw et al., Reference Page-McCaw, Chung, Muto, Roeser, Staub, Finger-Baier, Korenbrot and Baier2004; Dunn & Rieke, Reference Dunn and Rieke2006). Interestingly, we found that the expression of the small GTPase, Rab1 and Rab6, in the inner mouse retina was much higher under light adaptation than dark adaptation, suggesting that the neural network adaptation also occurs at the molecular level.
Although the exact function of Rab1 and Rab6 in response to ambient light remains to be established, they may engage in the retinal adaptation by modulating the trafficking of nascent proteins and other molecules along the early secretory pathway in retinal cells. For instance, Rab1 may participate in the post photoreceptor adaptation in the rod bipolar cells. Under light adaptation, the cone signal pathways are functional, while the rod signal pathways remain inactivated. The inactivation of rod signaling pathways requires shutting down the rod bipolar cells. Our results that Rab1 was highly expressed in the rod bipolar cells under light adaptation suggest that Rab1 may be involved in the functional transition of the rod bipolar cells from dark to light adaptation. The highly expressed Rab1 in the bipolar cells may modulate the transport of nascent proteins or other molecules, which may in turn inactivate the rod bipolar cells. Alternatively, the highly expressed Rab1 under light adaptation may be involved in manufacturing the proteins or molecules, which are used when the rod bipolar cells are reactivated under dark adaptation. Nevertheless, as a variety of vision defects are linked to the retinal adaptation, the molecular mechanism underlying the function of Rab GTPases in the retinas under the physiological and pathological conditions merits further investigation.
Acknowledgments
This research was supported by Grants EY13301 and GM076167 and by Tulane Research Enhancement Fund and Tulane New Faculty Startup Fund. We thank Dr. James R. Jeter Jr. for reading and commenting on this manuscript.