I. INTRODUCTION
Among the three states of matter, the two extreme cases of crystalline solids and gases are fairly well understood. In their ideal state (sufficiently low densities) gases represent complete atomic disorder, while an ideal crystal is an example of perfect spatial order of the atoms in three dimensions. Theories can be relatively easily formulated for well-defined states with complete order or disorder. Liquids and amorphous solids (glasses if they are formed from the liquid) are more difficult to understand since they are intermediate between these two idealized extremes. Although lacking the long-range order of crystals, they do maintain significant order in the short- and medium-length (atomic) scales. In principle, if the first order liquid/vapor to solid phase transformation (i.e., nucleation and growth) is arrested, any liquid/vapor can be frozen into an amorphous solid. Reference Cohen and Turnbull1 This is most commonly accomplished by rapidly cooling (or quenching) the liquid/vapor Reference Grant and Giessen2 although other approaches include high mechanical deformation Reference Koch3 and high energy ion irradiation. Reference Nolfi4 The ease of forming an amorphous solid varies enormously from one material to another. Among the elemental liquids, covalent-bonded materials, such as group III, IV, and V are relatively easy to synthesize into glasses, Reference Bhat, Molinero, Soignard, Solomon, Sastry, Yarger and Angell5 especially when there is a decrease in volume during melting. In comparison, transition metals (with 3d, 4d, 5d electrons) are much more difficult to make amorphous. Thus far only a handful of transition metal elements (Co, Reference Magnan, Chandesris, Rossi, Jezequel, Hricovini and Lecante6 Fe, Reference Kim, Lin and Kelly7 Nb, Reference Kim, Lin and Kelly7 Mo, Reference Kim, Lin and Kelly7 W, Reference Kim, Lin and Kelly7 Ta, Reference Kim, Lin and Kelly7,Reference Zhong, Wang, Sheng, Zhang and Mao8 V Reference Zhong, Wang, Sheng, Zhang and Mao8 ) have been produced in the amorphous state. Since extremely high cooling-rates, between 107 and 1014 K/s, are required, elemental glasses have only been synthesized in the form of nanorods and nanospheres. By contrast, molecular liquids and polymers Reference Angell9 are relatively easy to synthesize into glasses. In fact, protein molecules (polymers) are often very difficult to crystallize. Reference Durbin and Fehrer10
Compared to the elemental metals, metal alloys are easier to amorphize. The first report of a metallic glass was for eutectic Au81Si19 produced by splat cooling, Reference Klement, Willens and Duwez11 with a cooling-rate of ∼106 K/s. Intense activity followed this discovery for the next two decades, but then tapered off as prominent applications failed to appear (other than a few niche magnetic ones). The maximum thickness for which a glass can be formed (the critical thickness) is a common measure of glass formability. The critical thicknesses of the first metallic glasses were generally between 20 and 100 μm, greatly limiting their practical applications. The first discovery of a metallic glass with a critical thickness larger than 1 mm was reported for a Pd40Ni40P20 alloy. Reference Kui, Greer and Turnbull12 This caused a renaissance in the study of metallic glasses in the early 1990’s, leading to the discovery of a series of new metallic glasses with critical thickness larger than 1 mm. Reference Inoue, Matsumoto and Masumoto13,Reference Peker and Johnson14 Collectively, these glasses are called bulk metallic glasses (BMG), since they can be synthesized in bulk form with large dimensions (up to several tens of mm thick). They do not require the rapid quenching necessary for the first generation of metallic glasses, but can be formed under conditions similar to those of the more common silicate glasses. These glasses have very high potential for novel applications. The absence of grain boundaries and dislocations vastly improve the mechanical, Reference Trexler and Thadhani15 corrosion resistance, Reference Scully, Gebert and Payer16 and magnetic Reference McHenry, Willard and Laughlin17 properties, compared to their crystalline counterparts. Also, they can be plastically formed like polymers and conventional glasses to form intricate components. No crystal metallic alloys can be processed in this way. Several excellent reviews exist on these important properties Reference Trexler and Thadhani15–Reference McHenry, Willard and Laughlin17 and on the glass formability of this important class of materials. Reference Wang, Dong and Shek18,Reference Inoue and Takeuchi19
To better understand and improve glass formation, it is necessary to understand the processes that occur in the equilibrium and supercooled liquids that produce the glass. One of the most fascinating aspects of all glass-forming liquids (metallic alloys, oxides, molecular, polymers) is the temperature dependence of the dynamical properties (viscosity, diffusion coefficient, relaxation time) as the equilibrium liquid is cooled into the metastable state below the melting temperature. Depending on the cooling-rate, the liquid goes out of equilibrium at some temperature and finally freezes into an amorphous solid. The temperature at which glass formation occurs is called the glass transition temperature, T g. This cooling-rate dependent temperature is where the structural relaxation time of the liquid becomes comparable to the laboratory time scale, which is usually considered to be about 100 s. The corresponding viscosity at T g is defined to be 1012 Pa s. Another noteworthy aspect is the evolution of the short- and medium-range order as the liquid is cooled to the glassy state. Traditionally, both the viscosity and the structural properties have been measured at or near T g. Comparatively, much less attention has been paid to the high temperature properties of dynamics and structure, especially to their evolution from the equilibrium liquid (above the liquidus, T l) to the metastable one. Metallic glasses are probably the least studied system in this temperature range because of technical challenges involving contamination issues and the inability to avoid crystallization below T l. Recent advances in containerless techniques Reference Gangopadhyay, Lee, Kelton, Rogers, Goldman, Robinson, Rathz and Hyers20–Reference Weber, Hampton, Morkloy, Rey, Zatarski and Nordine24 have enabled measurements of these properties in a contamination-free environment for the high melting temperature equilibrium and supercooled metallic liquids. The purpose of this article is not to provide a broad review of containerless studies of liquids, but instead to focus on the narrow aspect of those experimental results and supporting molecular dynamics (MD) studies that have established a clear connection between the dynamical properties and liquid structure. Except for one recent review, Reference Kelton25 no in-depth analysis of the literature data on this narrow, but important, aspect has been provided thus far. In this review, some general aspects of the dynamical and thermodynamic properties of liquids near T g are introduced first. Thereafter, the structural and dynamical properties of metallic liquids are presented to demonstrate that the high temperature liquid properties are important for glass formation and that a close connection between structure and dynamics exist. Such a connection has not been well established and recognized thus far for the metallic liquids, perhaps because of lack of experimental data. Finally, a few recent experimental and theoretical studies are discussed that suggest a connection between these properties and the atomic interactions in these multicomponent, complex liquids.
II. LIQUID PROPERTIES NEAR T g
A. Viscosity
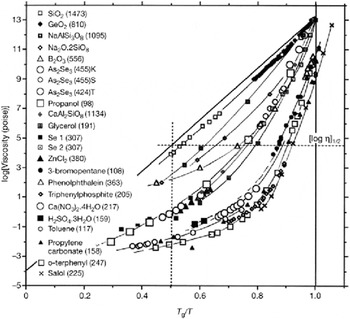
Figure 1 shows the characteristic behavior of the viscosity (η) for a few representative glass-forming liquids Reference Martinez and Angell26 as a function of the reduced temperature, T g /T in what is known as an Angell plot. It is immediately noticed that the viscosity changes by an enormous amount, from about 10−3 to 10−4 Pa s at the highest temperatures above T l to about 1012 Pa s at T g. Interestingly, near T g the rates of this change are very different for different liquids. For example, near T g, the viscosity of O-terphenyl (OTP) changes by about one order of magnitude for only one percent change in T/T g. In contrast, to change the viscosity of SiO2 by a similar amount the temperature needs to be changed by about 5% of T/T g. To classify liquids based on this behavior, Angell introduced Reference Angell, Ngai and Wright27 a “fragility parameter” defined by
 $$m = {\left[ {{{{\rm{d}}\log \eta } \mathord{\left/ {\vphantom {{{\rm{d}}\log \eta } {{\rm{d}}\left( {{T \mathord{\left/ {\vphantom {T {{T_{\rm{g}}}}}} \right. \kern-\nulldelimiterspace} {{T_{\rm{g}}}}}} \right)}}} \right. \kern-\nulldelimiterspace} {{\rm{d}}\left( {{T \mathord{\left/ {\vphantom {T {{T_{\rm{g}}}}}} \right. \kern-\nulldelimiterspace} {{T_{\rm{g}}}}}} \right)}}} \right]_{{T_{\rm{g}}}}}\quad .$$
Angell-plot of the logarithm of viscosity as a function of reduced temperature, T g/T [Reprinted by permission from Macmillan Publishers Ltd.: Nature, Reference Martinez and Angell26 copyright (2001)].

Liquids with larger m are called “fragile” and those with smaller values as “strong”. Since the infinite temperature viscosity for liquids is ≈10−5 Pa s Reference Blodgett, Egami, Nussinov and Kelton28 and the viscosity at T g is 1012 Pa s, the fragility cannot be smaller than 17. SiO2 and BeF2 are two of the strongest liquids known thus far with m = 23 and OTP is one of the most fragile, with m = 81. Reference Sokolov, Kisliuk, Quitmann, Kudlik and Rossler29 The fragility parameter for most of the metallic liquids lies in the intermediate range between these extremes. In addition to a basic science interest, fragility is an important parameter for glass technology. Fabrication of useful objects from a glass requires heating above T g to enable sufficient flow, which becomes hampered if the viscosity increases steeply with decreasing temperature (fragile glasses).
An important question is why the fragilities of different liquids are so different? What is the underlying mechanism that controls fragility? Although hundreds of publications have been devoted to answering these questions, here we try to address them from a structural viewpoint, focusing narrowly on some of the recent work on metallic glasses.
B. Other measures of kinetic fragility
The definition of fragility from Eq. (1) is obviously a measure of kinetic fragility, since it is defined in terms of a dynamical property. It can also be defined from the structural relaxation time, τ, of the liquid near T g. The viscosities of many glasses and liquids have been described in terms of the Vogel–Fulcher–Tammann (VFT) expression Reference Vogel30–Reference Tammann and Hesse32 :
 $$\eta = {\eta _{\rm{o}}}\exp \sleft( {{{D{T_{\rm{o}}}} \over {\left( {{T \over {{T_{\rm{o}}}}} - 1} \right)}}} \right)\quad ,$$
where ηo is the viscosity at infinite temperature, and D and T o are fit parameters. It then naturally follows from Eqs. (1) and (2) that
 $$m = {{D{T_{\rm{g}}}{T_{\rm{o}}}} \over {2.3{{\left( {{T_{\rm{g}}} - {T_{\rm{o}}}} \right)}^2}}}\quad .$$
Therefore, the parameter D, instead of m, is also frequently used as a fragility parameter. However, while a larger m corresponds to a more fragile liquid, a larger D corresponds to a stronger liquid. This difference is because T g − T o is smaller for the fragile liquids and larger for the stronger ones. The form of Eq. (2) indicates that at a characteristic temperature T o, the viscosity becomes infinite and the parameter D is a measure of how quickly that temperature is approached as the liquid is cooled. This resembles an approach to a phase transition at T o. Since T o lies below T g, Reference Richert and Angell33 it cannot be accessed experimentally because of dynamical arrest at T g. Therefore, some consider T o to be a “hidden transition” temperature that cannot be realized because of the intervening glass transition. This interpretation remains controversial, however, and has been long debated among the glass community. Reference Hecksher, Nielsen, Olsen and Dyre34,Reference Mauro, Yueb, Ellisona, Gupta and Allan35 It should also be emphasized that the VFT relation, originally proposed for polymers, does not fit well to the experimental data for metallic Reference Blodgett, Egami, Nussinov and Kelton28 and oxide Reference Mauro, Yueb, Ellisona, Gupta and Allan35 liquids, especially for fragile liquids near T g. In spite of its frequent use in the literature, the interpretation of D and T o remain controversial (see below).
C. Thermodynamic fragility
It is also possible to define fragility from thermodynamic properties. A connection between thermodynamics and kinetics was originally proposed by Gibbs, Reference Gibbs36 followed by Adam and Gibbs Reference Adam and Gibbs37 and Goldstein. Reference Goldstein38 The relevant quantity is the configurational entropy, which is usually defined by the difference in the entropy of the liquid and the underlying crystalline phase,
 $$\Delta {S_{{\rm{con}}}} = {S_{\rm{L}}} - {S_{{\rm{cryst}}{\rm{.}}}}\quad .$$
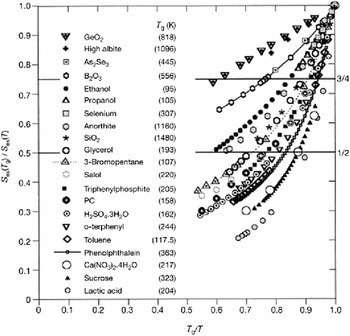
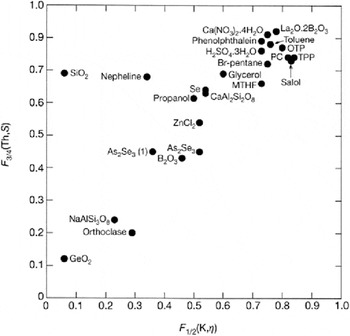
Obtaining the configurational entropy, ΔS con, in this manner is based on the assumption that the vibrational entropies of the liquid and the crystal are identical. Although this assumption has been often challenged, Reference Johari39,Reference Johari40 and still remains unresolved, we will continue our discussion assuming its validity. Originally proposed by Ito et al., Reference Ito, Moynihan and Angell41 a reduced plot of S con(T g)/S con(T) versus T g/T can be made in a manner similar to the viscosity plot, as shown in Fig. 2. Reference Martinez and Angell26 If data are available, the slopes of S con(T g)/S con(T) at T g may be used as a measure of fragility. In the absence of such data, the authors used the reduced temperature at which S con(T g)/S con(T) attains some specific value (3/4 in the case they considered) as a measure of fragility. Figure 3 makes such a comparison of the reduced temperatures at which the thermodynamic quantity (reduced configurational entropy) attains a value of 3/4 and the kinetic parameter (reduced viscosity in the log scale) attains 1/2 of its value at T g. Reference Martinez and Angell26 A very close relation between thermodynamic and kinetic fragilities is observed. It should be emphasized that the good correlation does not depend on the choice of the reduced temperature, T g/T; the particular choice made was purely a matter of convenience, dictated by the available data at that time.
The excess entropy of the liquid over that of the crystal normalized to the value at T g in the reduced temperature scale of T g/T [Reprinted by permission from Macmillan Publishers Ltd.: Nature, Reference Martinez and Angell26 copyright (2001)].

Correlation between thermodynamic and kinetic fragility [Reprinted by permission from Macmillan Publishers Ltd.: Nature, Reference Martinez and Angell26 copyright (2001)]. See text for the definition of F 3/4 and F 1/2.

One of the most contentious issues concerning the configurational entropy is what happens as the temperature is lowered below T g. If S con continues to drop as in Fig. 2, at some temperature it will become negative, which implies an unphysical situation where the entropy of the disordered glass will become smaller than the corresponding ordered crystal. This is called the “Kauzmann paradox” Reference Kauzmann42 and the corresponding temperature, T k, is the Kauzmann temperature. While it is frequently believed that T k ∼ T o from the VFT relation [Eq. (2)], a systematic deviation of T k/T o from 1 with increasing fragility has also been reported for molecular and metallic glasses. Reference Tanaka43 This suggests that the two temperatures do not represent the same phenomenon. Several scenarios have been proposed to avoid the Kauzmann paradox. These ranges from an intervening crystallization before reaching T k Reference Tanaka44 to the possibility of T k → 0 K, Reference Hecksher, Nielsen, Olsen and Dyre34 which for some systems may coincide with the liquid spinodal at 0 K in the pressure-density phase-space. Reference Stillinger, Debenedetti and Truskett45
Since entropy is determined by the specific heat, attempts have been made to connect fragility from the jump in the specific heat,
 $\Delta {C_{\rm{p}}} = {\left( {{C_{\rm{l}}}} \right)_{{T_{\rm{g}}}^ - }}{\left( {{C_{{\rm{glass}}}}} \right)_{{T_{\rm{g}}}}}$
at T
g, as the frozen glass enters the fluid supercooled liquid; however, these were not very successful.
Reference Wang, Velikov and Angell46,Reference Huang and McKenna47
Instead, an expression combining ΔC
p, T
g, and the heat of fusion, ΔH
m (56ΔC
p
T
g/ΔH
m), fits well with the dynamic fragility parameter estimated from the viscosity data near T
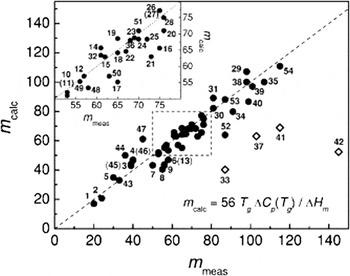
g, as shown in Fig. 4.
Reference Wang, Angell and Richert48
This indicates that it is not the specific heat jump near T
g (release of frozen enthalpy), but its relative magnitude with respect to the melting enthalpy, that is a good measure of thermodynamic fragility. This relationship finds support from a theory that considers the glass transition as a random first order phase transition.
Reference Xia and Wolynes49
Comparison of fragilities calculated from the specific heat jump, ΔC p at T g and the heat of fusion ΔH m with those measured from viscosity data using Eq. (1) for mostly molecular liquids (reproduced from Ref. Reference Wang, Angell and Richert48, with the permission of AIP publishing).

In metallic glasses measurements of the dynamic and thermodynamic parameters near and below T g are problematic. To be sensible, measurements must be made on a fully relaxed glass. However, since most are prone to crystallize at these temperatures with long annealing treatments, the degree of approach to the relaxed state is frequently unclear. Therefore, experimental data for the traditional fragility parameter, m, for metallic glasses are extremely sparse, and often unreliable. Only data for the BMGs, for which the crystallization temperature is well separated from T g, can be trusted.
III. LIQUID PROPERTIES AT HIGH TEMPERATURES
As mentioned earlier, there is growing evidence that processes that begin in the equilibrium and supercooled liquid are critically important for the glass transition. Comparisons of experimental data with MD studies (see Sec. IV.C) are also much more reliable for high temperature liquids since the experimental and calculated relaxation times are comparable. There are many orders of magnitude difference between the MD relaxation times and the experimental ones for glasses. In spite of this, there are very few experimental studies that have focused attention on measuring structural, thermodynamic, and dynamical properties at high temperatures (above and near T l) in metallic liquids. Major problems that have prevented this are sample contamination with the container and oxidation. As mentioned in the introduction, these problems are greatly mitigated by recent developments in levitation techniques. Reference Gangopadhyay, Lee, Kelton, Rogers, Goldman, Robinson, Rathz and Hyers20–Reference Weber, Hampton, Morkloy, Rey, Zatarski and Nordine24 While BMG forming liquids can be processed to low temperatures, sometimes approaching room temperature, rapid crystallization limits supercooling for marginal-glass formers. It is, therefore, important to identify changes in structure and dynamics in equilibrium and shallow supercooled liquids that can inform glass formation. To avoid confusion, it should be mentioned that data for molecular liquids are much more abundant, since their melting temperatures are usually low and rapid crystallization is often not a limiting factor.
A. High temperature activation energy from viscosity and fragility
A more formal expression for the viscosity than the VFT is:
 $$\log \eta = \exp \left( {{{ - E\left( T \right)} \mathord{\left/ {\vphantom {{ - E\left( T \right)} {{k_{\rm{B}}}T}}} \right. \kern-\nulldelimiterspace} {{k_{\rm{B}}}T}}} \right)\quad ,$$
where E(T) is a temperature dependent activation energy and k B is the Boltzmann constant. Referring to Fig. 1, the viscosity data approach a linear region at high temperatures in the Angell-plots, indicating an asymptotic limit for the high temperature activation energy. For many molecular liquids, Novikov and Solokov Reference Novikov and Sokolov50 have shown that E(T) follows the conventional fragility parameter, m,
 $${E \mathord{\left/ {\vphantom {E {{T_{\rm{g}}}}}} \right. \kern-\nulldelimiterspace} {{T_{\rm{g}}}}} = \left( {{{19.2}^2}} \right)\ln {{10} \mathord{\left/ {\vphantom {{10} m}} \right. \kern-\nulldelimiterspace} m}\quad .$$
It is, however, not clear how well this relationship holds for metallic glasses, since data for both low and high temperature viscosities are available only for a limited number of BMGs.
B. Reduced temperatures as a measure of fragility
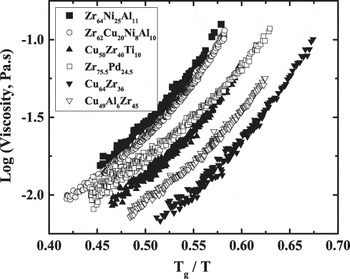
The high temperature viscosities of glass-forming metallic liquids have been measured by a number of groups using containerless (electromagnetic and electrostatic) measurement techniques. Reference Blodgett, Egami, Nussinov and Kelton28,Reference Egry, Lohofer, Seyhan, Schneider and Feuerbacher51–Reference Rhim, Ohsaka, Paradis and Spjut57 However, none other than our group Reference Blodgett, Egami, Nussinov and Kelton28 tried to find a connection between high temperature viscosity and fragility of metallic glasses. Figure 5 shows some of the representative data.
Logarithmic plots of viscosity and reduced temperature (T g/T) as Angell-plots for a few representative metallic liquids, measured using the ESL technique.

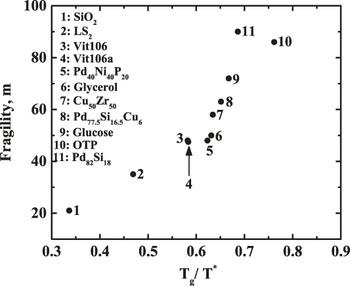
We have developed a method Reference Gangopadhyay, Pueblo, Johnson, Dai, Aschcraft, Van Hoesen, Sellers and Kelton58 to extract the dynamical fragility from the high temperature viscosity data using arguments similar to those made by Martinez and Angell, Reference Martinez and Angell26 which were discussed in Sec. II.C. This approach was dictated by the limited range of viscosity data that can be acquired by the oscillating drop technique in ESL. Reference Rhim, Ohsaka, Paradis and Spjut57 Since the viscosities of most of the metallic alloy liquids extend near/up to 0.1 Pa s, the corresponding reduced temperature T g/T* has been chosen as a measure of relative fragility (η = 0.1 Pa s at T*). To check that this approach works, the values of T g/T* are plotted in Fig. 6 with the fragility parameter, m, for a few metallic liquids for which both sets of data are available; data for a few molecular liquids are also included for comparison. The one-to-one correspondence with the conventional fragility parameter confirms that T g/T* is a good measure of liquid fragility. T g/T* is smaller for the stronger liquids and larger for the fragile ones, which is similar to the trend for the fragility parameter m, but opposite to the fragility parameter, D. Similar to the case discussed in Sec. II.C, the choice of T* at 0.1 Pa s viscosity is merely a matter of convenience. If data for all liquids under consideration were available at some other magnitude of the viscosity, those reduced temperatures could be used as equally valid measures of fragility. For that reason, a functional relationship between m and T g/T* is not of much interest for the ensuing discussions.
The dynamical fragility parameter, m, for a few metallic and molecular glasses are plotted with T g/T*, where T* is the temperature at which viscosity is 0.1 Pa s. Viscosity data used here were taken from Ref. Reference Sipp, Bottinga and Richet59 for SiO2; Ref. Reference Weingartner, Pueblo, Nogueira, Kelton and Nussinov60 for LS2; Ref. Reference Blodgett, Egami, Nussinov and Kelton28 for Cu50Zr50, Vit106, and 106a; Ref. Reference Tsang and Kui61 for Pd40Ni40P20, Pd82Si18, and Pd77.5Si16.5Cu6; Ref. Reference Schroeter and Donth62 for glycerol; Ref. Reference Parks, Barton, Spaght and Richardson63 for glucose; Ref. Reference Laughlin and Uhlmann64 for OTP. The fragility parameters, m, were taken from Ref. Reference Sokolov, Kisliuk, Quitmann, Kudlik and Rossler29 for SiO2 and OTP, Ref. Reference Weingartner, Pueblo, Nogueira, Kelton and Nussinov60 for LS2, Ref. Reference Russew, Stojanova, Yankova, Fazakas and Varga65 for Cu50Zr50, Ref. Reference Johnson, Na and Demetrieu66 for Vit106 and 106a, Pd40Ni40P20, Pd82Si18 and Pd77.5Si16.5Cu6, Ref. Reference Schroeter and Donth62 for glycerol, and Ref. Reference Weingartner, Pueblo, Nogueira, Kelton and Nussinov60 for glucose.

C. Crossover temperature, T A
As mentioned earlier, the activation energies for viscosity and diffusion coefficients for liquids [Eq. (5)] are, in general, temperature dependent. Not far above T l, it becomes temperature-independent, i.e., showing an Arrhenius behavior. This “crossover” from Arrhenius to non-Arrhenius behavior has become a subject of discussion in recent years. Reference Blodgett, Egami, Nussinov and Kelton28,Reference Mallamace, Branca, Corsaro, Leone, Spooren, Chen and Stanley67–Reference Gotze and Sjogren75 The crossover temperature, T A, has been used to reduce the temperature scale to collapse the viscosity data of many metallic Reference Blodgett, Egami, Nussinov and Kelton28 and molecular Reference Mallamace, Branca, Corsaro, Leone, Spooren, Chen and Stanley67 liquids. MD and theoretical studies that address the significance of this temperature are discussed later in Sec. IV.C. Setting aside the details, the consensus view that has emerged is that the crossover temperature marks the onset of cooperativity. Reference Mallamace, Branca, Corsaro, Leone, Spooren, Chen and Stanley67–Reference Garrahan and Chandler74 The dynamics of the liquid below T A involves cooperative movement of the atoms, although the size of the cooperative regions may differ in different theories. Mode-coupling theories also envisage such a transition to collective dynamics at lower temperatures Reference Gotze and Sjogren75 ; the mode-coupling temperature, T c, lies between T g and T l. In contrast, the crossover temperature may lie either above or below T l. Reference Jaiswal, Egami, Kelton, Schweizer and Zhang72 It is our observation that T A for the stronger metallic liquids lie 10–20% above T l and for the fragile ones near/below T l.
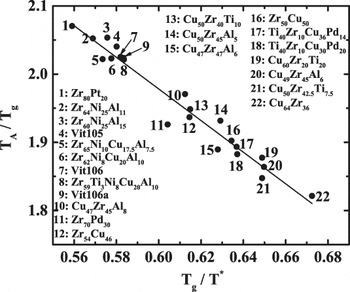
Interestingly, the reduced crossover temperature T A/T g tracks the fragility, m for many molecular and network-forming liquids. Reference Jaiswal, Egami, Kelton, Schweizer and Zhang72 The ratio T A/T g is larger for the stronger liquids and smaller for the fragile liquids, opposite to the conventional fragility parameter m. What this implies is that the crossover occurs at much higher temperatures compared to T g for the stronger liquids; for the most fragile liquids the cooperativity may set in even very close to T g (T A/T g ∼ 1). Reference Johnson, Na and Demetrieu66 For the metallic glasses, due to the absence of reliable fragility parameter data (m), the first studies for a few BMGs found an approximate value of T A/T g ∼ 2. Reference Blodgett, Egami, Nussinov and Kelton28 We have now examined the viscosity for a large number of good- and marginal-glass-forming liquids at T > T l and in the supercooled regions. Since it was shown earlier (Fig. 6) that, in the absence of m, T g/T* may be used as a good measure of fragility, the T A/T g data were compared with T g/T*. Figure 7 shows a plot for twenty-two metallic liquids, demonstrating that T A/T g lies between 1.8 and 2.07 for the liquids studied and follows the relationship, T A/T g = 3.37(0.07) − 2.32(0.11)T g/T*, with a regression coefficient for the fit of 0.96. Since T g/T* is not a traditional measure of fragility, the exact functional relationship may not be that interesting to a broader audience. However, what is important is that, similar to the molecular and network-forming liquids, the reduced crossover temperature decreases with increasing fragility (larger T g/T*) for metallic liquids. The metallic liquids are not exceptional, but behave just like other liquids.
Reduced crossover temperature, T A/T g, of many metallic liquids follow the fragility parameter, T g/T*, which is equivalent to the conventional fragility parameter, m, determined near T g. Viscosities were measured by our group using the oscillating droplet technique in ESL. Reference Gangopadhyay, Pueblo, Johnson, Dai, Aschcraft, Van Hoesen, Sellers and Kelton58

The examples provided in Sec. III.C clearly demonstrate that the dynamic properties of liquids at high temperatures can be effectively used to measure fragility. The importance of this observation is that because of the many limitations of such measurements near T g for the metallic glasses, such high temperature viscosity measurements can be used to expand the database for fragility of metallic liquids significantly. This would be impossible otherwise using traditional experimental techniques.
On a cautionary note, if a liquid–liquid (LL) transition were to occur below T l, the use of high temperature dynamical properties to estimate fragility becomes problematic. In the conventional sense, a LL-transition is defined by a sudden change in the local order in a liquid as a function of temperature/pressure in a manner characteristic of a phase transition. The existence of a LL-transition is hotly debated for liquid water (see Ref. Reference Xua, Petrika, Scott Smith, Kaya and Kimmela76 and the references therein) and silicon. Reference McMillan, Wilson, Wilding, Daisenberger, Mezouar and Greaves77 For metallic glasses, it is even more disputed; despite several claims of its existence in glass-forming metallic liquids, Reference Zhang, Hu, Yue and Mauro78–Reference Stolpe, Jonas, Wei, Evenson, Hembree, Yang, Meyer and Busch80 the issue is far from settled. Reference Li, Schroers and Wu81,Reference Lan, Blodgett, Kelton, Ma, Fan and Wang82 The debate focuses on whether the observed phenomenon indicates a phase transition or a crossover. Since such phenomena are uncommon in metallic liquids, fragilities can be reliably estimated from the dynamical properties of the high temperature liquids in most cases. In fact, this is preferable when connecting structural changes with the dynamical properties at high temperatures, as described in Sec. IV.
IV. CONNECTION BETWEEN LIQUID STRUCTURE, DYNAMICS, AND FRAGILITY
A. Earlier experimental results
A connection between dynamics and structure is anticipated from many models of glasses, yet compared to the large number of experimental investigations of dynamical properties of metallic liquids, structural studies are relatively few. Dense random Reference Bernal83 and efficient packing of atoms Reference Miracle84 and atomic clusters Reference Sheng, Luo, Alamgir, Bai and Ma85,Reference Ma86 have been used successfully to describe the structures of many old and new generation of metallic glasses. Except for unusual circumstances, such as a liquid/liquid phase transition, Reference Xua, Petrika, Scott Smith, Kaya and Kimmela76,Reference McMillan, Wilson, Wilding, Daisenberger, Mezouar and Greaves77 the glass is believed to be the end result of a continuously changing liquid with decreasing temperature. Therefore, it is expected that structural changes with temperature in high temperature liquids should reflect changes in the dynamical properties that eventually lead to a 17 orders of magnitude increase in viscosity. As will be discussed in Sec. IV.C this is in agreement with the results of MD simulations, which demonstrate structural changes that are associated with the crossover temperature in binary Cu–Zr alloys, as well as a general connection between structure and dynamics. Reference Cheng, Sheng and Ma87,Reference Ding, Cheng and Ma88
However, the amount of direct experimental evidence for this connection is sparse. As already mentioned, structural studies of high melting temperature liquids are difficult because of sample contamination from the container material and the environment. Containerless processing under high vacuum (≈10−7 torr or better) has proven to be very useful in not only mitigating those problems, allowing structural and dynamic property measurements of both equilibrium and, in some cases, deeply supercooled liquids. Prior to the introduction of containerless processing, studies were largely confined to equilibrium liquids and to glasses. The territory between T l and T g was a “no man’s land” since rapid crystallization prevented studies. Lacking information to the contrary, it was assumed that the properties of the equilibrium liquid smoothly extrapolated to the glass as the temperature was decreased. Our efforts over the last decade have been directed toward exploring metallic liquids in the range between T l and T g using the ESL technique. Reference Gangopadhyay, Lee, Kelton, Rogers, Goldman, Robinson, Rathz and Hyers20,Reference Mauro and Kelton21 Initially, the focus was on liquid structures, using the ESL in conjunction with synchrotron X-ray scattering. Reference Kelton, Lee, Gangopadhyay, Hyers, Rathz, Rogers, Robinson and Robinson89–Reference Mauro, Blodgett, Johnson, Vogt and Kelton98 More recent activities have been directed toward exploring the connection between structure and liquid dynamics. Reference Gangopadhyay, Pueblo, Johnson, Dai, Aschcraft, Van Hoesen, Sellers and Kelton58,Reference Mauro, Johnson, Bendert and Kelton95–Reference Mauro, Blodgett, Johnson, Vogt and Kelton98 Such studies have provided some of the most compelling experimental evidence thus far that (a) changes in liquid structure with temperature are linked with liquid dynamics and (b) that the idea of a linear extrapolation of the properties and structures of metallic liquids from T l to T g is incorrect.
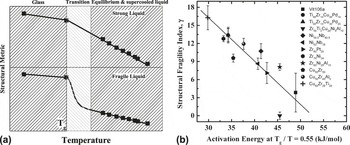
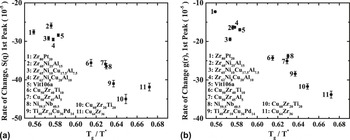
It should be pointed out that the first evidence for these two points Reference Louzguine-Luzgin, Belosludov, Yavari, Georgarakis, Vaughan, Kawazoe, Egami and Inoue99 comes not from containerless studies, but from conventional sample-in-container measurements of a moderately good glass-former, Pd42.5Cu30Ni7.5P20. The temperature-evolution of the intensity of a shoulder on the low-r-side of the first peak of the pair distribution function (PDF), G(r), for this liquid was found to correlate with the rise in viscosity with decreasing temperature. It was suggested that the growing sub-peak indicated the development of chemical short-range order [(Cu–Ni)–P bonding], which led to the rise in viscosity. The Pd42.5Cu30Ni7.5P20 liquid is somewhat unusual; the resistance to crystallization in this good glass-forming liquid allows studies of the supercooled liquid to be made in a container. Most metallic liquids, however, crystallize too easily to be studied in this way. The containerless techniques enabled far more extensive studies for a possible relationship between structure and dynamics over a wide range of metallic liquids. Results from these studies are schematically illustrated in Fig. 8. If the height of the first peak in the X-ray structure factor, S(q), in metallic liquids is linearly extrapolated from high temperatures to T g, it fails to intersect with the measured value in the glass [Fig. 8(a)] in most cases. As discussed in Sec. III.A, in an Angell plot, the activation energy of the viscosity at high temperatures near T l reflects the fragility Reference Novikov and Sokolov50 ; the activation energy is larger for stronger liquids. The mismatch between the extrapolated height of S(q) in the liquid and that of the glass correlates well with the high temperature activation energy for twelve metallic liquids, as shown in Fig. 8(b); the mismatch is smaller for the stronger liquids and larger for the fragile liquids. The mismatch at T g indicates that the evolution of S(q) with temperature is nonlinear in supercooled liquids. The results showing that the nonlinearity in S(q,T) are smaller for the stronger liquids are consistent with the smaller deviation from Arrhenius behavior of the viscosity of stronger liquids. Reference Angell9
(a) Schematic illustrations of the mismatch of the linearly extrapolated first peak height of the X-ray structure factor, S(q), from high temperatures for liquids, to that of the glasses at T g. The amount of mismatch is different for strong and fragile liquids. This mismatch is plotted in (b) as a function of the high temperature activation energy for twelve metallic liquids [Reprinted by permission from Macmillan Publishers Ltd.: Nature, Reference Martinez and Angell26 copyright (2001)].

Another experimental study reported a correlation between structural changes just above T g and the fragility parameter, m. Reference Wei, Stolpe, Gross, Evenson, Gallino, Hembree, Bednarcik, Kruzic and Busch100 The authors measured the temperature-dependent shifts in the peak positions of G(r), which is the Fourier transformation of S(q). They found that the normalized rates of shifts in the peak positions (with respect to the values at T g) correlate with fragility only for the first and fourth peaks; curiously the changes are smaller and negative for the first peak, but larger and positive for the fourth peak for more fragile liquids. It is not clear, however, why the correlations should be opposite for the first and fourth peaks and no correlations for the second and third peak positions.
B. More recent experimental results
As shown by the work discussed in the last section, both the short- and medium-range order of a metallic liquid increase with decreasing temperature. This is reflected in the increase in the peak heights, decrease in the peak widths, and shifts in the peak positions of S(q), G(r), and the pair-correlation function, g(r),
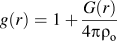 $g\left( r \right) = 1 + {{G\left( r \right)} \over {4\pi {\rho _{\rm{o}}}}}$
, where ρo is the average number density at the corresponding temperature. But, which of these quantities should be chosen as the best metric for ordering? Based on our experience, the shifts in the peak positions of S(q) and g(r) are probably the most inappropriate choices.
The peaks in S(q) shift to higher q (q = 2π/d, where d is some characteristic length) with decreasing temperature. For crystalline solids, the volume and the characteristic length are related by a simple relationship V ∝ d 1/3, which allows accurate measurements of the linear thermal expansion from the shifts of the positions of the X-ray diffraction peaks with temperature. For a metallic liquid, however, the characteristic length obtained from the first peak of S(q) does not scale with the volume in the same way as the crystal; for the liquid V ∝ d 0.43±0.02. Reference Gangopadhyay, Blodgett, Johnson, Vogt, Mauro and Kelton93 Similar values for the exponent were obtained for many metallic glasses at ambient temperature and pressure Reference Ma, Stoica and Wang101 and in a single alloy under high pressure. Reference Zenga, Linb, Liue, Zenga, Shib, Zhang, Loua, Sinogeikin, Kono, Bensong, Park, Yang, Wang, Sheng, Mao and Mao102 Initially, the unusual exponent was attributed to the fractal nature of the medium-range order. Reference Ma, Stoica and Wang101 However, this was subsequently questioned Reference Gangopadhyay, Blodgett, Johnson, Vogt, Mauro and Kelton93 since the exponent was shown to be temperature-independent and remained unaltered even at temperatures much higher than T l, where such medium-range order was not expected to survive, especially for the simple binary liquids. Measurements of the asymptotic decay of the PDF peaks from neutron diffraction measurements over large distances (20 Å) for three Au–Si and Au–Ge liquids and solid alloys strengthen this argument. Reference Chirawatkul, Zeidler, Salmon, Takeda, Kawakita, Usuki and Fischer103 It was concluded that the decay followed the usual damped oscillations expected from Ornstein–Zernike equations for hard sphere liquids; there was no special need to invoke fractal networks in those liquids.
The temperature dependence of the peak positions in g(r) shows quite interesting behavior. For elemental liquids, the first peak position decreases with increasing temperature (i.e., contraction instead of expansion). Reference Lou, Wang, Cao, Zhang, Zhang, Hu, Mao and Jiang104 In contrast, the first peak position in alloy liquids may show either contraction or expansion, depending on the contributions of the partials to the total pair-correlation. Reference Gangopadhyay, Blodgett, Johnson, McKnight, Wessels, Vogt, Mauro, Bendert, Soklaski, Yang and Kelton94 When the first peak is dominated by a single partial, it shows contraction, similar to what is observed in elemental liquids. What is the reason for this anomalous behavior? One suggestion Reference Gangopadhyay, Blodgett, Johnson, McKnight, Wessels, Vogt, Mauro, Bendert, Soklaski, Yang and Kelton94,Reference Lou, Wang, Cao, Zhang, Zhang, Hu, Mao and Jiang104 is that it arises from a decrease in the coordination number with increasing temperature; a smaller coordination number implies stronger bonding and hence, a contraction. Reference Gangopadhyay, Blodgett, Johnson, McKnight, Wessels, Vogt, Mauro, Bendert, Soklaski, Yang and Kelton94 For all cases (elemental and alloy liquids) studied, the positions of the higher order peaks indicate the usual expansion with increasing temperature. However, the amount of expansion is different for the different peaks and none have the same magnitude expected from volume expansion measurements. Reference Gangopadhyay, Blodgett, Johnson, McKnight, Wessels, Vogt, Mauro, Bendert, Soklaski, Yang and Kelton94 Similar results have been reported from a MD study. Reference Ding, Xu, Guan, Deng, Cheng and Ma105 These results indicate that the thermal expansion coefficients are inhomogeneous at the atomic scale. Interestingly, the distribution of strain with external stress has also been found to be inhomogeneous at the atomic scale in metallic glasses. Reference Poulsen, Wert, Neuefeind, Honkimaki and Daymond106–Reference Dmowski, Iwashita, Chuang, Almer and Egami108 Consistent with these observations, the vibrational dynamics of a prototypical glass, SiO2, show isotropic behavior at large wavelengths and anisotropic behavior at small wavelengths comparable to the short- and medium-range order in glasses. Reference Baldi, Zanatta, Gilioli, Milman, Refson, Wehinger, Winkler, Fontana and Monaco109 All these results point to anisotropic, heterogeneous response of a glass to strain and temperature at small length scales. Rejuvenation of metallic glasses under thermal cycling from cryogenic temperatures has been suggested to be because of such anisotropic behavior. Reference Ketov, Sun, Nachum, Lu, Checchi, Beraldin, Bai, Wang, Louzguine-Luzgin, Carpenter and Greer110
Because of the complex behavior discussed, changes in peak positions for either S(q) or g(r) are questionable metrics for examining structural changes in liquids. The rates of change of the peak height and peak width are more reliable. Because the heights are different for the different liquids, they must be normalized. Since the liquidus temperature, T l, lies nearly at the middle of the temperature range of the experimental data, it was chosen for convenience as the normalizing temperature. T l is strictly determined from the equality of the chemical potentials of the liquid and solid phases and has no apparent relation to the dynamical behavior, although as mentioned in Sec. V, it may couple weakly with the dynamics through a Lindemann-type process. The data in Figs. 9(a) and 9(b) show the important result that the changes of the first peak heights of S(q) and g(r) with temperature both follow the fragility. Similar to the other observation already discussed, the rates are smaller for the stronger liquids and larger for the more fragile ones. The rates of changes with temperature for the first peak width also show similar trends. A comprehensive set of data and more discussion on this observation can be found elsewhere. Reference Gangopadhyay, Pueblo, Johnson, Dai, Aschcraft, Van Hoesen, Sellers and Kelton58 In closing, all of the experimental studies thus far point to a clear connection between the rates of changes in the liquid structure (peak height, width) with temperature and fragility.
(a) Normalized rates of change of the first peak heights of S(q) as a function of fragility (T g/T*); (b) is the same for the first peak height of g(r).

C. MD studies
Significant advances in hardware and software, particularly over the past two decades, have allowed computer simulations to become a powerful complement to experimental investigations. For studies of metallic liquids and glasses the most common simulations include Reverse Monte Carlo (RMC) approaches for extracting plausible atomic configurations from experimental scattering data, and MD simulations that allow the time evolution of structure and associated properties to be realistically modeled. While important for structure determination, RMC is not central to the focus of this review; reviews of the technique as well as some illustrating its application to metallic liquids and glasses may be found elsewhere. Reference McGreevy and Wicks111,Reference McGreevy112 Of more central interest here are the results of some MD simulations that have provided new insight into the relations between structure and dynamics.
In an MD simulation, Newton’s equations of motion are solved iteratively for an ensemble of atoms to obtain time-dependent trajectories. From this, it is possible to watch the evolution of the atomic structure as a function of time and temperature, and to identify heterogeneities within the structure that dictate the dynamics and physical properties (see Ref. Reference Cheng and Ma113 for a recent review of MD methods and their uses in structural/property investigations). Two approaches are generally followed. The most fundamental method, quantum or ab initio MD, uses density functional theory to describe the interactions among the atoms in the ensemble. Unfortunately, these are computationally expensive calculations that can only be made for very small ensembles (∼100–200 atoms) and short simulation times (∼picoseconds), compared to the experimental time-scales. Even for liquids, these two constraints severely limit studies of the development of atomic order. For glasses, they are totally inadequate for realistically describing structural ordering and properties. Classical MD, using effective pair potentials such as embedded atom potentials, has been used to address these concerns. Large ensembles, sometimes containing one million atoms or more, can be treated for simulation time-scales of tens to hundreds of nanoseconds. Although this time scale is still too short to model relaxation processes near the glass transition (which are eight to ten orders of magnitude longer), they are ideally suited for studies of the high temperature liquids, where the relaxation times are of order of picoseconds or more. With the development of accurate embedded atom potentials, the MD structures obtained for many binary and ternary glass-forming liquids are in good agreement with experimental measurements. Reference Jakse and Pasturel114–Reference Zhang, Mendelev, Wang and Kelton116
MD simulations show the development of topologically and chemically ordered regions in metallic liquids with decreasing temperature, which appear to percolate through the liquid at the glass transition temperature. Reference Soklaski, Nussinov, Markow, Kelton and Yang117 Often these regions have an icosahedral short-range order, Reference Lan, Blodgett, Kelton, Ma, Fan and Wang82 which is in agreement with experimental studies. Reference Kelton, Lee, Gangopadhyay, Hyers, Rathz, Rogers, Robinson and Robinson89,Reference Schenk, Holland-Moritz, Simonet, Bellissent and Herlach118 These structural heterogeneities have been argued to correlate with dynamical heterogeneities in the glass. Reference Cheng, Cao and Ma119,Reference Ding, Cheng and Ma120 Experimental studies clearly give evidence for structural ordering at high temperature in metallic liquids. Since the results of MD simulations can be more realistically compared with experimental data in high temperature liquids than for glasses, it is of particular interest to investigate the possible correlations between structural ordering and dynamical behavior.
It is well known that crystals support elementary excitations, phonons, which couple to dynamical processes such as diffusion. The existence of similar fundamental excitations in liquids has traditionally been viewed as unlikely. The results from a series of recent MD simulations, however, have re-opened this question. Reference Iwashita, Nicholson and Egami69,Reference Fan, Iwashita and Egami71,Reference Iwashita and Egami121 They suggest a “bond-breaking” mechanism that plays the role of a fundamental excitation. As already discussed, experimental and MD studies suggest that even at high temperatures, locally ordered clusters form in the liquid. However, these are short-lived, with atoms switching between neighboring clusters and changing the cluster coordination number. The time required to change the coordination number of a cluster by one atom (τLC) is very short at high temperatures and there is insufficient time for a fluctuation in one cluster to influence nearby clusters. Dynamical fluctuations, therefore, occur independently, governed by the average energy required for an atom to leave or join a cluster. As the temperature is lowered, however, the fluctuations become sufficiently long lived that they begin to influence nearby clusters, and the cluster dynamics become cooperative. This starts to happen at a crossover temperature, T A, which is characteristic of the particular liquid.
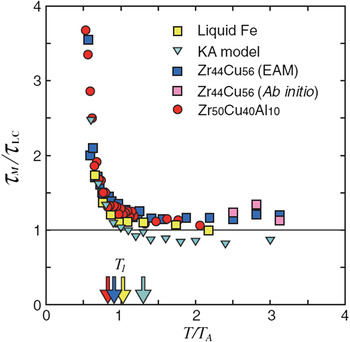
Of central importance, these MD studies indicate that such cluster fluctuations underlie the macroscopic dynamical properties, such as the shear viscosity. This is illustrated in Fig. 10, showing results from MD simulations for one ab initio and a number of embedded atom potentials that represent a range of metallic liquids. In all cases, the ratio τM/τLC (where τM is the Maxwell relaxation time for viscous flow, computed from the MD simulations) is constant above T A, indicating that the shear viscosity is determined by the energy required to change the cluster coordination by one. Since this is a well-defined, temperature-independent energy, these simulations predict an Arrhenius temperature dependence for the viscosity above T A. Below T A, τM rapidly becomes larger than τLC, reflecting an increasing cooperation between the cluster dynamics. With increasing cooperativity, the viscosity becomes super-Arrhenius, showing an increasing activation energy with decreasing temperature. It needs to be remembered that the concept of a crossover temperature is fairly old as was discussed in Sec. III.C. The MD results provide a local structural mechanism for the onset of this important temperature. Interestingly, as shown in Fig. 10, T A is predicted to be close to the liquidus temperature, T l, which has been observed experimentally. Reference Blodgett, Egami, Nussinov and Kelton28 This may suggest a Lindemann-type mechanism that is associated with the dynamics of melting, since as mentioned earlier T l is strictly determined from thermodynamic considerations. Other predictions from these MD simulations also are found in experimental data, Reference Blodgett, Egami, Nussinov and Kelton28 such as a universal scaling for the shear viscosity suggested from the behavior of the relaxation times in Fig. 10. The results from these simulations strongly argue that the macroscopic dynamics arise from microscopic fluctuations that are related to structural ordering.
The ratio τM/τLC as a function of T/T A from MD simulations for ab initio and various embedded atom potentials for elemental Fe and two BMGs. The liquidus temperatures (T l) are indicated [Reprinted from Ref. Reference Iwashita, Nicholson and Egami69, copyright (2013), American Physical Society].

The first experimental confirmation of a universal scaling behavior in the shear viscosity for liquid metals also revealed two other interesting points. First, the viscosity extrapolated to infinite temperature, η0, for all of the metallic liquids studied is equal to Planck’s constant multiplied by the number density,
Reference Blodgett, Egami, Nussinov and Kelton28
as was suggested by Eyring
Reference Eyring122
many years ago. Second, T
l was found to be approximately 2T
g. As already shown in Fig. 7, later measurements found that this ratio actually varies with the fragility of the liquids, similar to the molecular liquids.
Reference Jaiswal, Egami, Kelton, Schweizer and Zhang72
A correlation between T
A and T
g suggests that the glass transition is related to the growing cooperativity in the dynamics and might even be the end product of a continuous ordering process that starts at T
A. An important question, then, is: “What is the nature of the structural ordering that starts at T
A and underlies the processes that eventually result in the glass transition?” A recent MD simulation for the binary Cu64Zr36 liquid addresses this question.
Reference Soklaski, Tran, Nussinov, Kelton and Yang123
The calculated viscosities from this MD study agree with the experimental data in this alloy liquid, showing a crossover from high-temperature Arrhenius behavior to super-Arrhenius behavior at T
A, which is approximately 2T
g (although the values for T
A and T
g are considerably larger than the experimental data). Like the earlier MD simulations,
Reference Iwashita, Nicholson and Egami69
the ratio τM/τLC is unity at high temperatures and grows dramatically upon decreasing the temperature below T
A [Fig. 11(a)]. As other MD studies have shown,
Reference Ding, Cheng and Ma88
icosahedral ordering (IO) increases with decreasing temperature in this liquid. Above T
A, this ordering is in the form of isolated icosahedral clusters. Below T
A, these connect to form extended IO [illustrated schematically in the insert to Fig. 11(a)]. Another crossover temperature, T
D, is also identified in these MD simulations [Fig. 11(a)] below T
A, which was not observed in earlier MD studies. This is based on the ratio of the Maxwell relaxation time to the average time required for an icosahedral cluster within a domain of interpenetrating icosahedra to gain or lose a vertex atom or otherwise distort its shape,
 ${\tau _{\rm{M}}}{\rm{/}}\tau _{{\rm{icos}}}^{({\rm{FLD}})}$
. This ratio is smaller than unity at high temperatures, becomes one at T
D, and grows dramatically as the temperature is decreased. Very striking is that above T
D the probability of a cluster belonging to a network of clusters is small, while near T
D this grows dramatically so that essentially all of the clusters are associated with domains. The MD results suggest that T
D is also related to T
g (∼1.4T
g for this binary alloy), although this needs to be investigated more thoroughly. Interestingly, structural anomalies near this temperature have been reported recently from experimental structural studies, which the authors suggested as evidence for a crossover temperature for one case
Reference Lan, Blodgett, Kelton, Ma, Fan and Wang82
and a liquid–liquid transition for the other.
Reference Stolpe, Jonas, Wei, Evenson, Hembree, Yang, Meyer and Busch80
The MD results are interesting, not only indicating the strong connection between structure and dynamics, but also potentially revealing new insight into the glass transition and how it begins.
(a) Results from MD simulations for the ratio τM/τLC (blue circles) and
 ${\tau _{\rm{M}}}{\rm{/}}\tau _{{\rm{icos}}}^{\left( {{\rm{FLD}}} \right)}$
(
 $\tau _{{\rm{icos}}}^{({\rm{FLD}})}$
is the domain-connected icosahedron lifetime). Inset—2D cooperative rearrangements that begin at T
A and T
D. (b) The fraction of the total number of icosahedra in a domain connected icosahedron (Reprinted from Ref. Reference Soklaski, Tran, Nussinov, Kelton and Yang123 with permission: Taylor and Francis Ltd. www.tandfonline.com).

V. OTHER THEORETICAL MODELS CONNECTING STRUCTURE AND DYNAMICS
The above discussions are confined to MD studies using realistic ab initio or embedded atom potentials for metallic liquids that connect dynamics with the evolving structure. Considerable efforts have been made to understand glassy dynamics from the MD studies of Lennard–Jones-type potentials using the potential energy landscape (PEL) models. Reference Sastry, Debenedetti and Stillinger73,Reference Sastry124–Reference Debenedetti, Truskett and Lewis126 Instead of the topological structures of liquids, these models investigate the topology of the PEL in the 3N-dimensional space visited by the liquid as temperature is decreased. As the dynamics changes from an Arrhenius to non-Arrhenius temperature dependence, below a characteristic temperature similar to T A the potential energy minima explored by the system changes from temperature-independent depths to increasing depths. Reference Sastry, Debenedetti and Stillinger73 The depths and spreads (vibrational properties) of the minima differ significantly for the strong and fragile liquids Reference Sastry124 ; a nondegenerate ground state that follows a Gaussian distribution of the vibrational states characterizes the fragile liquids, while it degenerates and follows logarithmic statistics for the strong liquids. Reference Debenedetti, Truskett and Lewis126 Since the literature on the PEL model is too expansive to be covered in this short review, we refer to reviews on this important topic. Reference Debenedetti, Truskett and Lewis126,Reference Stillinger127 Below, we discuss a few relevant theories that make a direct connection between liquid structure and dynamics.
A. Diffusivity and viscosity from structural correlation functions
The first detailed statistical mechanical treatment for energy and mass transport (thermal conduction, viscosity) for a system of N particles in a volume V (number density n = N/V) was developed by Born and Green. Reference Born and Green128 They argued that while thermal motion of atoms dominates energy transfer in gases, intermolecular forces dominate the processes in liquids. This formalism has been further developed to give an expression for the excess entropy of the liquid compared to the disordered gas in terms of the two-particle, three-particles, and higher order correlation functions. Reference Wallace129–Reference Wallace131
In the Born–Green formalism, the excess entropy is
 $$S = {S_1} + {S_2} + {S_3} + {S_4} + \cdots \quad ,$$
where S i is the correlation function for i-number of atoms. The two- and three-particle correlation functions are (units of k B, the Boltzmann constant)
 $${S_2} = - 2\pi \rho \int_0^\infty {\left[ {g\left( r \right)\ln g\left( r \right) - \left\{ {g\left( r \right) - 1} \right\}} \right]} {r^2}{\rm{d}}r\quad ,$$
 $${S_3} = - {{2\pi \rho } \over 3}\int_0^\infty {{g^{\left( 3 \right)}}\left( {r,p,q} \right)\ln \delta {g^{\left( 3 \right)}}\left( {r,p,q} \right){p^2}{q^2}{\rm{d}}p{\rm{d}}q} \quad ,$$
where ρ is the number density, r i the position of the ith particle, g 3 the three-particle correlation function, and r = r 1 − r 2, p = r 2 − r 3, and q = r 3 − r 1. The excess entropy can be estimated if the two-particle and higher order correlation functions are known. A connection of this excess entropy with a dynamical property, the diffusion coefficient (D), became possible when Dzugutov Reference Dzugutov132 reported that a dimensional quantity, D* = D/T Eσ2 follows a simple scaling relationship for both liquids and solids,
 $${D^ * } = 0.049{e^{{S_2}}}\quad ,$$
where T
E is the collision frequency at temperature T (
 ${T_{\rm{E}}} = 4{\sigma ^2}g\left( \sigma \right)\sqrt {\pi {k_{\rm{B}}}T{\rm{/}}M}$
, g(σ) is the height of the first maximum in g(r), σ the first peak position, and M the atomic mass). In principle, then, the liquid diffusion coefficient can be estimated from the structural data. At temperatures higher than T
l, it is also possible to estimate the viscosity from the diffusion coefficient using the Stokes–Einstein relationship:
 $$\eta = {{{k_{\rm{B}}}T} \mathord{\left/ {\vphantom {{{k_{\rm{B}}}T} {3\pi \sigma D}}} \right. \kern-\nulldelimiterspace} {3\pi \sigma D}}\quad .$$
This becomes problematic, however, at lower temperatures because of the breakdown of this relationship. Reference Bartsch, Rätzke, Meyer and Faupel133,Reference Swallen, Traynor, McMahon, Ediger and Mates134
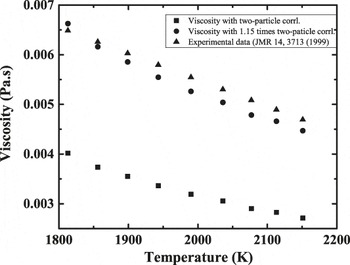
Although it is straightforward to estimate the contribution of the two-particle correlation function to the excess entropy [Eq. (8)] from diffraction measurements, the difficulty lies with the estimation of higher order terms. This may be done with computer simulation studies, Reference Laird and Haymet135–Reference Berthier and Coslovich137 but diffraction data alone are not sufficient to make such estimates. Some estimates have been made for the excess entropy and viscosity of elemental metallic liquids from the structure factors Reference Yokoyama and Arai138 ; agreement to within 20% was achieved with experimental data for Fe, Co, and Ni, measured at T l. In Fig. 12, we compare experimental viscosity data for elemental Zr Reference Paradis and Rhim139 with estimates from our measured structure factors. The viscosity estimated from the excess entropy from the two-particle correlation function (S 2) using our experimental data are shown as black squares; obviously they underestimate the experimental data. To match with the experimental data, 15% excess entropy must be added to S 2 to account for the contributions from higher order correlations. This is in line with numerical estimates for the contribution of S 3 (20%) compared to S 2 for hard sphere systems. Reference Mountain and Raveché140 Similar evaluations for a few binary alloy liquids (Cu50Zr50, Zr76Ni24) showed large deviations from our own experimental data, even after adding a contribution for S 3 similar to that used for Zr. More importantly, to match the rapid increase in experimental viscosity with decreasing temperature, much larger temperature dependent contributions from the higher order terms are required. Chemical interactions in alloys with large negative heats of mixing Reference de Boer, Boom, Mattens, Miedema and Niessen141 are expected to cause a rapid rise in many particle correlations due to short- and medium-range chemical and topological order, Reference Wessels, Gangopadhyay, Sahu, Hyers, Canepari, Rogers, Kramer, Goldman, Robinson, Lee, Morris and Kelton92 which are difficult to estimate from X-ray scattering data alone. Although this model works well for computer simulation studies of simple liquids, Reference Laird and Haymet135–Reference Berthier and Coslovich137 a more useful approach for complex liquids is to study the velocity auto-correlation function, 〈v(t + Δt)·v(t)〉/〈v 2〉. The advent of high flux neutron and synchrotron X-ray sources have opened up the possibility of studying the dynamics from the dynamical structure factor, S(q,ω) as a function of temperature. Studies of elemental liquids using this technique have been discussed in an excellent review. Reference Scopigno, Ruocco and Sette142 Measurements of diffusivities in metallic liquids using quasielastic neutron scattering and levitation techniques have also progressed. Reference Holland-Moritz, Stüber, Hartmann, Unruh, Hansen and Meyer54,Reference Faupel, Frank, Macht, Mehrer, Naundorf, Raetzke, Schober, Sharma and Teichler143 However, no serious attempt has been made thus far to connect the structure and dynamics from those studies.
Experimental viscosity data (Ref. Reference Paradis and Rhim139) for liquid Zr compared with estimates made from the excess entropy of the liquid over gas. The filled squares represent estimates made with a two-particle correlation function, which significantly underestimate the experimental data. Approximately 15% excess entropy was added to account for the contributions from higher order correlation functions (filled circles) to match with the experimental data (filled triangles).

B. Adam–Gibb’s theory
The discussion in the previous section was based on estimates of the dynamics and structure of high temperature liquids starting from the gas phase. What happens to the dynamical and structural properties at lower temperatures on approaching T g is one of the most fundamental problems in the study of glasses, as was alluded to in Sec. II. The most influential early theory that addressed this issue was due to Adam and Gibbs. Reference Adam and Gibbs37 They introduced the concept of cooperative dynamics, assuming an increasing length scale for these cooperative regions with decreasing temperature, which is in general agreement with the results of later MD simulations (Sec. IV.C). The time, τ, to move from one configuration to other had an activation energy that was assumed to be proportional to the volume of the cooperative region and inversely proportional to the configurational entropy, S con,
 $$\tau = {\tau _{\rm{o}}}\exp \left( {{C \mathord{\left/ {\vphantom {C {T{S_{{\rm{con}}}}}}} \right. \kern-\nulldelimiterspace} {T{S_{{\rm{con}}}}}}} \right)\quad .$$
The configurational entropy is usually obtained from thermodynamic parameters as was discussed earlier (Sec. II.C). The basic concept of a growing length scale in the cooperative regions of this popular theory has found support in the experimental evidence for growing dynamical, Reference Berthier, Biroli, Bouchaud, Cipelletti, El Masri, Hote, Ladieu and Pierno144 and static length scales Reference Gangopadhyay, Pueblo, Johnson, Dai, Aschcraft, Van Hoesen, Sellers and Kelton58,Reference Wessels, Gangopadhyay, Sahu, Hyers, Canepari, Rogers, Kramer, Goldman, Robinson, Lee, Morris and Kelton92,Reference Cheng and Ma113,Reference Soklaski, Nussinov, Markow, Kelton and Yang117 in the cooperative regions from structure factor studies. However, there is no indication for a diverging length scale as S con approaches zero. It should be noted that the Adam-Gibbs configurational entropy is the difference between the liquid and underlying crystal phase entropy (Sec. II.C). In contrast, the excess entropy that was considered earlier is the entropy difference from the gas phase. The difference is not trivial, since in the former case the comparison is made with respect to a completely ordered phase (crystal), whereas it is with respect to a completely disordered phase (gas) in the latter. In spite of this difference, one computer simulation study Reference Mittal, Errington and Truskett145 demonstrated that the excess entropy of the liquid over the gas and the configurational entropy from Adam–Gibbs theory are linearly related. Both approaches connect the dynamics with thermodynamics; however, the difference is that the former makes the connection with the static structure factor, whereas the latter to the dynamical structure. A deeper understanding of these differences is therefore needed.
VI. WHAT DEFINES FRAGILITY?
Discussions in Sec. IV.C in the context of metallic liquids and experimental results shown in Fig. 6 establish that the normalized crossover temperature, T A/T g, is a good measure of liquid fragility. More extensive data on molecular and network liquids also support this conclusion. Reference Jaiswal, Egami, Kelton, Schweizer and Zhang72 Since T A is the temperature where the lifetime of the bond of an atom to a local cluster becomes equal to the Maxwell’s relaxation time, and cooperativity sets in, it is natural to expect stronger bonds for stronger liquids (larger T A/T g). This has been supported by recent experimental data that show a connection between fragility and average cohesive energy in metallic liquids Reference Gangopadhyay, Pueblo, Johnson, Dai, Aschcraft, Van Hoesen, Sellers and Kelton58 ; the larger the cohesive energy, the stronger are the liquids. A similar connection between fragility and cohesive energy has also been reported for polymers, Reference Xu and Freed146 although the situation is a little more complicated there. The fragility depends not only on the cohesive energy, but also the polymer chain stiffness; for the same chain stiffness, larger cohesive energy makes stronger liquids, while larger chain stiffness increases fragility. Although liquids are fundamentally different from solids in that liquids cannot sustain shear stress, at sufficiently high frequencies (comparable to bond lifetimes) liquids behave more like a solid. Reference Maxwell147 Based on this behavior, elastic models of liquids have been developed, as discussed in a number of reviews. Reference Nemilov148,Reference Dyre149 It is well known for elemental solids that the bulk modulus and cohesive energy are related. Reference Kittel150 Therefore, the connection between fragility and cohesive energy/bulk modulus is not unexpected from the elastic models, except for one important point. According to the elastic models, Reference Nemilov148,Reference Dyre149 the activation energy for viscosity is related to the high-frequency shear modulus, G ∝. Therefore, a connection between fragility and shear modulus, instead of cohesive energy and bulk modulus, Reference Gangopadhyay, Pueblo, Johnson, Dai, Aschcraft, Van Hoesen, Sellers and Kelton58 is expected. Further investigation is clearly needed to explain this difference.
Extending the parallels between solids and the instantaneous behavior of liquids farther, a more fundamental connection between fragility and the interatomic potential is expected from the relationship between the bulk modulus and cohesive energy with the interatomic potential in solids. Reference Slater151 The idea that the interatomic potential plays an important role in glass formation is rather old, Reference Bennett, Polk and Turnbull152 although the concept of fragility was not developed at that time. In the last decade, several theoretical Reference Bordat, Affouard, Descamps and Ngai153–Reference Michele, Sciortino and Coniglio156 studies have explored the connection between fragility and the interatomic potential. The question is which part of the potential is more important for fragility. As just mentioned, experimental studies of metallic Reference Gangopadhyay, Pueblo, Johnson, Dai, Aschcraft, Van Hoesen, Sellers and Kelton58 and polymer Reference Xu and Freed146 liquids indicate an increase in fragility for smaller cohesive energies. MD simulation studies made using Lennard-Jones type potentials of different hardness and anharmonicity show mixed results. One study Reference Bordat, Affouard, Descamps and Ngai153 reported a decrease in kinetic fragility with increasing hardness and decreasing anharmonicity of the interatomic potential. Another study Reference Sengupta, Vasconcelos, Affouard and Sastry154 reported a decrease in kinetic fragility, but increase in thermodynamic fragility, with increasing hardness of the potential. Other studies found only a modest Reference Shi, Debenedetti, Stillinger and Ginart155 or no increase Reference Michele, Sciortino and Coniglio156 in fragility for softer potentials.
Studies of colloidal suspensions in liquids are useful to delineate the roles of anharmonicity and hardness of the repulsive part of the potential. Experiments on hard sphere colloids at a fixed temperature and increasing number density are free from the complexity of anharmonicity, since the potential is purely repulsive. Using colloids of different hardness, the role of the repulsive part of the potential was studied by Mattson et al. Reference Mattsson, Wyss, Fernandez-Nieves, Miyazaki, Hu, Reichman and Weitz157 The results indicate that soft colloids behave as strong liquids and hard colloids as fragile ones, which is in conflict with the MD results. To understand this discrepancy, it was pointed out Reference Casalini158 that an important distinction between the MD and colloidal studies is that the former is done under isochoric (constant volume) condition and variable temperature, while the latter at constant temperature and changing effective volume/pressure. Dynamics/fragility under constant pressure and constant volume conditions are different, although related, since in the former case the dynamics changes both because of temperature and volume changes. Reference Casalini and Roland159,Reference Casalini and Roland160 On the other hand, dynamics under pressure follow a simple scaling, V −γ, where γ is a material specific parameter; larger γ means the dynamics are dominated by volume (faster rise with decreasing volume), not temperature, which is the case for a steeper potential (stronger repulsion). Reference Casalini and Roland160 The observation that the relaxation time for the harder colloids rises faster with concentration Reference Mattsson, Wyss, Fernandez-Nieves, Miyazaki, Hu, Reichman and Weitz157 (effective volume) is because of their larger exponent, γ. Reference Casalini and Roland160 This apparently gave the impression of increasing fragility for the harder colloids. Reference Mattsson, Wyss, Fernandez-Nieves, Miyazaki, Hu, Reichman and Weitz157 Therefore, the important conclusion that may be drawn from studies of polymers and MD studies is that if the anharmonicity is kept unchanged, steeper repulsion gives rise to stronger liquids.
VII. SUMMARY AND OUTLOOK
Currently, there is debate within some theoretical communities whether there is a connection between structure and dynamics in liquids and glasses. The evidence presented here from experimental studies and MD simulations gives strong support for such a connection. They also show that different measures of fragility obtained from the high temperature structural and dynamical properties of metallic liquids are closely related to the traditional measures of fragility obtained from properties near T g. This finding is of particular importance for many metallic liquids since the traditional measure of fragility is almost impossible to obtain because of rapid crystallization. High temperature data are free from such handicaps. The most reliable metrics for structural changes are the rates of change of the peak heights and widths of S(q) and g(r) with temperature, not the peak positions, as demonstrated for metallic liquids. A very recent study reported a similar correlation between fragility and the rate of change of the first peak width of S(q) with temperature for molecular liquids. Reference Voylov, Griffin, Mercado, Keum, Nakanishi, Novikov and Sokolov161 Therefore, such correlations are probably more common than recognized thus far.
A crossover from the high temperature Arrhenius to low temperature non-Arrhenius behavior in dynamical properties is a hallmark of most of liquids; the crossover temperature, T A, is considered to be the point of onset of cooperativity, Reference Mallamace, Branca, Corsaro, Leone, Spooren, Chen and Stanley67,Reference Sastry, Debenedetti and Stillinger73,Reference Garrahan and Chandler74,Reference Sastry124 However, an atomic-level understanding of T A has been possible only recently from extensive MD studies. Reference Iwashita, Nicholson and Egami69,Reference Jaiswal, Egami, Kelton, Schweizer and Zhang72,Reference Sastry, Debenedetti and Stillinger73,Reference Soklaski, Nussinov, Markow, Kelton and Yang117,Reference Iwashita and Egami121,Reference Soklaski, Tran, Nussinov, Kelton and Yang123 These studies demonstrate an onset of extended structural order at T A. From our studies of metallic liquids (see Fig. 7) Reference Gangopadhyay, Pueblo, Johnson, Dai, Aschcraft, Van Hoesen, Sellers and Kelton58 and those of others on molecular and network liquids, Reference Jaiswal, Egami, Kelton, Schweizer and Zhang72 T A/T g has emerged as a reliable measure of liquid fragility, which is consistent with the traditional measure of fragility. Along with the high temperature activation energy, Reference Novikov and Sokolov50 and structural metrics, this establishes another useful measure for fragility from the liquid properties at high temperatures. More significantly, it demonstrates that the cooperativity that starts at high temperature extends to longer length scales with decreasing temperature, finally causing a dynamical arrest at T g as the liquid transforms into a glass. By these arguments, T A plays a fundamental role in glass formation. Thus far, T A has been determined experimentally only from the dynamical properties, in particular the viscosity. A complementary structural signature has only emerged from MD simulations. That may be changing, however. Some evidence for T A in experimental liquid structure data has been identified very recently in studies of metallic liquids. Reference Dai and Ashcraft162
Studies of the high temperature properties of liquids are needed for another important reason. Because of the several orders of magnitude difference in the relaxation time-scales for experiments and MD studies, a comparison of results is problematic at low temperatures, especially when approaching T g. However, the experimental and MD simulation time-scales are very similar at high temperatures, near and above T l. This allows a much more reliable comparison between experiment and simulation, which leads to a deeper insight into the connections between structure, dynamical, and physical processes in high temperature liquids.
While kinetic and structural fragilities have been discussed at length in this review, we have not discussed the thermodynamic fragility of metallic liquids. This is because of a lack of reliable experimental data for C p at high temperatures. Only a handful of studies have tried to estimate the kinetic fragility from the rate of rise of C p Reference Wei, Evenson, Gallino and Busch163 and change in T g Reference Evenson, Gallino and Busch164 with the heating rate. Traditional measurements (DSC) of C p in the liquid state are possible only for a few low-melting temperature metallic liquids that are robust against crystallization. Reference Lu, Wilde, Goerler and Willnecker165,Reference Wilde, Goerler, Willnecker and Fecht166 As pointed out many times, measurements of metallic liquids at high temperatures are difficult because of contamination problems. For a different reason, levitation techniques are generally inadequate for such measurements. Using the Stefan–Boltzmann relation, it is possible to obtain C p/ε (ε is the sample emissivity) from the radiative cooling curves of levitated liquids under vacuum. Reference Wessels, Gangopadhyay, Sahu, Hyers, Canepari, Rogers, Kramer, Goldman, Robinson, Lee, Morris and Kelton92 However, unless ε(T) is known, the liquid specific heat cannot be extracted. Fortunately, it will soon be possible to measure both C p(T) and ε(T) from experiments in the microgravity environment of the International Space Station. Currently lacking these data, some have attempted to estimate the configurational entropy of metallic liquids by assuming an approximate functional form for C p. Reference Fan, Lavernia, Wunderlich and Fecht167,Reference Fontana and Battezzati168 The correlation between the thermodynamic and kinetic fragilities was found to be poor in one case Reference Fan, Lavernia, Wunderlich and Fecht167 and different forms of the correlation in metal–metal and metal–metalloid liquids were observed in another study. Reference Fontana and Battezzati168 While reliable experimental data for C p are clearly necessary to firmly establish the precise connections, a few MD simulation studies have estimated the rates of change of C p with temperature for binary Cu–Zr, Pd–Ni–Cu–P Reference Ding, Cheng, Sheng and Ma169 and Mg-based Reference Ding, Cheng and Ma170 liquids. Similar to the structural parameters discussed in this review, the rates of change are smaller for stronger liquids and larger for fragile ones.
It should be emphasized that this review is about a work still in progress. Although considerable headway has been made in the understanding of fragility at a fundamental level, a clear consensus has not yet emerged. As discussed in Sec. VI, conflicting reports from MD simulations and colloidal studies have been resolved to some extent. Atomic bond/interactions definitely play a role in determining fragility. However, the relative contributions of the repulsive part of the atomic potential and the anharmonicity to fragility are not clear, since it is not easy to control both independently. A recent study related the temperature dependence of the infinite frequency shear modulus, G ∝, to the steepness of the repulsive part of the interatomic potential. Reference Krausser, Samwer and Zaccone171 By examining a few BMGs near T g, the authors concluded that softer potentials give rise to stronger liquids. This is in disagreement with the conclusions reached in Sec. VI of this review, which were based on existing MD and colloidal suspension studies. In addition to the steepness of the repulsive potential, the expression for G ∝ also contains the thermal expansion coefficient, which depends on the fragility. Reference Gangopadhyay, Pueblo, Johnson, Dai, Aschcraft, Van Hoesen, Sellers and Kelton58 It may be that the disagreement arises because of a difficulty in disentangling these relative contributions to G ∝. Studies of the low-r side of the pair distribution in metallic alloy liquids would provide a more direct probe of the link between fragility and the steepness of the interatomic potential. We are in the process of making such studies. However, combining the influence of the repulsive potential and the anharmonicity with the link between cohesive energy (a measure of the depth of the potential) and fragility, Reference Gangopadhyay, Pueblo, Johnson, Dai, Aschcraft, Van Hoesen, Sellers and Kelton58 it appears clear that fragility is determined by the complete interatomic potential. How, remains a fundamental question. Clearly, more work will be required to fully uncover the microscopic origins of the macroscopic property of fragility.
ACKNOWLEDGMENTS
This work would not have been possible without the valuable contributions of many past and present students and collaborators. We gratefully acknowledge the painstaking work of the present students, Robert Ashcraft, Rongrong Dai, Daniel Van-Hoesen, and Mark Sellers. Among the past students, many significant contributions were made by Drs. Chris Pueblo, Mark Johnson, Matthew Blodgett, Adam Vogt, James Bendert, Nicolas Mauro, Victor Wessells, Tae-ho Kim, and Geun Woo Lee. The collaborative team of Drs. Nick Weingartner and Ryan Sokolaski and Professors Lee Yang, Zohar Nussinov, Minhua Suen and Takeshi Egami has made many important contributions in MD and theoretical studies that have improved our understanding. Drs. Doug Robinson, Jan Rogers, and Professor Robert Hyers have provided technical and logistical support for the ESL and synchrotron studies. The work was partially supported by NASA under Grants Nos. NNX10AU19G and NNX16AB52G and the NSF under Grant Nos. DMR 15-06553 and DMR 12-06707. Use of the Advanced Photon Source was supported by the US Department of Energy, Basic Energy Science, Office of Science, under Contract No. DE-AC02-06CH11357. Any opinions, findings, and conclusions or recommendations expressed in this material are those of the author(s) and do not necessarily reflect the views of the National Science Foundation or of NASA.