INTRODUCTION
As resistance of gastrointestinal (GI) nematodes to currently available anthelmintics continues to spread around the globe (Kaplan, Reference Kaplan2004; Gilleard, Reference Gilleard2006), the need to develop genetically resistant breeds of livestock, as an alternative measure for controlling infections among domestic animals, becomes even more acute (Kloosterman et al. Reference Kloosterman, Parmentier and Ploeger1992; Waller, Reference Waller2006; Stear et al. Reference Stear, Doligalska and Donskow-Schmelter2007). It is now well established that resistance, like other genetic traits, can be manipulated by selective breeding of animals to enhance their capacity to control infection (Albers and Gray, Reference Albers and Gray1987; Kloosterman et al. Reference Kloosterman, Parmentier and Ploeger1992; Bishop and Morris, Reference Bishop and Morris2007), but the lack of reliable genetic markers that are linked closely with genes for resistance, means that this is still a very imprecise art, requiring the evaluation of breeding stock by conventional methods based on tests of acquired worm burdens under experimental or field conditions, or failure to lose condition (production traits) under high worm challenge (Baker et al. Reference Baker, Nagda, Rodriguez-Zas, Southey, Audho, Aduda and Thorpe2003; Stear et al. Reference Stear, Doligalska and Donskow-Schmelter2007).
Although considerable progress has been made in livestock genetics, especially in breeding for resistance and resilience to infection with GI nematodes (Dominik, Reference Dominik2005), a complementary approach has exploited mouse models that facilitate much more rapid progress because of their relatively short generation times (Behnke et al. Reference Behnke, Iraqi, Menge, Baker, Gibson and Wakelin2003a). The parallel search for the genes that control GI nematode infections in mice, and the identification of the alleles that impart resistance, has made some progress in recent years, but even this has been disappointingly slow and, perhaps surprisingly, even today no specific genes have been clearly identified as the key players in mouse models of infection (Peters et al. Reference Peters, Robledo, Bult, Churchill, Paigen and Svenson2007; Behnke et al. Reference Behnke, Menge and Noyes2009).
Earlier, based on an F2 inter-crossed resource population of mice derived from resistant SWR and susceptible CBA strains, we identified 7 QTL located on 6 chromosomes for traits associated with resistance to worm infections (Iraqi et al. Reference Iraqi, Behnke, Menge, Lowe, Teale, Gibson, Baker and Wakelin2003). Subsequently, we described a range of additional QTL for the individual immunological traits associated with resistance (Menge et al. Reference Menge, Behnke, Lowe, Gibson, Iraqi, Baker and Wakelin2003). Our study clearly indicated that the situation was complex with many genes involved, alleles for resistance not only residing in mouse strains known to be strongly resistant to infection, but also in some cases in a susceptible strain where their full expression was presumably overshadowed by alleles facilitating poor responsiveness to infection and allowing the persistence of chronic infections (Iraqi et al. Reference Iraqi, Behnke, Menge, Lowe, Teale, Gibson, Baker and Wakelin2003).
In a subsequent publication, exploiting F6/7 inter-cross lines, we focused on chromosomes 1 and 17 where the most prominent QTL with the highest LOD scores for resistance traits were observed in the F2 study (Behnke et al. Reference Behnke, Lowe, Clifford and Wakelin2006a). We were able to confirm QTL on both chromosomes and refined the locus of the QTL on Mmu 17 in particular. The QTL on Mmu1 proved more difficult to refine further. It is known to reside in a relatively gene-poor region centred on a recombination ‘cold spot’, but nevertheless progress is being made to identify the key gene/s involved (Behnke et al. Reference Behnke, Menge and Noyes2009).
In this paper we report strong evidence for significant QTL identified on chromosomes 5, 8 and 11 by analysis of the F6/7 data. Additional support for the existence of these QTL is provided by re-analyses of data for the same chromosomes in the F2 study which shows clear indications of the existence of candidate QTL that were not statistically significant but had estimated effects in the same direction as those detected in the F6/7.
MATERIALS AND METHODS
Parasites and mice
This study is based on infections in mice with the trichostrongyloid intestinal nematode Heligmosomoides bakeri that, until recently, was known as H. polygyrus and H. polygyrus bakeri (but see Cable et al. (Reference Cable, Harris, Lewis and Behnke2006) and Behnke et al. (Reference Behnke, Menge and Noyes2009) ). In older literature this parasite has also been referred to as Nematospiroides dubius (Behnke et al. Reference Behnke, Keymer and Lewis1991).
This study is based on the F6/7 hybrids of CBA and SWR parental mice that differ genetically in their ability to deal with internal parasite infections. CBA are less resistant to intestinal nematode infections compared to SWR mice. When CBA mice are exposed to weekly infections with H. bakeri, worm burdens accumulate for 5–6 weeks. In contrast, in SWR mice, worm burdens are controlled from week 2 onwards and then decline, so that by week 6 virtually all mice are without adult worms, despite continued exposure to infective larvae each week. The traits recorded were faecal egg counts at weeks 2, 4 and 6 (FEC2, FEC4 and FEC6), worm counts in week 6, blood packed cell volume at week 2, 4 and 6 (PCV2, PCV4 and PCV6), the granulomatous response in week 6, specific IgG1 antibody response to adult worm antigens (IgG1 to Ad) in week 6, specific IgG1 antibody response to L4 larvae (IgG1 to L4) in week 6, specific IgE antibody response to L4 larvae (IgE to L4) in week 6 and the mast cell protease response in plasma samples (MCPT1) in week 3. Details of the methods used for infection, the methods of recording traits and the observed changes in worm burdens, faecal egg counts and associated immunological responses have all been thoroughly documented in earlier publications (Behnke et al. Reference Behnke, Lowe, Clifford and Wakelin2003b, Reference Behnke, Iraqi, Mugambi, Clifford, Nagda, Wakelin, Stephen, Kemp, Baker and Gibson2006a,Reference Behnke, Mugambi, Clifford, Iraqi, Baker, Gibson and Wakelinb).
Genetic methods
This study reports data on the QTL identified using an F2 resource population of 516 mice obtained from crosses of the susceptible CBA mouse strains with the highly resistant SWR mouse. A subsequent study was based on selective genotyping of a larger resource population of 1100 mice of an F6/F7 advanced inter-cross line developed through strategic breeding at the International Livestock Research Institute in Nairobi, Kenya. Both maximum likelihood and least squares analyses were carried out and chromosome-wide thresholds for significance of tests of the presence of a QTL were obtained by permutation testing. The results are presented in the figures as F ratios. The conventional LOD 2 threshold is equivalent to about a 4·76 F ratio, and this gives an approximate value for visual interpretation of the figures. Full details of study design, statistical methods and software employed for detection and evaluation of QTL were presented by Iraqi et al. (Reference Iraqi, Behnke, Menge, Lowe, Teale, Gibson, Baker and Wakelin2003), Menge et al. (Reference Menge, Behnke, Lowe, Gibson, Iraqi, Baker and Wakelin2003) and Behnke et al. (Reference Behnke, Iraqi, Mugambi, Clifford, Nagda, Wakelin, Stephen, Kemp, Baker and Gibson2006a).
Naming the QTL
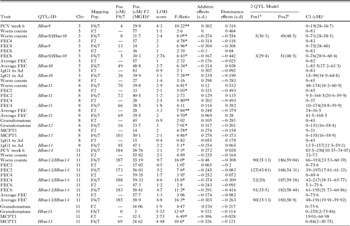
We adhered to the nomenclature policies of the International Committee for Standardized Genetic Nomenclature for Mice (http://www.informatics.jax.org/nomen/, Eppig Reference Eppig, Fox, Barthold, Davvison, Newcomer, Quimby and Smith2006). The 8 QTL discovered in previous studies were originally named Hpnr1 to Hpnr8 for H. polygyrus nematode resistance by Mouse Genome Informatics (MGI). Since the name of H. polygyrus has now changed to H. bakeri MGI has now changed these names to Hbnr. The 7 QTL described here were named Hbnr9 to Hbnr15 in numerical order as shown in Table 1, beginning with Mmu5, then Mmu 8 and Mmu11.
Comparison of location and effects of QTL for parasitological traits in the F2 and F6/7 resource populations for chromosomes 5, 8 and 11

a Interpolated back from the expanded F6/7 map position to the F2 mouse genome database (MGD) map positions.
* P<0·05; ** P<0·01; Pos. denotes Position.
PCV measurements were only recorded in the F6/7 study.
Note that the values for the granulomatous response and MCPT1 differ slightly from the published values because the analysis was conducted on a smaller subset of animals, after removal of all individuals with any missing data. Values for the F2 are taken from the MGI database where large panels were used to identify positions.
b Pos 1 and Pos 2 are the estimated positions of the two QTL when the model fitting 2 QTL was statistically significantly better than a model fitting 1 QTL for that chromosome. The position is on the F6/7 map and in parenthesis is given the position converted to the F2 map.
c CI is the confidence interval on the F6/7 map estimated by bootstrapping. In parentheses is the CI on the F2 map.
Differences between the F6/7 and F2 map positions arise because: (1) the starting position for the two maps differs. cM positions in the F6 are taken from map distances between the markers used and starting at 0 for the first marker. The 0 position may be at a position >20 Mb along the chromosome on the F2 map, and (2) the F6/7 map is much longer than the F2 due to the extra recombination events between the F2 and F6/7 generations.
Identification of haplotype differences
Boundaries of haplotypes (NCBI37) identified within the Perlegen SNP data set were downloaded from http://mouse.perlegen.com/mouse/download.html (Frazer et al. Reference Frazer, Eskin, Kang, Bogue, Hinds, Beilharz, Gupta, Montgomery, Morenzoni, Nilsen, Pethiyagoda, Stuve, Johnson, Daly, Wade and Cox2007). Mouse strains were allocated to haplotypes at each haplotype block using a local Perl script that extracted all alleles from the Perlegen dataset within a haplotype block, aligned them on the basis of genomic positions provided with the data and submitted them to the Jukes-Cantor algorithm in DNADIST in PHYLIP to calculate genetic distances between strains (Felsenstein, Reference Felsenstein2005). The distribution of distances was examined and a threshold of 0·01 was selected, such that strains within a genetic distance of 0·01 were considered to share the same haplotype. C57BL/6 was used as the reference strain (see Supplementary methods (Online version only) for a more detailed description of this method). Haplotype assignments for each haplotype block are shown in Supplementary data (Online version only): File_Haplotype_distances_and Candidate_Genes.xls. Gene positions were downloaded from Ensembl52. For all haplotypes for which CBA and SWR had different alleles, the genes within the haplotype were obtained and are shown in the Supplementary data (Online version only). Where there were no genes within the haplotype block the names of the nearest upstream and downstream genes were recorded in the list.
Results
Chromosome 5 – parasitological traits
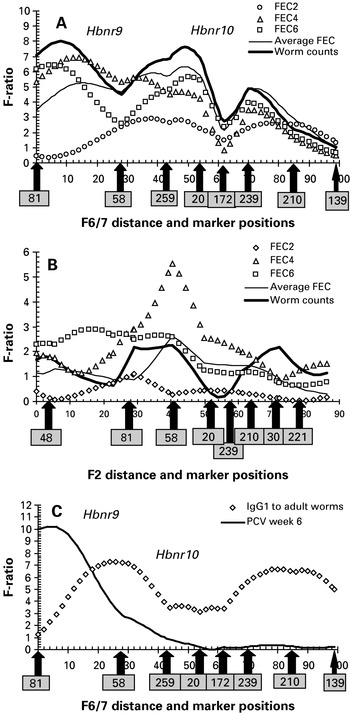
In the F2 study we found evidence for 1 QTL controlling a parasitological trait, FEC4. This was also significant in the F6/7 study and mapped within the confidence limits of the original QTL (57 cM, MGD). However, the F6/7 study also revealed QTL for FEC6, average FEC and worm counts in the same chromosomal region (Table 1, Hbnr9/Hbnr10, and Fig. 1). The additive effects of all these significant QTL for parasitological traits were negative, indicating that the alleles for resistance (lowering the mean value of the trait) came from SWR mice.
F-ratios for QTL for parasite (A and B) and immunological/pathological (C) traits on chromosome 5 as detected in the F6/7 (A and C) and F2 (B) resource populations. Markers used in both studies are given on the figures and the numbers correspond to D5Mit.

Chromosome 5 – immunological traits
No significant QTL for immunological traits were detected in the F2 study on Mmu5, but two significant QTL were found in the F6/7 study, one for the IgG1 antibody response to adult worm antigens, mapping within the confidence limits of the QTL for the parasitological traits (Hbnr10), and another for PCV6 located more proximal but still within the confidence limits of the parasitological traits (Table 1, Hbnr9 and Fig. 1C). The additive effects for both of these QTL were positive indicating that the alleles from SWR raised the value of the trait, consistent with a resistance allele.
Chromosome 8 – parasitological traits
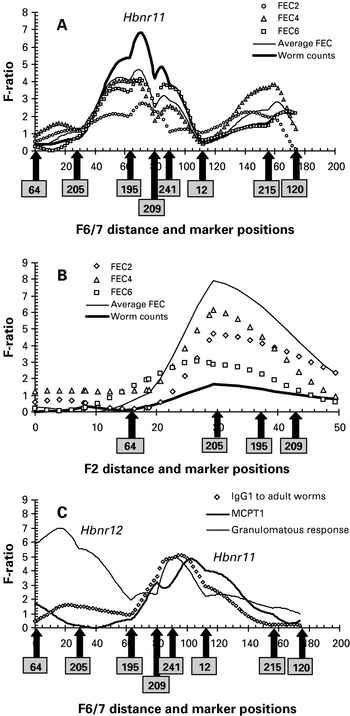
The F2 study revealed 3 significant QTL for parasitological traits, i.e. FEC2 and FEC4 and average FEC (Table 1 and Fig. 2B). Only the QTL for average FEC was confirmed in the F6/7 study, although as can be seen from Fig. 2A, there was a strong indication that all parasitological traits were affected by the same chromosomal region (Hbnr11). Perhaps surprisingly, the additive effects are mostly positive suggesting that SWR alleles in this case impair resistance.
F-ratios for QTL for parasite (A and B) and immunological traits (C) on chromosome 8 as detected in the F6/7 (A and C) and F2 (B) resource populations. Markers used in both studies are given on the figures and the numbers correspond to D8Mit. Note that a marker at 61 cM (D8mit 120) is not illustrated in (B).

Chromosome 8 – immunological traits
The 2 QTL for immunological traits map also within the confidence limits of the QTL for parasitological traits, and both have positive additive effects. That for MCPT1 (Hbnr11) has an almost identical value in both studies but mapped more distally in the F6/7 compared with the F2 study. More proximally we found a QTL for the granulomatous response (Hbnr12) and for this the additive effects were positive as we would expect, since the alleles for a strong granulomatous response are derived from SWR mice.
Chromosome 11 – parasitological traits
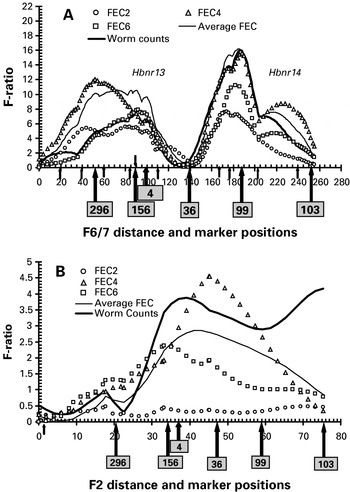
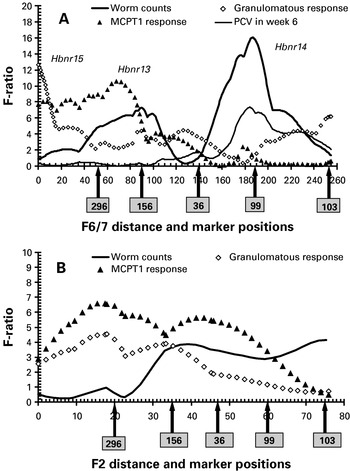
In the F2 study none of the parasitological traits quite reached statistical significance, but as can be seen from Fig. 3B, FEC4 and worm counts were only just below the threshold for significance (4·76). The location of the QTL (Fig. 3B) in the F2 study was proximal to marker D11Mit36, whereas in the F6/7 study the second major peak detected (Hbnr14) was distal to this marker, but the confidence limits for this QTL still encompassed marker D11Mit36, suggesting that these are probably the same QTL (Fig. 3A, Hbnr14; Table 1).
F-ratios for QTL for parasite traits on chromosome 11 as detected in the F6/7 (A) and F2 (B) resource populations. Markers used in both studies are given on the figures and the numbers correspond to D11Mit. The small arrows show locations of additional markers used either for the F2 or the F6/7 resource populations. For the F2, the marker was D11Mit71, at 1·1 cM on the Jackson web site F2 map. For the F6/7 these D11Mit markers (and F6/7 map position) were 227 (0 cM); 152 (15·8 cM); 231(35·5 cM); 236 (56·2 cM); 260 (82·5 cM); 242 (86·7 cM); 320 (108 cM); 70 (167·1 cM); 160 (178·7 cM); 10 (204·1 cM); 167 (241·4 cM).

The estimates of the additive effects for Hbnr13/Hbnr14 in the F6/7 population were all negative, indicating that the alleles from SWR mice lowered the value of all the traits (i.e. caused worm burden, and faecal egg counts to be lower), which is consistent with SWR mice carrying resistant alleles and CBA mice susceptibility alleles for these traits.
Chromosome 11 – immunological and pathological traits
Neither the F2 not the F6/7 study revealed any indication of QTL on Mmu11 for any of the antibody responses that we had assessed.
However, we did report a QTL for the granulomatous response on this chromosome in the F2 study (Menge et al. Reference Menge, Behnke, Lowe, Gibson, Iraqi, Baker and Wakelin2003) at about 35 cM with a LOD score of 2·1 just above the threshold for significance. On re-analysis of the F2 data, but this time excluding some of the animals with missing data, the LOD score proved to be slightly lower at 1·9 (Table 1), just below significance. The F6/7 study confirmed a QTL for the granulomatous score with an increased LOD score of 5·32 (Hbnr15). This QTL mapped more proximally, but well within the confidence interval of the F2 QTL. The additive effects were of similar magnitude in both F2 and F6/7 studies (Table 1) and positive indicating that the allele from SWR mice increased the value of the trait, which is consistent with the known, more intense response of SWR mice on repeated exposure to H. bakeri (Behnke et al. Reference Behnke, Iraqi, Mugambi, Clifford, Nagda, Wakelin, Stephen, Kemp, Baker and Gibson2006a).
In our earlier study we also reported a QTL for the mast cell protease 1 (MCPT1, formerly MMCP1) on Mmu11 with a LOD score of 2·68. After re-analysis, but excluding animals with missing data, the LOD score was 2·75 (Table 1), still above the cut-off for significance. This was increased in the F6/7 resource population to a value of 4·48, and the location was similar (Hbnr13). In the F2 study a broad peak was observed (Fig. 4B), but in the F6/7 study only the first part of this peak was confirmed mapping to a region corresponding to the common marker used in both studies (D11Mit296). The additive effect was almost identical in both studies (Table 1). However, the direction of the additive effect is curious, since SWR mice generally produce a more intense MCPT1 response to H. bakeri but here the sign (negative) indicates that SWR alleles lowered the value of the trait. This contrasts with our findings for this trait on Mmu17 where the SWR allele had a positive effect (Behnke et al. Reference Behnke, Iraqi, Mugambi, Clifford, Nagda, Wakelin, Stephen, Kemp, Baker and Gibson2006a).
F-ratios for QTL for immunological traits on chromosome 11 as detected in the F6/7 (A) and F2 (B) resource populations. Markers used in both studies are given on the figures and the numbers correspond to D11Mit. The QTL for worm count is also given for reference in each figure. Markers specific to either study are not shown but are given in Fig. 3. Those shown are common to both studies except D11Mit 4, which was omitted for clarity because it maps very closely to D11Mit 156.

PCV was not measured in the F2 study, but in the F6/7 study a significant QTL was observed on Mmu11 for PCV in week 6 (PCV6) mapping to 184 cM on the F6/7 map (Fig. 4A), close to marker D11Mit 99 (Table 1) and close to the consensus position of the second peak associated with worm burdens at 186 cM (Hbnr14). The additive effect was positive, indicating that the alleles from SWR mice increased PCV at week 6. This is consistent with week 6 worm burdens being lower in resistant mice and hence pathology, reflected in a fall in the PCV, being less marked.
Genes on different haplotypes in CBA and SWR
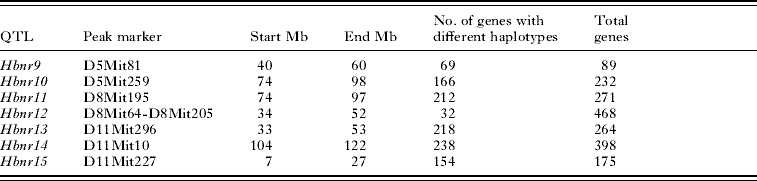
A list of genes for which the haplotype was different was compiled (Supplementary data in Online version only). Since genes may be regulated by distant polymorphisms the list was compiled by iterating through the list of haplotypes where SWR and CBA carried different alleles. If a gene overlapped that haplotype either completely or in part then that gene was recorded in the list. If no genes overlapped the haplotype then the genes that were immediately upstream and downstream of that haplotype were recorded in the list and the orientation of the gene relative to the haplotype was recorded (Supplementary data Haplotype_distances_and Candidate_Genes.xls, Online version only). Genes may occur multiple times in the list because they may be the closest to several haplotypes. In the list the genes that fall within approximately 10 Mb either side of the peak marker are shown in bold and the number of genes that have haplotypes that differ between strains is shown in Table 2.
Genes with haplotypes that differed between strains
(The table shows counts of genes in each QTL that have haplotypes that differ between strains either over the gene or upstream or downstream of them. The number of candidate genes can be immediately reduced by 12–93% by focussing on genes that are associated with haplotype differences.)

DISCUSSION
The results reported in this paper, extend those of Behnke et al. (Reference Behnke, Iraqi, Mugambi, Clifford, Nagda, Wakelin, Stephen, Kemp, Baker and Gibson2006a) who concentrated on the highly significant QTL with a big impact on resistance to H. bakeri on Mmu1 and Mmu17. In that study the QTL on Mmu17 maps to the region containing the major histocompatibility complex genes of the mouse. Earlier studies with H. bakeri have strongly implicated MHC genes as playing a vital role in host resistance to this species (Enriquez et al. Reference Enriquez, Brooks, Cypess, David and Wassom1988; Behnke and Wahid, Reference Behnke and Wahid1991), so discovery of this QTL was not at all surprising but rather reassuringly supportive of the earlier studies. Nevertheless, until the underlying genes are convincingly identified, there is still the possibility that the genes responsible may lie in loci adjacent to but outside the MHC, as was suggested in the case of T. congolense infection in mice (Iraqi et al. Reference Iraqi, Clapcott, Kumar, Haley, Kemp and Teale2000). The QTL gene(s) on chromosome 1 are as yet unknown, although possible candidates were identified and have been discussed previously by Behnke et al. (Reference Behnke, Iraqi, Mugambi, Clifford, Nagda, Wakelin, Stephen, Kemp, Baker and Gibson2006a). Interestingly, a QTL for resistance to the nematode parasite Trichinella spiralis has been reported on rat chromosome 9, which is homologous with mouse chromosome 1, and mapped to syntenic loci on this chromosome (Suzuki et al. Reference Suzuki, Ishih, Kino, Muregi, Takabayashi, Nishikawa, Takagi and Terada2006).
The number of significant QTL observed in the present study is many fold higher than expected by random chance. The expected number of false positives, given that 12 traits were analysed on 7 chromosomes, is 4·2 at P<0·05 and 0·8 at P<0·01. Chromosomes 1 and 17 were excluded from these calculations because they were analysed separately as part of an initial follow up of the 2 largest QTL observed in the F2 study. The number of significant QTL observed across the 7 chromosomes (results on chromosomes 2, 13, 18 and 19 are not reported here, but are available from the authors) were 30 at P<0·05 and 7 at P<0·01, giving strong assurance that few of the observed results are likely to be false positives. Moreover, the directions of QTL effects observed in the F6/7 population are the same as those observed in the F2 population, which is extremely unlikely to have occurred by random chance. The widespread problem of false negatives (failure to detect real QTL) in standard QTL designs is demonstrated here by the lack of significance of QTL in the F2 which show up clearly in the more powerful F6/7 population.
The current results add to our earlier work, showing that there are additional chromosomal regions in the mouse that also play a role in controlling worm burdens and the associated immune responses, and emphasize the complexity of the host response to infection. In contrast to earlier ideas that hinged on the presence of one or a limited set of so-called ‘immune response genes’, it is now readily apparent that we are dealing with gene complexes. These gene complexes are subject to various hierarchical relationships with the other genes involved in gene pathways that lead to complex physiological responses. The important loci, although not yet identified are clearly scattered over many chromosomes, and breeding for resistance is going to require a range of markers specific to various chromosomal regions containing the genes affecting resistance. The priority therefore, will be to identify the loci that most affect resistance and to assess the contribution of the resistance alleles to overall host-protective immunity in animals with other genetic backgrounds, especially on those associated with poor resistance to the parasite.
In our earlier report on the F6/7 study, we noted that whilst QTL for worm burdens and faecal egg counts coincided with those for several of the immunological traits on chromosome 17, suggesting that a common mechanism was involved (in this case recognition of antigens and the elicitation of relevant responses); surprisingly, and disappointingly, the strong QTL on Mmu1 was not associated with any of the immunological traits that we quantified (Behnke et al. Reference Behnke, Iraqi, Mugambi, Clifford, Nagda, Wakelin, Stephen, Kemp, Baker and Gibson2006a). We interpreted this to indicate that whilst differing markedly between the founder strains (SWR and CBA) and conceivably playing a role in protective immunity (Behnke et al. Reference Behnke, Iraqi, Menge, Baker, Gibson and Wakelin2003a), the immunological traits that were quantified were not controlled by the genes underlying the QTL on Mmu1 (Behnke et al. Reference Behnke, Menge and Noyes2009). Here, however, we have evidence of genetic loci for parasite resistance that coincide with those for accompanying immunological traits. For example on Mmu5, the QTL (Hbnr10) for the IgG1 response to adult worms is close to that for worm counts. On Mmu8 the QTL for the IgG1 response to adult worms and for the MCPT1 response, are both close to those for parasite resistance (Hbnr11), and well within the confidence limits of the estimates for the loci of these QTL, and these are likely to be a single QTL with pleiotropic effects. If this does turn out to be a pleiotropic QTL, it suggests a functional link between these IgG1 antibody responses and the mucosal mast cell response (as reflected in the serum concentration of MCPT1) and host-protective, anti-worm immunity. Both have been suggested in the past to be essential elements of anti-adult worm immunity in mice (Pritchard et al. Reference Pritchard, Williams, Behnke and Lee1983; Wahid and Behnke, Reference Wahid and Behnke1993; Behnke et al. Reference Behnke, Iraqi, Mugambi, Clifford, Nagda, Wakelin, Stephen, Kemp, Baker and Gibson2003b; McCoy et al. Reference McCoy, Stoel, Stettler, Merky, Fink, Senn, Schaer, Massacand, Odermatt, Oettgen, Zinkernagel, Bos, Hengartner, MacPherson and Harris2008). The priority now is to assess their relative importance and to define the hierarchical relationship between the genes on the chromosomes that clearly influence resistance to worms and the accompanying immunological responses. This will help to elucidate the immunological pathway that is the primary driver of the effectors ultimately responsible for worm expulsion. At this stage it is not clear which are the accompanying ‘epi-phenomena’ and which are the essential components of protective immunity.
Although the genes on chromosomes 5, 8 and 11 cannot be identified with any degree of certainty through the current work, the haplotype analysis reduced the number of likely candidate genes by a mean of 33% (Table 2). Table 2 shows the numbers of genes associated with different haplotypes at each QTL. These genes are perhaps the most likely candidates and some have plausible roles in the response to the infection. For example several of the interleukin genes (Il3, Il4, Il5, Il12, Il13) are located around Hbnr13 on Mmu11. Il12 (44·2 Mb) is within 1·5 Mb of the peak marker D11Mit296 (42·7 Mb) whilst the rest of the cytokine cluster is 11 Mb more distal at around 53·5 Mb, so Il12 is perhaps the most interesting positional candidate at this locus. The peak marker for the Hbnr14 QTL on distal Mmu11 is D11Mit10 (114 Mb) and C1qbp at 102·8 Mb is one candidate gene on this locus. The peak marker for Hbnr12 on proximal Mmu8 is between D8Mit64 and D8Mit205 where the two strains have different haplotypes for glutathione reductase. A QTL for susceptibility to cytokine deficiency colitis lies close by at 28 cM (Mähler et al. Reference Mähler, Most, Schmidtke, Sundberg, Li, Hedrich and Churchill2002). Il15 at 84·8 Mb, is close to the peak of the more distal Hbnr11 (peak marker D8Mit195, 85·1 Mb). The Hbnr9 peak marker D5Mit81 is at 50·7 Mb close to the superoxide dismutase 3 gene at 52·7 Mb. It is interesting that genes regulating oxidant stress are under two different QTL. Oxygen-scavenging molecules have been shown to be differentially expressed by H. bakeri during immune responses (Ben-Smith et al. Reference Ben-Smith, Lammas and Behnke2002), and another strong responder mouse strain, SJL, generates high intestinal lumen concentrations of reactive mucosal nitric oxide during expulsion of the adult worms (Ben-Smith et al. Reference Ben-Smith, Lammas and Behnke2003). Cape buffalo have been shown to control Trypanosoma congolense expression by down regulating catalase and hence increasing oxidative stress by raising H2O2 levels (Wang et al. Reference Wang, Van Praagh, Hamilton, Wang, Zou, Muranjan, Murphy and Black2002).
We have now identified chromosomal regions in the mouse where major QTL controlling resistance are located (chromosomes 1 and 17) and additional QTL which probably at best play a moderating role. The ultimate assessment of the exact contribution of these QTL will depend on transferring each QTL by marker-assisted introgression. The approach has already been pioneered by Koudandé et al. (Reference Koudandé, van Arendonk and Iraqi2005) who used marker-assisted backcross breeding strategies to transfer 3 distinct QTL for resistance to trypanosomiasis, each residing on a different chromosome, from the resistant (C57BL/6) mouse strain to the susceptible (A/J) strain, independently of one another as well as in combination with the others. These authors were then able to assess the contribution of each QTL to overall resistance on a susceptible mouse background. Thus it would be fascinating to study mice of a CBA background but differing only in the QTL regions by possession of SWR alleles at these loci. Single QTL transfer, and combinations, will allow the hierarchical relationship between accompanying immunological traits and anti-worm protective immunity to be elucidated. This approach, in combination with gene arrays, and exploration of single nucleotide polymorphisms in the QTL regions should help to pinpoint the exact nature of the genetic control of resistance to H. bakeri in the mouse (Fisher et al. Reference Fisher, Hedeler, Wolstencroft, Hulme, Noyes, Kemp, Stevens and Brass2007; Frazer et al. Reference Frazer, Eskin, Kang, Bogue, Hinds, Beilharz, Gupta, Montgomery, Morenzoni, Nilsen, Pethiyagoda, Stuve, Johnson, Daly, Wade and Cox2007). This topic has fascinated parasitologists since the pioneering work of Spurlock (Reference Spurlock1943) first drew attention to the contrasting resistance of different laboratory mouse strains to this intriguing parasite (Liu, Reference Liu1966). Since nematodes in the family Heligmosomatidae are closely related to other trichostrongyles, it is likely that at least some of the genes identified in the murine models will have relevance for resistance to GI nematodes in livestock. Comparative maps and their associated software are currently advancing rapidly, as are other tools for dissecting the genome (Hunter and Crawford, Reference Hunter and Crawford2008). Hence, locating syntenic loci and murine homologues in bovine, ovine genomes and even in the human genome will become increasingly feasible in the foreseeable future.
ACKNOWLEDGEMENTS
We acknowledge the technical inputs in the helminthology laboratory of Sam Njomo, Fredrick Moseti and Sarah Kanyingi, mouse husbandry by Jane Ikanyi, John Kiragu and Pauline Mbuthia under the supervision of Bob King, and John Wambugu, Moses Ogugo, Daniel Mwangi and Nemuel Nyamweya for the genotyping in the molecular genetics laboratory. This research was funded by a grant from the Wellcome Trust (063810) and by member donors of the CGIAR, and by programme-restricted grants to ILRI from the EU and Department for International Development (DfID), UK. Helpful advice was generously provided by Professor Jan Bradley.