INTRODUCTION
The need for increased food production resulting from human population growth combined with scarcity of resources requires, more than ever, the optimization of plant nutrient use efficiency together with a reduction in the environmental consequences of fertilization. During the past five decades, the use of fertilizers containing nitrogen (N), which represents one of the main limiting factors of plant growth, has increased c. 20-fold on a worldwide scale, with an actual rate of 1011 kg/year (Glass Reference Glass2003). In cereals, the average N use efficiency (NUE) under field conditions is c. 33%; the remaining N can be partly used by the following rotation but may also have adverse environmental consequences such as increased concentrations of nitrous oxide (N2O) in the atmosphere and contamination of water by nitrates (NO3−). Therefore, to avoid negative impacts on the environment without any limitation of yield or negative impact on the quality of harvested plant products, improvement of NUE is becoming a priority for many crops. Moreover, it is estimated that a 1% increase in NUE could save $1.1 billion annually (Kant et al. Reference Kant, Bi and Rothstein2011). Nitrogen use efficiency can be affected by numerous biological and physical processes, among which the availability of macro- and micronutrients can be crucial. Among the six macronutrients, potassium and phosphorus are usually provided with N fertilizers, but this is not always the case for sulphur (S), while soil deposition from S atmospheric pollution (McGrath et al. Reference Mcgrath, Zhao and Lombi2002) has been reduced by more than 85% in the last three decades. Combined with the increased removal of S by high yielding cultivars, higher cropping intensity and sub-optimal S fertilization regimes, it appears that soil S deficiency has become a widespread problem over recent years (Ahmad et al. Reference Ahmad, Jan, Arif, Jan and Khattak2007; Malhi et al. Reference Malhi, Gan and Raney2007).
Because S is a macronutrient, its deficiency provokes multiple plant dysfunctions that lead to losses of yield and/or quality of harvested products but also to consequences such as trace element accumulation and heavy metal stress responses (Na & Salt Reference Na and Salt2011), and increased disease susceptibility (Dubuis et al. Reference Dubuis, Marazzi, Staedler and Mauch2005). Impairment of yield and N nutrition by S deficiency has been shown in many species such as Triticum aestivum L. (Zhao et al. Reference Zhao, Hawkesford and Mcgrath1999), Zea mays L. (Pagani & Echeverria Reference Pagani and Echeverria2011), Trifolium repens L. (Tallec et al. Reference Tallec, Diquelou, Lemauviel, Cliquet, Lesuffleur and Ourry2008a) and Lolium perenne L. (Tallec et al. Reference Tallec, Diquelou, Fauveau, Bataille and Ourry2008b). Moreover, similar growth restriction by low S availability has been shown for high S demanding species, for instance members of the cruciferae such as Brassica napus L. (oilseed rape) grown under field conditions (Nuttall et al. Reference Nuttall, Ukrainetz, Stewart and Spurr1987; Withers & O'Donnell Reference Withers and O'donnell1994; Malhi & Gill Reference Malhi and Gill2002; Grant et al. Reference Grant, Clayton and Johnston2003; Malhi et al. 2005, 2007; Ahmad et al. Reference Ahmad, Jan, Arif, Jan and Khattak2007) and controlled environment conditions (Koprivova et al. Reference Koprivova, Suter, Op Den Camp, Brunold and Kopriva2000; Dubousset et al. Reference Dubousset, Abdallah, Desfeux, Etienne, Meuriot, Hawkesford, Gombert, Segura, Bataille, Reze, Bonnefoy, Ameline, Ourry, Le Dily and Avice2009; Abdallah et al. Reference Abdallah, Dubousset, Meuriot, Etienne, Avice and Ourry2010, Reference Abdallah, Etienne, Ourry and Meuriot2011; Kaur et al. Reference Kaur, Chandna, Pandey, Abrol, Iqbal and Ahmad2011). In oilseed rape, whose yield increases worldwide by about 3·4% per year (Rondanini et al. Reference Rondanini, Gomez, Agosti and Miralles2012), it has been shown that lower S fertilization not only decreased seed yield, but also had negative impacts on seed quality through a decline in oil and protein concentrations as well as fatty acid composition (Zhao et al. Reference Zhao, Bilsborrow, Evans and Mcgrath1997, Reference Zhao, Mcgrath, Blake-Kalff, Link and Tucker2002; Mahli et al. 2005; Ahmad et al. Reference Ahmad, Jan, Arif, Jan and Khattak2007; Jankowski et al. Reference Jankowski, Budzyński and Szymanowski2008; Dubousset et al. Reference Dubousset, Etienne and Avice2010).
Mineral S availability also closely interacts with N management for the crop (Kopriva & Rennenberg Reference Kopriva and Rennenberg2004). Previous studies have reported that the full potential of N fertilizer (NUE) could not be achieved under S-deficient conditions (Schnug et al. Reference Schnug, Haneklaus and Murphy1993; Fismes et al. Reference Fismes, Vong, Guckert and Frossard2000; Dubousset et al. Reference Dubousset, Etienne and Avice2010). Indeed, it has been shown that S deficiency reduced NO3− uptake and assimilation in several species, such as tobacco, spinach (Migge et al. Reference Migge, Bork, Hell and Becker2000; Prosser et al. Reference Prosser, Purves, Saker and Clarkson2001), B. napus L. (Abdallah et al. Reference Abdallah, Etienne, Ourry and Meuriot2011) and Brassica rapa L. (Kaur et al. Reference Kaur, Chandna, Pandey, Abrol, Iqbal and Ahmad2011). While plant sulphate (SO42−) concentration declined, NO3− accumulated, suggesting that NO3− assimilation was more strongly affected than its uptake (Abdallah et al. Reference Abdallah, Etienne, Ourry and Meuriot2011; Kaur et al. Reference Kaur, Chandna, Pandey, Abrol, Iqbal and Ahmad2011). Other types of regulation occurring during S starvation include an up-regulation of genes encoding either plasmalemic or tonoplastic SO42− transporters (Hawkesford & Wray Reference Hawkesford and Wray2000; Davidian & Kopriva Reference Davidian and Kopriva2010; Takahashi et al. Reference Takahashi, Kopriva, Giordano, Saito and Hell2011). Although S starvation strongly affects oilseed rape growth, recent results have shown that leaf SO42− can be accumulated in large amounts earlier in growth under hydroponic conditions and then efficiently mobilized from vacuoles, thanks to the overexpression of tonoplastic SO42− transporters (SULTR of group 4), resulting in growth being sustained for several weeks (Dubousset et al. Reference Dubousset, Abdallah, Desfeux, Etienne, Meuriot, Hawkesford, Gombert, Segura, Bataille, Reze, Bonnefoy, Ameline, Ourry, Le Dily and Avice2009; Abdallah et al. Reference Abdallah, Dubousset, Meuriot, Etienne, Avice and Ourry2010, Reference Abdallah, Etienne, Ourry and Meuriot2011). With an ample supply of nutrients under hydroponics, S from SO42− (SO42−–S) can be accumulated in fairly high amounts in leaves (up to 10 mg/g dry weight (DW)), but the range of variation resulting from soil availability and mineral and/or organic supplies remains largely unknown in plants grown in field conditions. In controlled conditions, leaf S concentration can be highly variable depending on SO42− accumulation, which may account for up to 90% of total S concentration (Abdallah et al. Reference Abdallah, Etienne, Ourry and Meuriot2011). When exposed to S deficiency, all leaf SO42− can be remobilized, leading to an S concentration as low as 2 mg/g DW (i.e. without significant accumulation of SO42−). However, when S is not limiting, senescent leaves can retain SO42− to a very high level (i.e. no mobilization during senescence under optimal nutrition), suggesting that S or SO42− concentration in old leaves, whether at the vegetative (Abdallah et al. Reference Abdallah, Etienne, Ourry and Meuriot2011) or reproductive stages (Dubousset et al. Reference Dubousset, Etienne and Avice2010), could be used as an indicator of S metabolism. In other words, these previous studies have shown that leaf S and more particularly SO42− can be mobilized during senescence, but only in the case of S limitation and according to its intensity. As a consequence, the S and SO42− that remains in older leaves could reveal whether or not plants have been exposed to S deficiency during their lifespan as well as the intensity of this deficiency. Therefore, older leaves harvested at the vegetative stage or during seed filling will reflect the nutritional history of the plant better than young expanding leaves, where S or SO42− concentrations are more linked to their development and immediate S availability. In contrast, leaf N is always mobilized during senescence and mostly by proteolysis, with an up-regulation during N starvation (Desclos et al. Reference Desclos, Etienne, Coquet, Jouenne, Bonnefoy, Segura, Reze, Ourry and Avice2009).
The review by Malhi et al. (Reference Malhi, Solberg and Nyborg2005) describes several field experiments that aimed to optimize S fertilization of oilseed rape, comparing different sources of S, conditioning of fertilizer, timing of application and placement. Sulphate fertilizers are considered more efficient in the short term than elemental S, which requires soil microbial oxidation before its uptake, although SO42− application is less effective in autumn than in spring. An average dose of 15–30 kg S/ha is recommended for most deficient soils in the prairie provinces of Canada, whereas the French national institute, Centre Technique Interprofessionnel des Oléagineux Métropolitains (CETIOM) recommends doses of c. 30 kg S/ha in fields of oilseed rape, although excessive S supply has been reported to lead to a decline in seed oil concentration (Nuttall et al. Reference Nuttall, Ukrainetz, Stewart and Spurr1987). In the meantime, some studies have revealed that S fertilization may have no effect on oilseed rape yield (Asare & Scarisbrick Reference Asare and Scarisbrick1995; Jackson Reference Jackson2000), which could be the consequence of ample soil S availability that was not evaluated a priori by the use of a relevant indicator or diagnostic tool. For instance, soil soluble S or S from SO42− (SO42−–S) was proposed as an indicator (Zhao & McGrath Reference Zhao and Mcgrath1994) but was not considered as sufficiently reliable (Malhi et al. Reference Malhi, Solberg and Nyborg2005) because it showed inherent spatial and temporal variability resulting from biological (mineralization, immobilization) and physical (i.e. leaching) processes. In maize, Pagani & Echeverria (Reference Pagani and Echeverria2011) showed that soil indicators (especially SO42− availability) did not perform well as predictors of S responses and proposed a new S sufficiency index based on chlorophyll meter readings of the middle and the upper leaf layer. In grasslands, Mathot et al. (Reference Mathot, Thélier-Huché and Lambert2009) used N and S concentration relationships in leaves to predict the risk of S deficiency. Additional plant analyses have been tested to predict S deficiency in oilseed rape and therefore the S requirement at a given stage, such as total S, SO42−, organic S, N/S or malate/SO42− ratios (reviewed among others by Blake-Kalff et al. Reference Blake-Kalff, Hawkesford, Zhao and Mcgrath2000). More recently, Howarth et al. (Reference Howarth, Parmar, Barraclough and Hawkesford2009) identified a wheat gene (sdi1) that is specifically induced by SO42− deficiency and suggested that it has potential as a sensitive indicator of S nutritional status. Overall, this suggests that there is a lack of predictive tools to evaluate plant S requirements, as no soil or plant testing methods are easily available and usable under field conditions.
Therefore, on the basis of a study of a wide range of agricultural conditions, the aims of the present work were: (i) to test simple plant characteristics such as S or SO42− concentrations in senescing leaves or stems that may be used to predict S deficiency; (ii) check whether S and SO42− plant concentrations are related and determine their range of variation; and (iii) to evaluate the risk of excessive or reduced S fertilization of oilseed rape using cultivation and plant (stems, senescing leaves and seeds) analysis.
MATERIALS AND METHODS
Choice of commercial crops
The present study was conducted in Calvados, Normandy, France (01°09′W–00°26′E, 49°24′–48°44′N, 30–277 m a.s.l., with a mean of 130 m a.s.l.). Using a scoring model for the analysis of four oilseed rape growing seasons, Pellet et al. (Reference Pellet, Mercier, Balestra, Lavanchy, Pfeifer, Keiser and Bezencon2003) showed that 85% of yield variability in response to S fertilization was explained by pedologic and climatic criteria including soil characteristics and rainfall. Therefore, in order to maximize variability for S status, 57 commercial crops were chosen (Fig. 1) in contrasting soil conditions (from thin to deep acid soils, i.e. umbric leptosol and luvic cambisol and from thin to deep calcaric soil, i.e. epileptic cambisol and calcaric cambisol, Fig. 1a) along a gradient of annual rainfall (700, 850 and 1000 mm/year on a 10-year average; Fig. 1b), which overall may affect SO42− leaching and hence SO42− availability. Thirty farmers, identified with the help of local agricultural organizations, collaborated in the present study.
Maps of (a) soils and (b) the 10-year average rainfall in the Calvados area. Oilseed rape commercial crop positions that were studied are indicated and identified by numbers.

Cultivation analysis, acquisition and processing of data
Before harvest (spring 2009), farmers were contacted through a survey in order to obtain the following information for each field: localization and area (ha) of studied fields, sowing date, seeding rate (kg/ha), oilseed rape genotype, pesticides used and rates, rate (kg/ha) and composition of mineral fertilizers, and rate (kg/ha) and type of organic fertilization, previous crop and finally previous crop fertilization practices. Farmers were contacted again in August 2009 in order to obtain the seed yield (t/ha). For organic fertilization, the dose of N and S (kg/ha) provided to each commercial crop was calculated from data available elsewhere (Bodet et al. Reference Bodet, Hacala, Aubert and Texier2001; Farre & Molin Reference Farre and Molin2002). For example, cattle and poultry manures were assumed to contain 52·7 and 22·4 mg N/g fresh weight (FW) and between 0·7 and 2·2 mg S/g FW, respectively. Similarly, cattle and pig liquid manures were assumed to contain 3·85 and 9·6 mg N/g FW, and 0·44 and between 3·2 and 4·8 mg S/g FW, respectively.
Plant and soil sampling
Fifty senescent leaves (i.e. yellowing, just before their abscission) were randomly collected in May 2009, after flowering, and ten stems in June 2009 (seed filling stage) from each of the 57 fields. At harvest time (August 2009), seed samples (c. 100 g) were collected from each farmer. Ten soil samples were randomly collected in July 2009 from each of the 57 fields with an auger to a depth of 300 mm. Plant and soil samples were stored at 4 °C before laboratory processing.
Samples of stems, leaves and seeds were dried at 60 °C for 72 h and then ground using a PM 100 grinder (Planetary Ball Mill PM 100, Retsch, Düsseldorf, Germany) for leaves and stems, and an MM 400 grinder (Mixer Mill MM 400, Retsch, Düsseldorf, Germany) for seeds. Soil samples were dried at 105 °C for 72 h, and then passed through a 2 mm sieve to remove stones and roots and finally ground with a kitchen grinder.
Nitrogen and S analyses
Nitrate and SO42− were extracted from 50 mg of dry plant material and initially mixed with 2 ml of 50% ethanol. After incubation at 40 °C for 1 h, the extract was centrifuged at 10 000 g for 20 min and the supernatant was collected. This step was repeated on the pellet and the supernatant obtained was pooled with the previous one. The pellet was then re-extracted by two successive incubations with 2 ml of ultrapure water at 95 °C for 1 h. The extract was centrifuged at 10 000 g for 20 min. All the supernatants were pooled and evaporated under vacuum (Concentrator Evaporator RC 10.22, Jouan, Saint-Herblain, France). The dry residue was re-suspended in 2 ml of ultrapure water before further analysis. Nitrate and SO42− from the soil were extracted from 10 g of dry matter (DM) with 25 ml of calcium phosphate solution (Ca(PO4H2)2) at 0·008 mol/l. Samples were then agitated for 1 h with a rotator agitator (Reax 20, Heidolph, Schwabach, Germany) and filtered using a Whatman filter (nylon, 0·45 μm). The NO3− and SO42− concentrations from soil and plant samples were analysed by high-performance liquid chromatography (HPLC, DX100, Dionex Corp., Sunnyvale, CA, USA). For total N and S analyses, ground plant material was weighed and placed into tin capsules. Both total S and N concentrations in the plant samples were determined with a continuous flow isotope ratio mass spectrometer (IRMS Isoprime, GV Instruments, Manchester, UK) linked to an elemental analyser (EA3000, EuroVector, Milan, Italy).
Determination of seed composition by near-infrared spectrometry
Oil, proteins and total glucosinolate (GLS) concentrations in seeds were determined with a near-infrared spectrometry (NIRS). All the samples were scanned on a monochromator NIRS in the reflectance mode, model 6500 (FOSS NIR System Inc, Silver Spring, MD, USA), equipped with a transport module. Intact seeds (c. 5 g) were placed in a standard ring cup and scanned. The results were predicted from an external calibration established for oil, protein and total GLS concentration (CRA-W, Gembloux, Belgium). Three replicate determinations were performed for each sample. The results are presented as percentage of seed DM for oil and protein content and as μmol of GLS per g of DM.
Lipid analysis
The method for determination of seed oil composition was based on direct methylation of fatty acids. Mature dried seeds were ground in a microtube using a TissueLyser grinder (Qiagen, Courtaboeuf, France). Three replicates of 10 mg each were weighed and transferred to glass tubes, containing 1·32 ml of fresh extracting solution (methanol/sulphuric acid/toluene, 100:2·5:30, v/v/v) and 400 μg/ml of heptadecanoic acid (C17:0) used as an external standard. Tubes were then sealed and agitated for 30 s, before being incubated for 90 min at 95 °C. The reaction was stopped by placing samples on ice for 10–15 min. Extraction of fatty acid methyl esters (FAMEs) was performed by adding 1 ml water and 500 μl of hexane, followed by mixing and centrifugation (850 g, 5 min at 4 °C). Ten microlitres of extract was analysed after derivatization by gas chromatography (GC) (DB-WAX column 30 m × 0·25 mm × 25 μm, Agilent Technologies). Fatty acid methyl esters were detected and quantified by flame ionisation as described by Browse et al. (Reference Browse, Mccourt and Somerville1986). Conditions used for the GC analysis system (GC 6890N, Agilent Technologies, Santa Clara, USA) were as follows: split mode injection (1 : 100), injector temperature at 250 °C, oven temperature fixed at 220 °C for 15 min and detector temperature at 260 °C, with hydrogen for carrier gas at a pressure of 100 kPa and a flow rate of 1 ml/min. Data were processed using GC Chemstation software (Agilent Technologies, Santa Clara, USA), using C17:0 as an external standard and results expressed as μg of fatty acid per mg of seeds.
Germination and seedling viability tests
The percentage of seed germination, obtained from the 57 field harvests in order to relate potential decrease of germination to S indicators, was evaluated for each commercial crop on the basis of 50 seeds (four replicates) placed on a Whatman filter paper (8–12 μm) in a Petri dish. Seeds were imbibed and kept under a cycle of dark (8 h at 18 °C) and light (16 h at 25 °C) under a 400 W high-pressure sodium (HPS) lamp. Germinated seeds, i.e. where radicles protruded through the seed coat, were scored 3, 5 and 7 days after sowing and then removed from the Petri dish. Viability was assessed by counting abnormal seedlings according to five classes: cotyledon absence, asymmetry of cotyledons, chlorotic cotyledons, lack of a caulinary apex or lack of a root system.
Statistical analysis
Principal component analysis (PCA) was used to summarize relationships between the 49 different parameters and relationships between the different commercial crops, using the ADE-4 software developed in the Biometry and Evolutionary Biology Laboratory (UMR 5558) at the University of Lyon 1 (available online at http://pbil.univ-lyon1.fr/ADE-4/home.php?lang=eng). When significant relationships between yield components emerged, correlation coefficients were calculated using Minitab version 13.2 for Windows (Minitab Inc, State College, PA, USA).
Effects of farmer practices (S and N fertilization, tillage practices, sowing date and sowing density), and soil characteristics (Total N, NO3−–N, organic N, total S, SO42−–S, organic S, N:S and NO3−–N: SO42−–S ratios, organic matter (OM) concentrations) on plant parameters were investigated by canonical correlation analysis (CCA), using the ADE-4 software. This is a statistical method that estimates the correlation between two sets of variables. Respectively, the five farmer practices and nine soil parameters mentioned above, considered as explanatory variables, were included in the analyses. In the process of CCA, the explanatory data were standardized to unit variance. Significance was tested by Monte Carlo permutation. According to Borcard et al. (Reference Borcard, Legendre and Drapeau1992), the proportion of variation of yield parameters explained by explanatory variables was obtained by the ratio of particular canonical eigenvalues to the sum of all eigenvalues (total inertia).
RESULTS
Field characteristics and cultivation practices evaluated from the survey
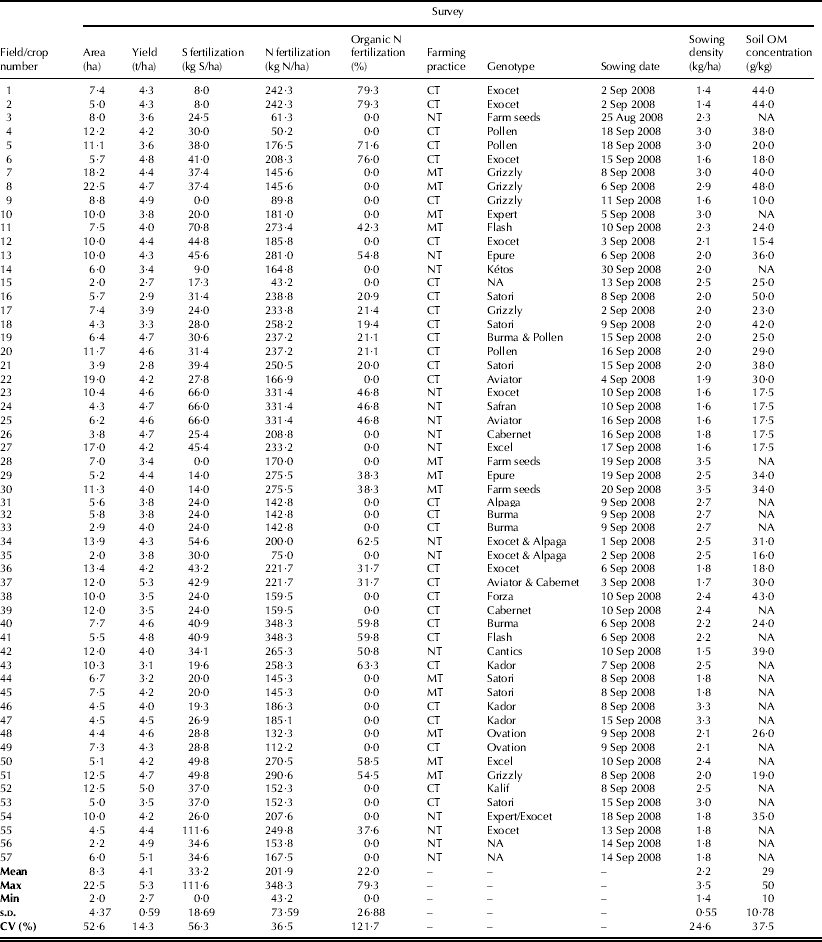
The total area of the 57 commercial crops was 473 ha with an average of 8·3 ha, and a minimum and maximum of 2 and 22·5 ha, respectively (Table 1). Soils showed a large variability in depth, texture and mineral composition (Fig. 1), with a mean OM concentration of 28·8 mg/g DW (CV of 37%), and all fields had 10–50 mg OM/g DW. Normal tillage was used in the majority of fields (34), while 12 were subjected to minimal tillage, to a depth of 50–100 mm. Finally, 15 fields were sown without any tillage (no data are available on whether the seed was direct drilled or broadcast). The 16 genotypes used, as well as farm saved seeds, were sown within a month, between 25 August (field 3) for the earliest and 20 September (field 30) for the latest, with an average sowing density of 2·23 kg/ha (CV of 25%).
Data collected from the 57 commercial crops and derived from the agricultural survey
CT : conventional tillage; MT: minimum tillage; NT: no (zero) tillage.
The mean N fertilization was 201 kg N/ha (CV of 36%) with c. 43% of fields receiving a higher dose and reaching a maximum value of 348 kg N/ha (fields 40 and 41), corresponding mostly to organic fertilization derived from cattle, poultry or pig slurry (Table 1). However, the overall N fertilization was increased when organic N was provided, at c. 262 kg N/ha on average, while crops without organic fertilization received a mean rate of 147 kg N/ha. For S fertilization, the mean applied dose was 33 kg S/ha (CV of 56%), a minimum and maximum of 0 and 112 kg S/ha, respectively. Sulphur and N fertilization rates were slightly correlated (r = 0·44, P < 0·001) (Table 1).
Relationship between plant parameters and between crops
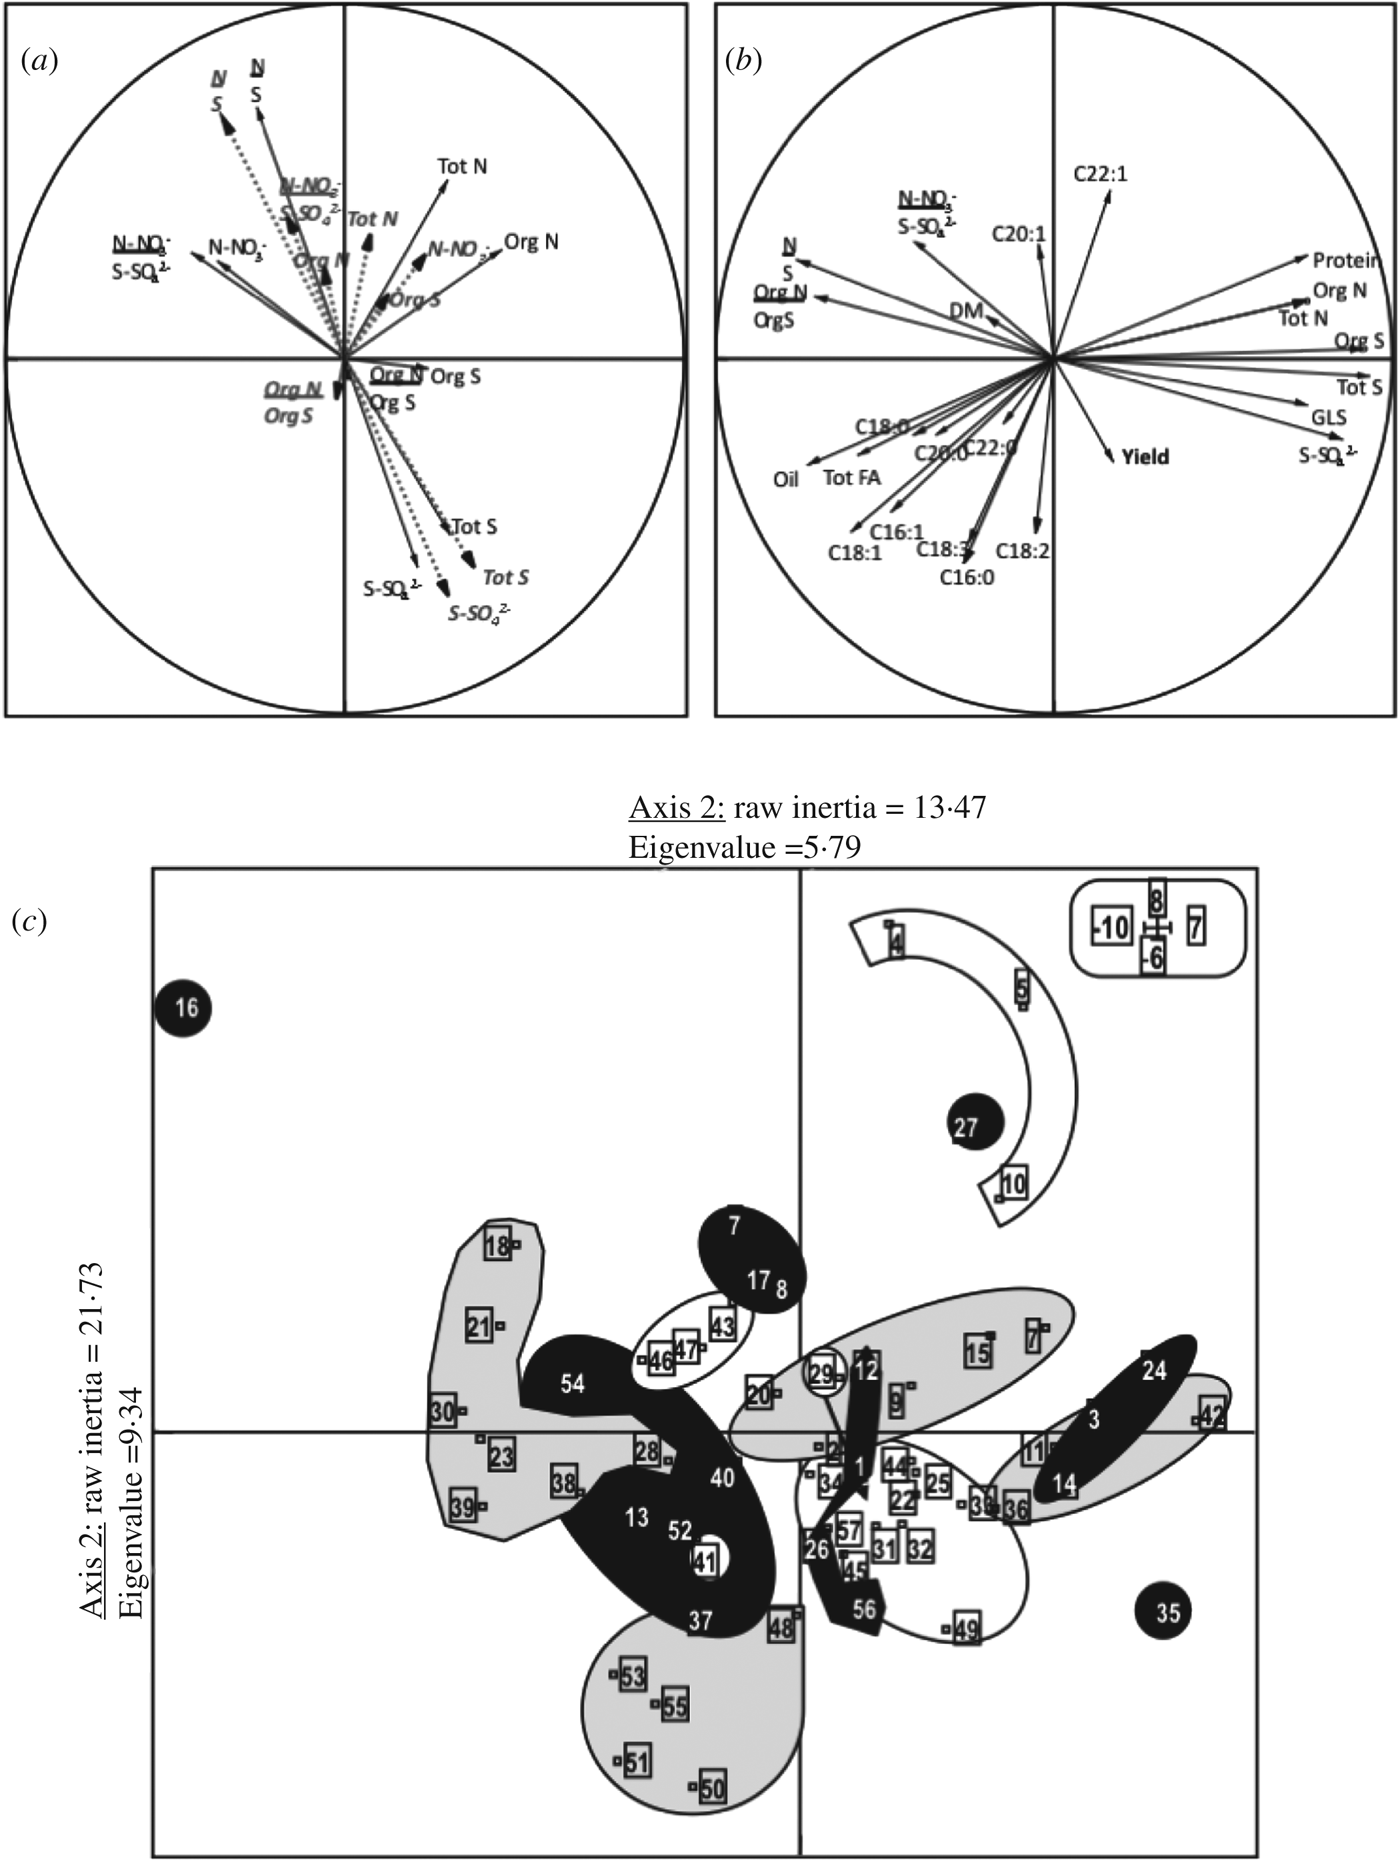
The first three principal components of the PCA accounted for 46% of the total yield variance, with the first two axes accounting for 35% (Fig. 2). They represent the range of nutrient concentrations of seeds (axis 1: total N concentration (TotN), organic N concentration (OrgN), protein, total S concentration (TotS), organic S concentration (OrgS), SO42−–S concentration) and both stems and leaves (axis 2: TotS, SO42−–S; axis 3: TotN, OrgN). In all organs, SO42−–S and TotS concentrations appear to be highly correlated (r = 0·96, 0·92 and 0·90 in senescing leaves, stems and seeds, respectively), whereas NO3−–N and N concentrations were not linked (Fig. 2). Nitrogen and S concentrations were correlated in seeds (r = 0·87) as well as with GLS concentration (r = 0·65 and 0·86 with N and S, respectively), and all of them were negatively correlated with oil concentration. No link between N and S concentrations or ratios in the different plant organs emerged. According to the three principal components, fields were classified into 11 main groups, while crops 16 and 35 were clearly different from all the others. Vegetative parts of plants from field 16 were S depleted and their seeds had the lowest concentration of both S and N. Plants from field 35 had high seed S and N concentrations, a high S concentration in leaves and stems, while their seeds showed high GLS and low oil concentration.
Principal component analysis of yield parameters; correlation circles on the factorial planes determined by the first two principal components corresponding to (a) senescing leaves (solid arrows), stems (dashed arrows; italics) and (b) seeds, respectively. (c) Projection of the commercial crops (numbers refer to fields/crops given in Table 1). Abbreviations: Tot N: Total N concentration; NO3−–N: Nitrate-N concentration; Org N: Organic N concentration; Tot S: Total S concentration; SO42−–S: SO42−–S concentration; Org S: Organic S concentration; N/S: Ratio of N/S concentrations; NO3−–N/SO42−–S: Ratio of NO3−–N/ SO42−–S; Org N/Org S: Ratio of organic-N/organic-S concentrations; Yield: seed yield; DM: % Dry matter of seed; Protein: Protein concentration of seed; Oil: Oil concentration of seeds; GLS: Total glucosinolate concentration of seeds; Tot FA: Total fatty acid concentration of seed; Cx:y: Fatty acids Cx (16–22):y (0–3).
N and S concentrations in senescing leaves, stems and seeds
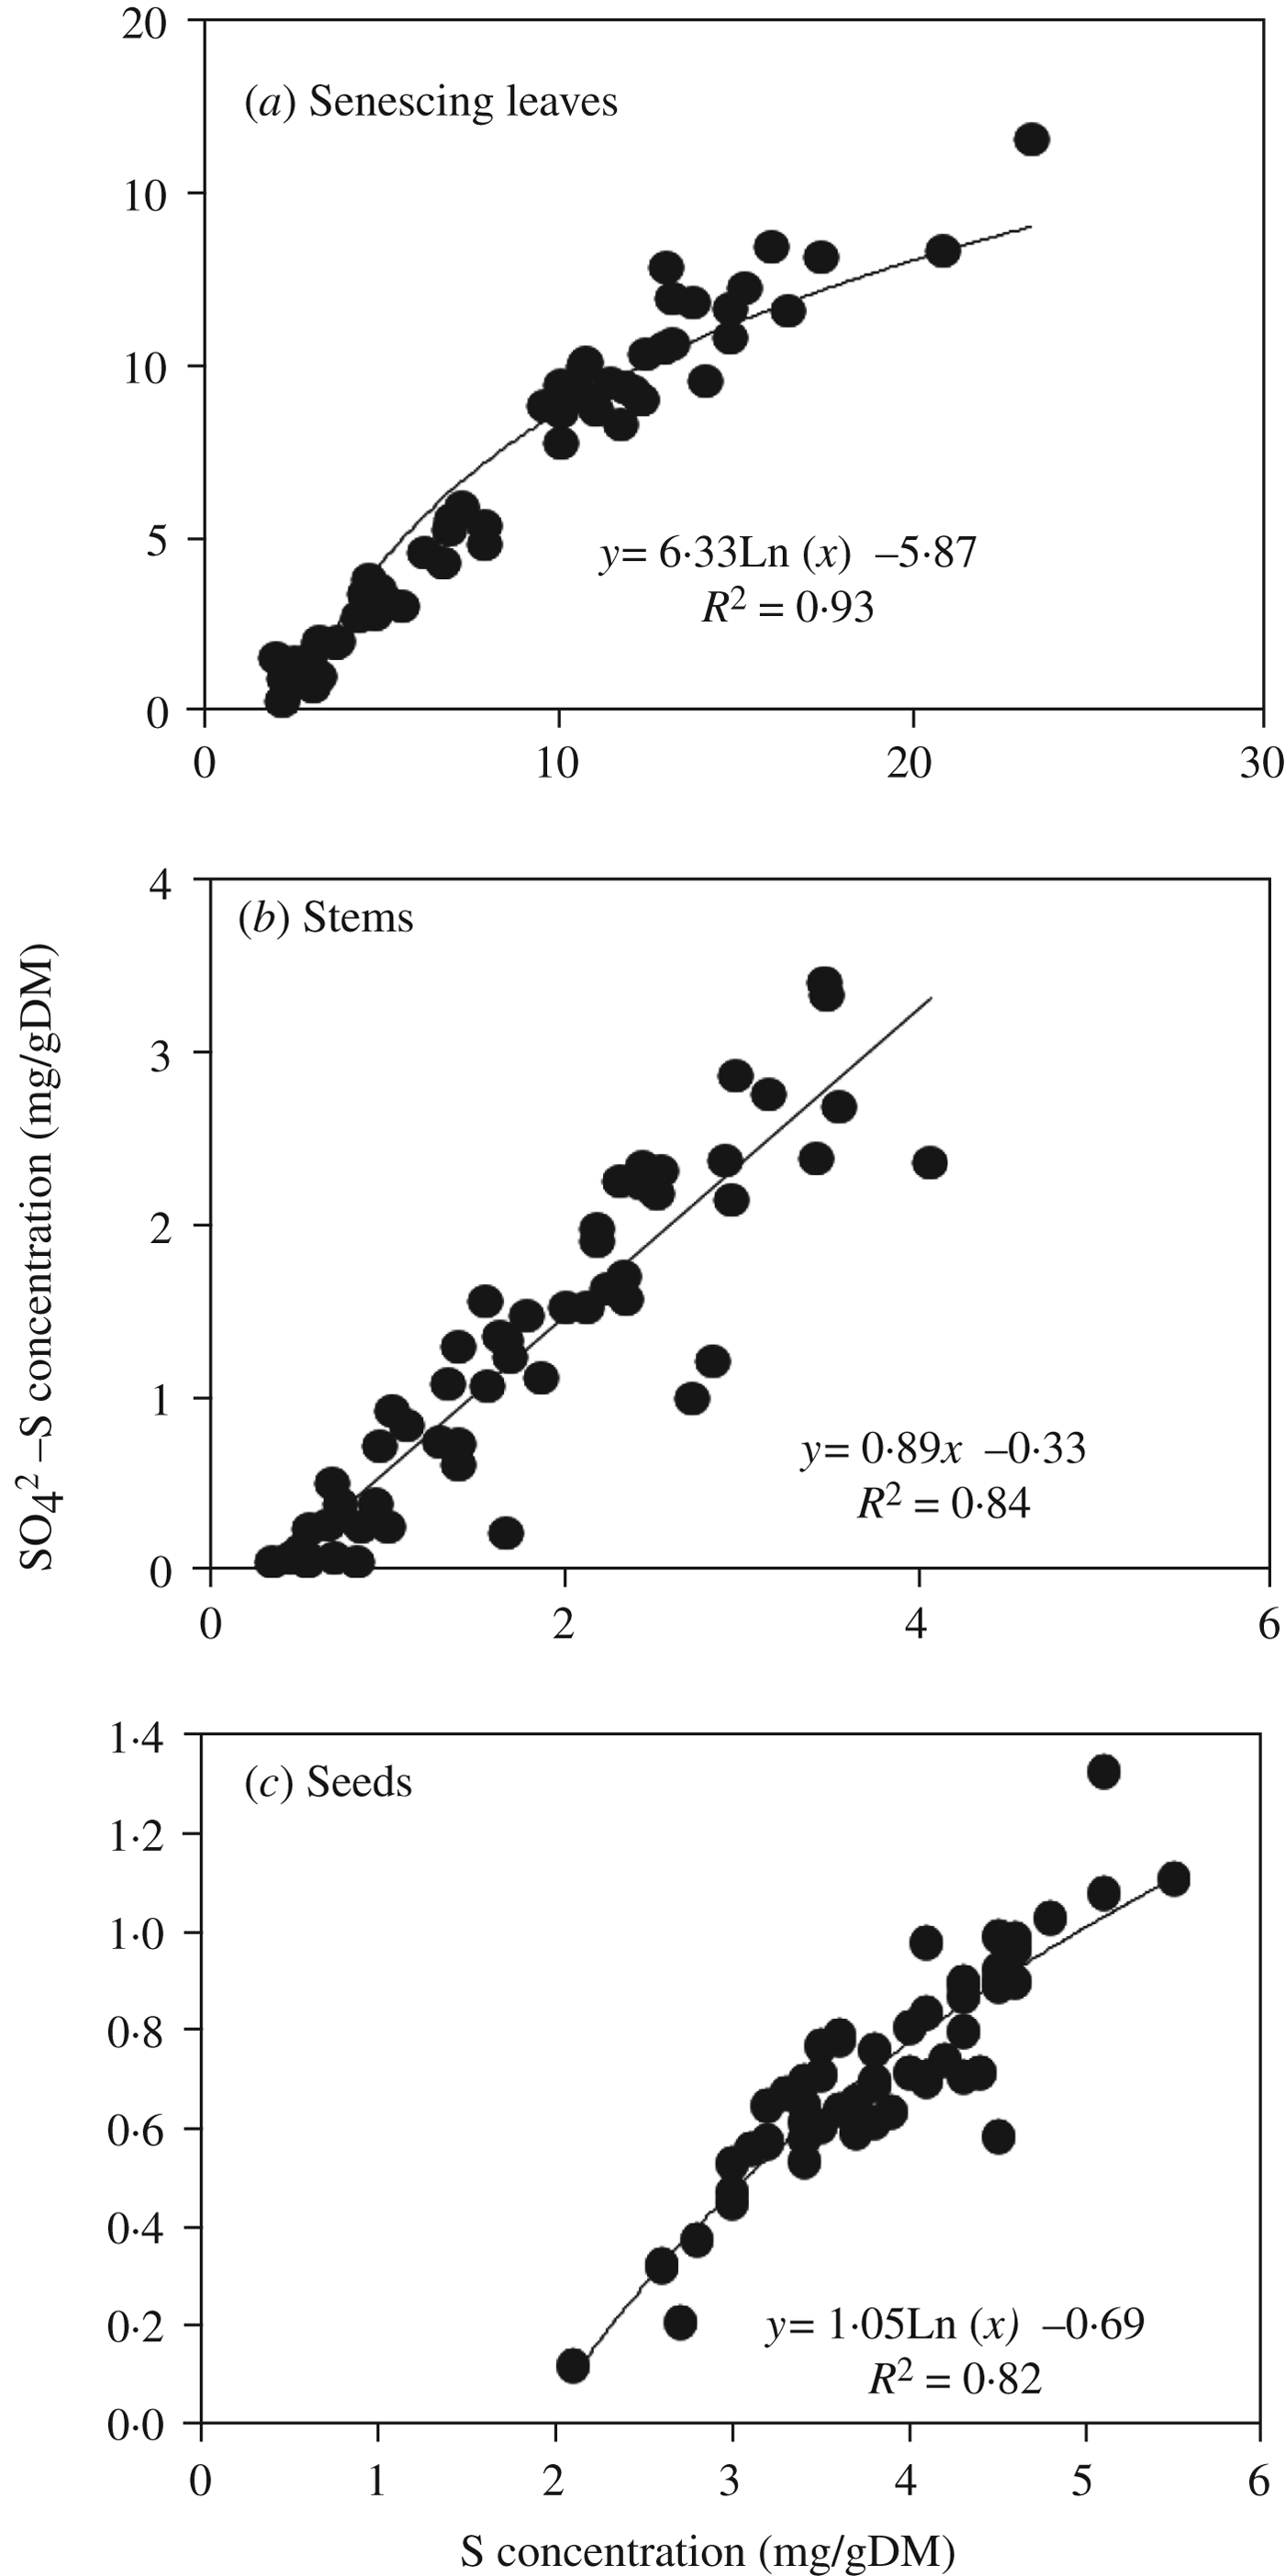
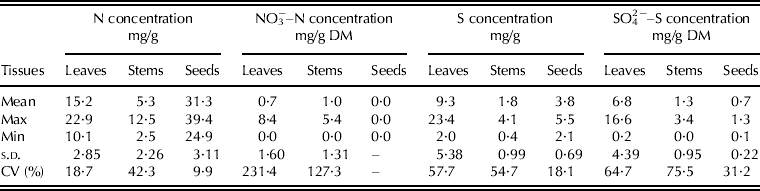
Senescing leaves and stems were collected in late May and June, respectively, i.e. after the beginning of seed filling. The remaining N in leaves just before their abscission was c. 15·2 mg N/g DM on average (CV of 18%), with extreme values of 10 and 22 mg N/g DM (Table 2). Nitrate-N accounted on average for <5% of total leaf N, the rest being in an organic form, mostly as protein and amino acids, which fully correlates with total N in leaves. Senescing leaves that contained the largest amount of NO3− were derived from fields receiving high N fertilization provided mostly in an organic form (Table 1, fields 13, 16, 30, 42, 43 for example) while the leaf NO3− concentration was low in fields 31, 46 and 57, which had received a medium N fertilization rate. The N concentration in stems, which was lower than in senescing leaves, was 2–12 mg N/g DM with a mean value of 5·3 mg N/g DM (Table 2). In stems, NO3−–N accounted for c. 0·19 of total N. However, N concentration in seeds was higher (31·3 mg N/g DM) and with a lower variation among crops (CV of 9·9%) than in senescing leaves or stems, and moreover, without accumulation of NO3−. For S concentration, senescing leaves contained more S than stems (9·3 v. 1·8 mg S/g DM), with CVs of 57 and 54%, respectively. Again, the S concentration in seeds (3·82 mg S/g DM) showed a lower variation (CV of 18%) than in the vegetative tissues. Sulphate-S in DM accounted on average for 0·73, 0·69 and 0·18 of total S, in senescing leaves, stems and seeds, respectively. This may be partly explained by the highly significant logarithmic (leaves and seeds) or linear (stems) relationships found between total S and SO42−–S (Fig. 3). The average, minimum and maximum SO42−–S recorded in senescing leaves was 6·8, 0·2 and 16·6 mg SO42−–S/g DM, respectively (Table 2). No SO42− accumulation in leaves was observed in fields that showed very low total S concentration, e.g. 3, 4, 16, 18 and 30 (Fig. 3a, Table 1). Plants from field 55, which received the highest S fertilization (112 kg S/ha, Table 1), showed one of the highest S and SO42−–S concentrations among senescing leaves and stems. However, plants with extremely high S and SO42−–S concentrations (fields 1, 3, 26 and 35, e.g. Table 1) received an average S fertilization level (between 25 and 50 kg S/ha).
Relationships between total S concentration and SO42−–S concentration in (a) senescing leaves, (b) stems and (c) seeds of oilseed rape collected from 57 commercial crops.
Nitrogen, S, NO3−–N and SO42−–S concentrations in senescing leaves, stems and seeds harvested from the 57 commercial crops. Values are given as the mean, maximum and minimum values obtained from samples collected from the 57 commercial crops. Standard deviation is given for n = 57 and is also expressed as a percentage of the mean
Seed yield and quality
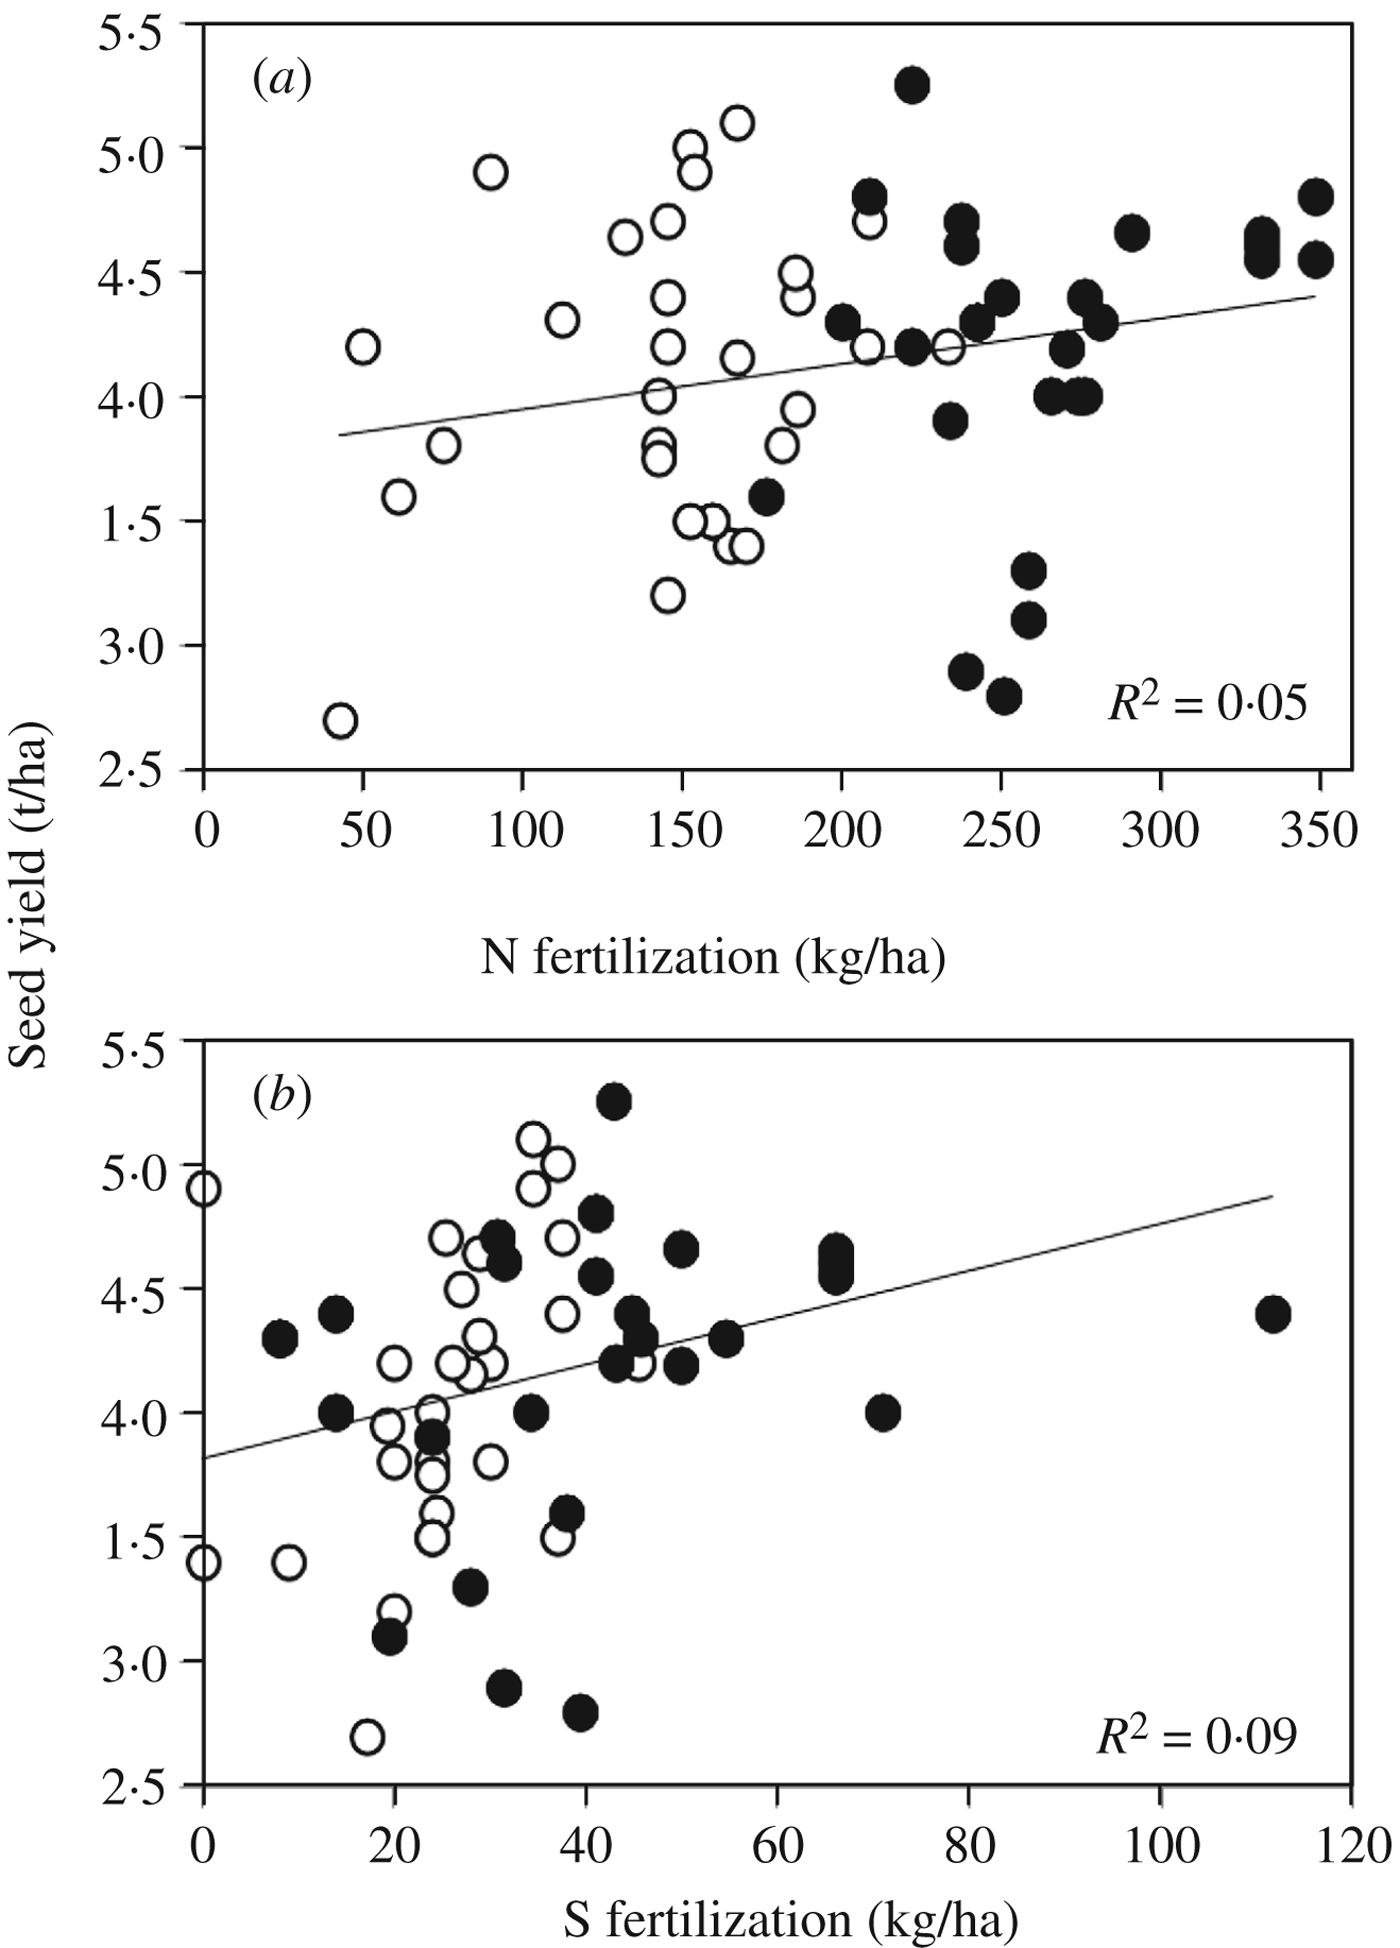
The average seed yield was 4·13 t/ha for all commercial crops with a CV of 14·3% and a range of 2·7–5·25 t/ha, which was fairly high compared to the usual yields in this area (3–3·5 t/ha) and to the average worldwide yield (3 t/ha) estimated for 2010 by Rondanini et al. (Reference Rondanini, Gomez, Agosti and Miralles2012). This corresponded to a mean offtake of 129 and 15·8 kg/ha of N and S, respectively. For the 57 commercial crops, seed yield was not correlated to N or S fertilization rates (Fig. 4). A similar yield was obtained with 90 (field 9) or 350 kg N/ha (field 41) or with 0 or 37 kg S/ha. The CV for N (9·9%), S (18·1%) and SO42−–S (31%) concentrations in the seeds (Table 2) were in all cases lower than those found for senescing leaves and stems. In seeds, the relative concentrations of oil (488 mg/g DM with a variation from 473·36 to 502·64 mg/g and protein (189 mg/g DM with a CV of 8·2%) (Table 3) were kept in a narrow range of variation, while the GLS concentration was more variable between fields (12·7 μmol/g DM with CV of 32%). Most seed fatty acids (475 μmol/g DM with CV of 10%) were in the form of C18:1 (mean of 299 μmol/g DM) followed by C18·2 then C18·3. The germination and viability of seedlings were also determined, but they did not reveal any relationships with factors other than seed DM (Table 3); in other words, the greater the dryness of the seeds at harvest, the higher the percentages of germination and viability.
Seed yield as a function of (a) total N and (b) S fertilization estimated from 57 commercial crops of oilseed rape. Open circles: mineral fertilization only; closed circles: organic or/and mineral fertilization.
Seed tests (germination and viability), concentration of oil, proteins, GLS and fatty acid composition in the seeds harvested from the 57 commercial crops. Values are given as the mean, maximum and minimum values obtained from samples collected from the 57 commercial crops. Standard deviation is given for n = 57 and is also expressed as a percentage of the mean, i.e. CV. The concentrations of C16:1, C20:0, C22:1 and C22:2, being very low, are not given
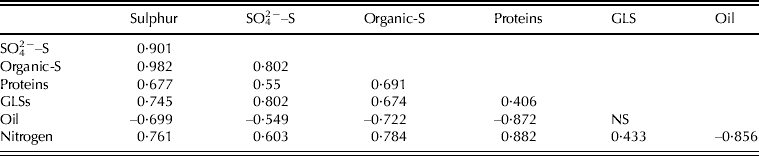
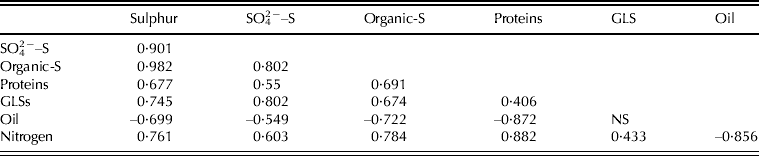
Among the different parameters used, it appears that all S fractions (total S, SO42−–S, Organic-S and GLS) in seeds were positively and highly significantly correlated with each other as well as with N and protein concentration (Table 4). In contrast, they were all negatively and linearly correlated with oil concentration. However, no significant correlation was found between oil and GLS concentration (Table 4).
Coefficients of correlations between seed parameters. All correlations were significant at P ≤ 0·001, except between oil and GLS concentrations
Incidence of cultivation practices and soil parameters on yield components
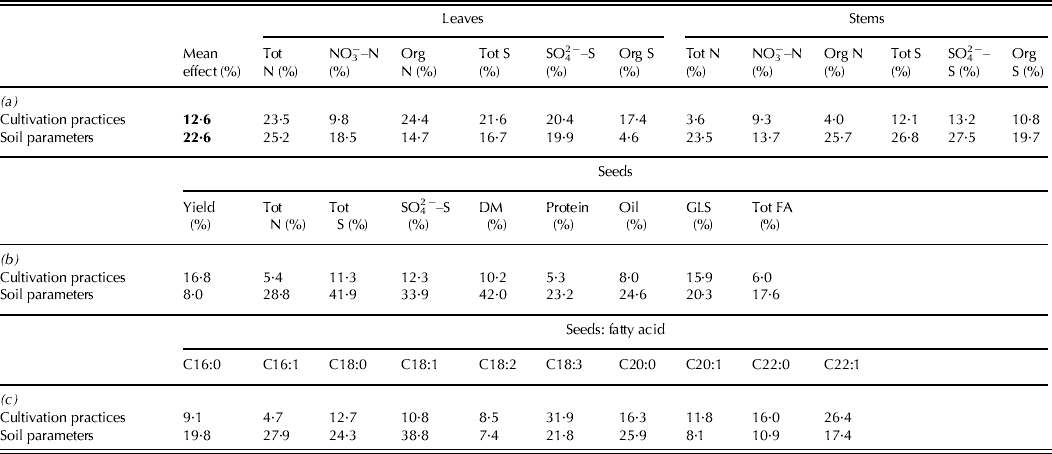
Canonical correlation analysis suggested a poor overall effect of cultivation practices on yield: on average, only 12·6% of the variance in the plant parameters was explained by cultivation (Table 5). The inertia decomposition revealed that the S and N concentrations of leaves and also C18:3 and C22:1 concentrations of seeds were the most sensitive parameters, with almost 20–25% of their variance explained by cultivation practices, whereas stems or other components of seed composition were poorly influenced. It could be suggested, however, that C22:1 concentrations were related to the oilseed rape variety rather than to nutrient availability. Overall, no clear relationship emerged between S fertilization rates and S or SO42− concentrations in plant tissues and this suggests that despite S fertilization, S concentration in the soil and subsequent mineralization were probably very different among fields. Soil characteristics appeared to have stronger effects on plant parameters, explaining on average 22·6% of their variance (Table 5). The main influence was measured in seed parameters with almost 30–50% (seed mass, S concentrations) of their variance explained by soil parameters (inertia decomposition; Table 5). In contrast, leaves and stems were less influenced.
Variation of plant parameters explained (projected inertia) by Canonical Correspondence Analysis considering cultivation practices and soil parameters. a: Mean effect, leaf and stem parameters, b: seed parameters, c: focus on seed fatty acids. Data for N:S ratios for all plant organs and NO3− concentrations in seeds (always very low), are not given. The meaning of the abbreviations is given in Table 1
Relationships between NO3− and SO42− concentrations and risks of S deficiency
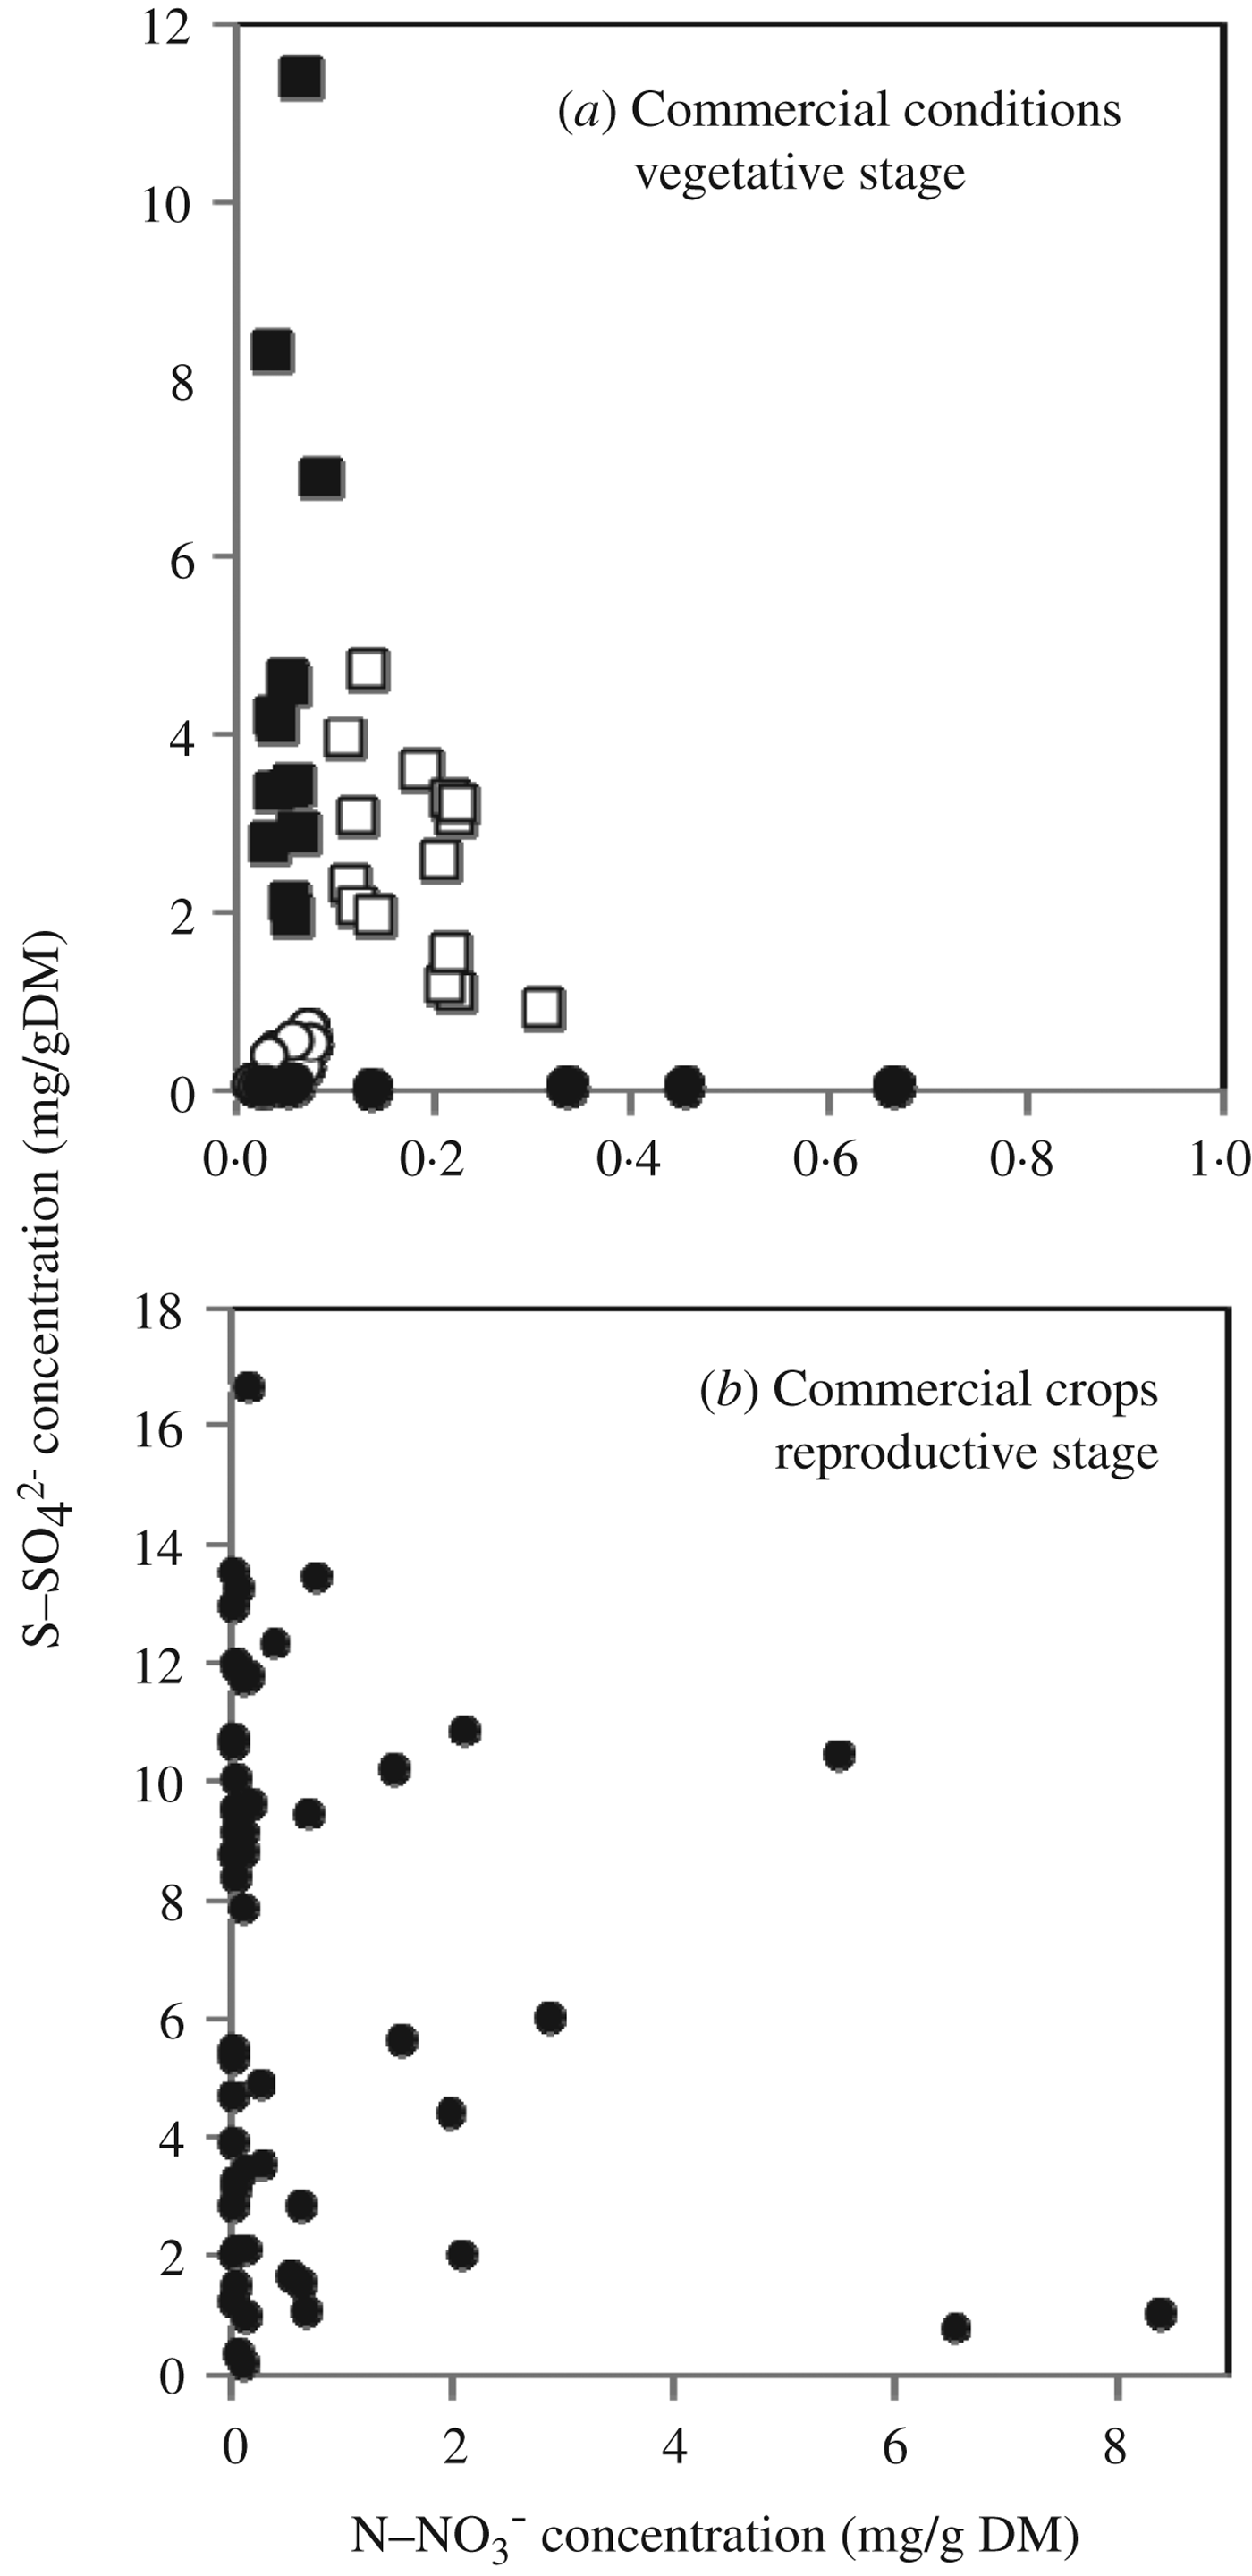
In order to facilitate the interpretation of data from commercial crops, data of NO3−v. SO42− concentrations in leaves of oilseed rape cvar Capitol grown hydroponically and submitted to different lengths of S starvation were used. Figure 5a shows that senescing leaves of plants under an ample supply of S contained SO42−–S concentrations in the range of 1–12 mg/g DM with the NO3− concentration lower than 0·3 mg/g DM. Two weeks of S starvation led to nearly the total disappearance of SO42− (with a threshold estimated at 2 mg SO42−–S/g DM), without massive NO3−–N accumulation or growth reduction (data given in Abdallah et al. Reference Abdallah, Etienne, Ourry and Meuriot2011). With 4 weeks of S starvation, growth was lowered while NO3−–N was accumulated up to 1·2 mg/g DM. Similar data obtained from the present study for commercial crops are given in Fig. 5b. First of all, the range of variation was larger with an accumulation in older leaves of SO42−–S and NO3−–N up to 18 and 8 mg/g DM, respectively. Moreover, NO3−–N was found at a relatively high level in leaves that had also accumulated SO42−, which was the case for fields 5, 7, 9, 19, 27, 48 and particularly 13. This could be partly the result of high rates of N fertilization, such as the 275 kg N/ha given to field 13, for example (Fig. 3). On the other hand, two fields (16 and 30) showed the highest leaf NO3−–N concentration (6·5 and 8·4 mg/g DM, respectively), which may indicate that they were S limited when the data of Fig. 5a is considered. This was further supported by the fact that plants from these two fields were characterized by low S concentrations in seeds, stems and leaves (Fig. 3). For example, plants from field 16 had one of the lowest yields (2·9 t/ha, Fig. 4) with the lowest S and SO42− concentration in seeds, stems and senescing leaves (Table 2, Fig. 3). Moreover, these plants were also characterized by the lowest seed GLS concentration (4·2 μmol/g DM, Table 3). Their leaves showed the second highest NO3− concentration (Fig. 5b) but the lowest leaf organic N concentration (5·0 mg organic-N/g DM), suggesting that S deficiency affected N assimilation negatively.
Relationships between SO42−–S and NO3−–N concentrations of oilseed rape in (a) leaves of vegetative plants grown in controlled conditions under different S supplies (data derived from Abdallah et al. Reference Abdallah, Etienne, Ourry and Meuriot2011) and (b) senescing leaves of plants harvested in commercial crops. Numbers refer to the commercial crop identifications given in Table 1. In (a), leaves were harvested from plants grown with ample supply of SO42− for 42 (open squares) or 56 (closed squares) days, or grown for 28 days with ample supply of SO42− followed by 14 (open circles) or 28 days (closed circles) of S starvation.
DISCUSSION
For economic and environmental reasons, optimization of S fertilization is required, and several diagnostic tools to enable evaluation of plant S status have been proposed. However, due to spatial and temporal soil variability, S or SO42− concentrations in the soil are not usually considered appropriate (Malhi et al. Reference Malhi, Solberg and Nyborg2005; Pagani & Echeverria Reference Pagani and Echeverria2011). A range of methods, from analysis of different N and S compounds in plants (Blake-Kalff et al. Reference Blake-Kalff, Hawkesford, Zhao and Mcgrath2000) to the potential use of molecular indicators (Howarth et al. Reference Howarth, Parmar, Barraclough and Hawkesford2009), may provide indications of S status at a given stage. However, none of them are currently used under field conditions, probably because (as with biochemical indicators such as total S or N:S ratio) they require laboratory analysis. In wheat and oilseed rape, Blake-Kalff et al. (Reference Blake-Kalff, Hawkesford, Zhao and Mcgrath2000) considered that the N:S ratio of young or mature leaves may not be a reliable indicator, first because it requires two analytical determinations with potentially inaccurate determination of S and second because the N:S ratio reflects their relative proportion rather than their actual magnitude. Therefore, a low N:S ratio may be obtained when plants are submitted to N deficiency only and conversely, a high N:S ratio can result from an oversupply of N and S. Alternatively, Blake-Kalff et al. (Reference Blake-Kalff, Hawkesford, Zhao and Mcgrath2000) provided evidence that the leaf malate to SO42− ratio, based on an inverse correlation of concentrations during S deficiency, could be a better indicator. However, according to their data, the accuracy of malate:SO42− ratio may be questionable because it varied from 0·1 to 100 without any difference in seed yield. Additionally, the results of Blake-Kalff et al. (Reference Blake-Kalff, Hawkesford, Zhao and Mcgrath2000), as well as those of the present work, showed that under S deficiency NO3− is largely accumulated in leaves of oilseed rape with a more rapid increase than that found for malate accumulation.
The approach used in the present work relied on a survey of soil and plant analysis of 57 commercial crops, chosen for contrasting soils and along a rainfall gradient that may affect S soil concentration and SO42− leaching, and hence availability of S. The objectives were to analyse variation in cultivation practices and plant traits for S status in order to obtain robust relationships and allow comparison with results obtained in controlled conditions (Abdallah et al. Reference Abdallah, Etienne, Ourry and Meuriot2011). No relationship was found between yield (average of 4·13 t/ha) and N or S fertilization. This could be explained for N by the fact that, in some cases, N supply was provided according to the yield objective and the estimated soil residues from the previous crop, but also to the large use of organic fertilizer that was frequently in excess of the rate that was requested. Sulphur fertilization on the other hand was not governed by the balance between its soil availability and the plant demand, which can be illustrated by the range of potential rates: from 0 to 112 kg S/ha, which is far removed from the average offtake by seeds (15·8 kg S/ha) and from the usual fertilizer recommendations (c. 30 kg S/ha). Overall results showed that cultivation practices and soil characteristics explained only 25% of seed yield variance.
Despite the maximization of variation provided by this protocol, all values measured for seeds remained within a narrow range: the variation within protein, oil, N, S, SO42−, and different fatty acids was <10%. Only GLS concentrations showed a wider variation (32·5%). This can be easily explained by the fact that seed dry matter accumulation is limited and/or controlled by the availability of the main macronutrients, and mostly N, S and C, and this is further supported by the linear correlations found between seed compounds. As previously described (Jackson Reference Jackson2000; Ahmad et al. Reference Ahmad, Jan, Arif, Jan and Khattak2007), N concentration (mostly proteins) in seeds was negatively correlated with oil concentration but positively correlated with S concentrations, i.e. S, SO42− or GLS. It must also be pointed out that seeds accumulated significant amounts of SO42−, which was not the case for NO3−. For instance, Malhi et al. (Reference Malhi, Gan and Raney2007) showed a positive linear relationship between the rate of S fertilization and GLS concentration in seeds, at least for some cultivars. Recent literature suggests that S accumulation in seeds may have a role for oxidative protection of seedlings as well as providing S for redox homoeostasis, a mechanism that has to be tightly controlled during development of orthodox seeds (Zuber et al. Reference Zuber, Davidian, Wirtz, Hell, Belghazi, Thompson and Gallardo2010). In contrast, total or mineral S and N concentrations in senescing leaves and stems showed a much wider variation between crops, being even higher for S than for N. This can be easily explained in the light of what is known for the mobilization of N (Gombert et al. Reference Gombert, Etienne, Ourry and Le Dily2006; Desclos et al. Reference Desclos, Etienne, Coquet, Jouenne, Bonnefoy, Segura, Reze, Ourry and Avice2009) and S (Dubousset et al. Reference Dubousset, Abdallah, Desfeux, Etienne, Meuriot, Hawkesford, Gombert, Segura, Bataille, Reze, Bonnefoy, Ameline, Ourry, Le Dily and Avice2009, Reference Dubousset, Etienne and Avice2010; Abdallah et al. Reference Abdallah, Dubousset, Meuriot, Etienne, Avice and Ourry2010, Reference Abdallah, Etienne, Ourry and Meuriot2011) in oilseed rape leaves. While N mobilization, mostly as leaf protein hydrolysis, occurs during senescence, it is usually increased when the N supply is limited. Sulphur mobilization, mostly as SO42−, also occurs from leaves, but only when S availability is restricted, and it occurs independently of foliar senescence. Leaf fall can then occur with fairly high amounts of SO42−. As a result, the SO42− and S concentrations in dead leaves from the 57 commercial crops studied showed a larger variation than for the N or NO3− concentrations.
Robust linear or logarithmic relationships were found between S and SO42− concentrations in senescing leaves, stems and seeds, giving access to the theoretical minimum S concentration without SO42− accumulation, and these were 2·51, 0·37 and 2·06 mg S/g DM, respectively. A critical threshold of 2 mg SO42−–S/g DM in leaves was identified from plants grown under S limitation in hydroponic conditions (Abdallah et al. Reference Abdallah, Etienne, Ourry and Meuriot2011). Eleven fields were under this threshold, which may indicate that 18% of the commercial crops were at risk of S deficiency. This provides evidence of situations where plants were S limited, to the extent that stored S was mobilized before the end of senescence. However, this does not mean that plants were under S deficient conditions, as only seeds from fields 16 and 30 contained a very low amount of S and SO42−, with high NO3− concentrations combined with a low yield. Therefore, a SO42− threshold alone in leaves cannot be used as an indicator of S deficiency.
The comparison between plants grown in controlled conditions under sufficient supply of nutrients with those grown in field conditions provides evidence that plants from the field may receive excessive S supply because the senescing leaf SO42−–S concentrations may be higher (up to 17 mg S/g DM). Results derived from Abdallah et al. (Reference Abdallah, Etienne, Ourry and Meuriot2011) and the present work show that according to the length of S starvation, plants first mobilized leaf SO42− in order to sustain growth, and this occurs up to a point where growth is limited and NO3− is accumulated. A similar trend is obtained with plants grown under field conditions, although NO3− can be accumulated to substantial levels when excessive N fertilization is applied, which was the case when organic fertilization was also supplied. The effects of S deficiency on plant N metabolism have been described by several authors. A general effect involves an increase in NUE following S fertilization (Schnug et al. Reference Schnug, Haneklaus and Murphy1993; Fismes et al. Reference Fismes, Vong, Guckert and Frossard2000; Dubousset et al. Reference Dubousset, Etienne and Avice2010). Kaur et al. (Reference Kaur, Chandna, Pandey, Abrol, Iqbal and Ahmad2011) showed in B. rapa plants that S starvation for 1–6 days induced a decline in the uptake of NO3−, as well as the activities and expression levels of NO3− reductase (NR) and glutamine synthetase (GS), without effects on nitrite reductase (NiR) and glutamate synthase (GOGAT) activities. Thomas et al. (Reference Thomas, Bilsborrow, Hocking and Bennett2000) showed in Beta vulgaris L. that S deficiency increased NO3− and arginine concentrations in shoots. In Arabidopsis thaliana, evaluation of amino acid profiles under S-starvation conditions showed two- to fourfold enhancement in the arginine, asparagine and O-acetyl-l-serine (OAS) concentrations, whereas the cysteine and methionine concentrations were strongly reduced (Nikiforova et al. Reference Nikiforova, Kopka, Tolstikov, Fiehn, Hopkins, Hawkesford, Hesse and Hoefgen2005). These results corroborate the tight interconnection of S-nutrition with NO3− assimilation. However, it could also be hypothesized that NR activities are reduced before NO3− uptake leading to its accumulation, with an inhibition triggered by the accumulation of non-S amino acids. Alternatively, the disappearance by mobilization of SO42− in leaves, initially present in large amounts, may also require osmotic adjustment, and for example, its replacement by other anions such as NO3− (Ourry et al. Reference Ourry, Gonzalez and Boucaud1989). Nevertheless, the combined evaluation of NO3− and SO42− in senescing leaves could provide an indicator for the risk assessment of S deficiency even at early stages, with the added advantage that they can be easily quantified in the field. However, the use of such indicators to recommend S fertilization requires a dynamic modelling approach to relate the amount of SO42− available for mobilization at a given stage to the amount of S requested for an expected yield, together with the availability of S from the soil as described, for example, by Niknahad-Gharmakher (Reference Niknahad-Gharmakher2008).
The authors are grateful to Marie Paule Bataillé for her excellent assistance with N and S analyses, to Dr Frédéric Meuriot for his help with some of the field harvests and to Laurence Cantrill for improving the manuscript. X.S. was funded by the FUI (Fonds Unique Inter-ministériel, French government) through the Azostimer Project.