Introduction
In the context of global markets, where the demand for off-season vegetable production is increasing, greenhouse production has the potential to become a niche market for organic products (Tüzel et al., Reference Tüzel, Duyar, Oztekin, Gurbuz Kilic, Anac, Madanlar and Yoldas2013). As known, in the European Union (EU), organic production is ruled by specific regulations. Nevertheless, in Council Regulation (EC) n. 834/07 (EC, 2007) and Commission Regulation (EC) n. 889/08 (EC, 2008), no direct reference is made to organic greenhouse production. This lack of legislation has lead to the implementation of national rules derived from the interpretation of the general regulation on organic farming (Van Der Lans et al., Reference Van der Lans, Meijer and Blom2011). Due to the high level of intensification of greenhouse production, this lack of specific normative has determined the widespread use of ‘conventionalized’ systems of production, based more on a simplified approach of input-substitution rather than the respect of the basic principles of organic farming (Guthman, Reference Guthman2004; Darnhofer et al., Reference Darnhofer, Lindenthal, Bartel-Kratochvil and Zollitsch2010). On the one hand, a ‘conventionalized’ approach to organic production has allowed, in recent years, a significant growth of yield (Voogt et al., Reference Voogt, de Visser, van Winkel, Cuijpers and van de Burgt2011). On the other hand, it has increased the risk of implementing a simplified system of organic production that mimics conventional agricultural practices. Thus, organic farms could develop practices not excluded by the organic norms but are not sustainable in the long term (Padel et al., Reference Padel, Röcklinsberg, Verhoog, Fjelsted Alrøe, de Wit, Kjeldsen and Schmid2007). Indeed, it has been proven that high input agricultural systems (either organic or conventional) are not resilient (King, Reference King2008; Foley et al., Reference Foley, Ramankutty, Brauman, Cassidy, Gerber, Johnston, Mueller, O'Connell, Ray, West, Balzer, Bennett, Carpenter, Hill, Monfreda, Polasky, Rockstrom, Sheehan, Siebert, Tilman and Zaks2011; Plieninger and Bieling, Reference Plieninger and Bieling2013).
In organic greenhouse, one of the more controversial issues of debate is soil fertility management. Overall, soil fertility management in organic production is much more complex than in conventional systems. It should be based on agroecological strategies, requiring deep knowledge of the pedoclimatic situation and of nutrient flow through the agro-ecosystem. Soil fertility should be regulated by crop rotation and applications of green manure, animal manure and/or compost together with low input organic fertilizer. The introduction of cover crops in the rotation may also help maintain soil fertility (e.g. increasing soil nutrient availability; reducing soil erosion) and provide other so-called agroecological services, like pest and weed control. For this reason, the most recent scientific literature defined them as agroecological service crops (ASCs) (Canali et al., Reference Canali, Diacono, Campanelli and Montemurro2015).
Another important aspect of soil fertility management is the need to estimate organic biomass mineralization rates and their synchronization with plant needs. In this context, the use of simplified nutrient budgets may allow the evaluation of short- and long-term soil fertility management strategies (Tittarelli et al., Reference Tittarelli, Campanelli, Farina, Napoli, Ciaccia, Testani, Leteo and Canali2014; Montemurro et al., Reference Montemurro, Tittarelli, Lopedota, Verrastro and Diacono2015). Moreover, it is necessary to individuate the agronomic practices that are able to guarantee both high quality and nutritional content of the production with a low amount of external inputs (Rembiałkowska, Reference Rembiałkowska2007).
In this context, a 2-year greenhouse experiment has been carried out with the aim of finding a Mediterranean organic greenhouse production system, which can be sustainable in terms of yield and quality productions. A conventionalized system was compared with two alternative (agroecological) systems, which were based on more complex fertilization patterns, characterized by combinations of green manure, compost, cattle manure and commercial organic fertilizers.
The following specific objectives were pursued: (i) to verify the hypothesis that the implementation of agro-ecological approaches to soil fertility management does not affect organic strawberry yields and quality in greenhouse; (ii) to verify the hypothesis that agro-ecological systems are able to synchronize soil mineral nitrogen (N) availability with plant needs throughout the cash crop cycle; (iii) to assess short- and long-term fertility of the compared systems; and (iv) to assess fruit quality differences.
Materials and Methods
Experimental site
The research was carried out at the MORE GREEN LTE (Long terM experiment on ORganic vEgetable production systems in Mediterranean GREENhouse) located at the Mediterranean Agronomic Institute of Bari (MAIB), in Valenzano (Apulia region- Southern Italy; 41°08′N latitude and 16°51′E longitude). The altitude is about 72 m above sea level. The experimental greenhouse (300 m2–7.5 m × 40.0 m) was an un-heated tunnel (EUROPROGRESS s.r.l.—Italy) with galvanized steel frames covered by ethylene vinyl acetate (EVA) sheets. It was divided into two fields (field I and field II) and cultivated with tomato and strawberry crops in rotation, in the 2012–2013 and 2013–2014 seasons. The present research was based on two cycles of strawberry cultivation (September 2012–May 2013 and September 2013–May 2014 in field II and I, respectively).
Experimental design
The organic farming systems under comparison were: (i) SUBSTITUTION (SB), a widely adopted organic production system (very common especially in greenhouse vegetable production), which mimics conventional agriculture by substituting agrochemicals with allowed organic products; (ii) AGROMAN (AM), characterized by the use of a mixture of ASCs (MIX 1) and mature organic manure as soil amendment; and (iii) AGROCOM (AC), which utilizes a different mixture of ASCs (MIX 2) and, as soil amendment, on-farm made compost. The composition of the two ASCs mixtures is shown in Table 1. The experimental layout was a completely randomized block (CRB) design with three replications (9 plots of 3.0 m × 4.0 m each). The choice of ASC mixtures, rather than a single ASC species, was made in order to better guarantee the provision of the ecological services in the long run. Before ASC sowing, the soil was prepared using a rotary tiller. ASC mixture seeds were broadcasted by hand and gently covered with soil using a rake on the June 6, 2012 and June 15, 2013. At the start of flowering (about 50 days after sowing in both the years), ASC were manually chopped by using a sickle and ploughed into the soil as green manure using a rotary spader.
ASC mixtures used before strawberry and their ecological functions. MIX1 and MIX2 have been cultivated before strawberry in the AM and AC systems, respectively.

ASC, agroecological service crop; AM, AGROMAN; AC, AGROCOM.
Strawberry (Fragaria × ananassa var Duchesne, ‘Festival’) was transplanted on the September 22, 2012 and on the October 4, 2013, using certified seedlings from an organic nursery (Vivai f.lli Zanzi—Ferrara, Italy). Density of strawberry crop was 3.25 plants m−2, (0.9 m between lines and 0.3 m within each line). The air temperature at 2 m height was measured hourly by two probes during both ASC and strawberry cycles. The sides of the tunnels were manually opened at sunrise and closed at sunset in order to decrease the air humidity and keep temperature under control (between 10–28°C). On the first year, harvesting started on the March 11, and ended on the May 7, 2013. Strawberry was harvested, according to the ripening stage scale defined by Mitcham et al. (Reference Mitcham, Crisosto and Kader1996) at 171, 179, 187, 196, 200, 205, 207, 211, 218, 224 and 229 days after transplanting (DAT). On the second year, harvesting started on the March 22, 2014 and ended on the May 9, 2014. Strawberry fruits were harvested at 169, 174, 180, 185, 188, 192, 195, 200, 206, 210, 214 and 217 DAT. Cumulative production (Yield) per system was then calculated for each experimental year.
Soil preparation
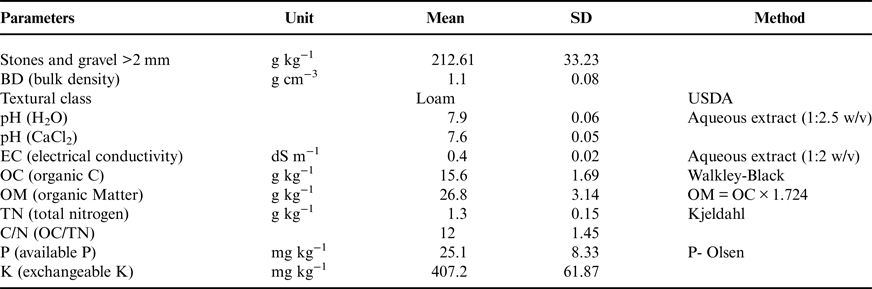
The tunnel greenhouse was installed in May 2012 on soil that had been organically managed for 10 years. Soil was left fallow for 2 years, before the beginning of this experiment, then ploughed by a rotary tiller (SICMA CS 105). Soil was sampled at time zero to determine physical and chemical characteristics, reported in Table 2. In both the experimental years, the same agronomic practices were applied. Before strawberry transplanting, the soil bed was prepared with three windrows for each plot. The water supply system was placed on the top of the windrows for drip irrigation. The whole soil bed was covered by black polyethylene plastic as mulch. On each windrow one line of strawberry was cultivated.
Soil physical and chemical characteristics in May 2012 before greenhouse establishment.

Means and standard deviation (SD) values of 18 samples are reported.
Organic amendment and fertilizers
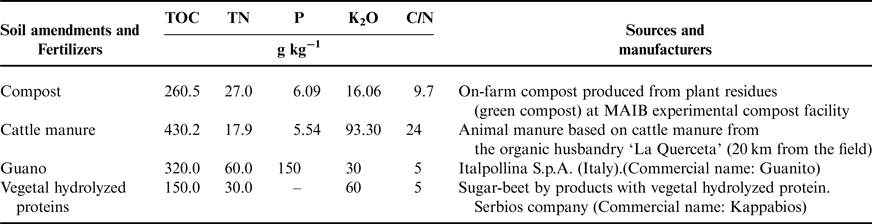
The total amount of amendments and fertilizers applied to the three systems and their chemical composition are reported in Tables 3 and 4, respectively. A liquid organic fertilizer based on vegetal proteins (Serbios SRL, Kappabios) was applied during plant growth using a drip fertigation system at a rate of 67 kg ha−1 of commercial product. The frequency of fertigation was approximately once a week since 120 DAT in SB system, every 2 weeks in AM and every 10 days since 160 DAT in AC. The irrigation protocol for each system was the same. Compost and cattle manure samples were analyzed in triplicate for dry matter, organic matter (OM) and total organic carbon (TOC), total nitrogen (TN), phosphorous (P) and potassium (K2O). Dry matter was calculated by weight loss overnight in oven at 105°C. OM was determined by ignition of 5 g of samples in a muffle furnace at 550°C, and TOC was calculated by dividing OM by the coefficient of 1.92 according to ISPRA methods (2001). TN was analyzed according to the Kjeldahl method. After mineralization of 0.5 g of samples, total P was determined by a spectrophotometer (model Megatech SP9) and K2O was analyzed by flame photometer (Sherwood 410 microwave digester CEM model).
Organic amendments and commercial fertilizers supplied per each system.

1 liquid fertilizer (reported as kg N ha−1 instead of Mg ha−1).
SB, SUBSTITUTION; AM, AGROMAN; AC, AGROCOM.
Chemical characteristics of the amendments and of the commercial fertilizers supplied to the three systems.

TOC, total organic carbon; TN, total nitrogen; P, total phosphorus; K2O, total potassium; C/N, C/N ratio.
Plant sampling and analysis
Each year, at the end of the ASC cycle, three quadrants (0.25 m × 0.25 m) per plot were used to sample the fresh aboveground biomasses. Strawberry fruits, at the same stage of maturity at each harvest, were collected from the plot and divided into two subsets. One part was dried and stored for nutrient analysis and the other one was quickly delivered at the post-harvest laboratory of the University of Foggia (Italy) for quality evaluation. Strawberry aboveground residues were sampled at the end of each cropping cycle. The aboveground biomasses and fruits were divided into two parts: one was dried at 105°C for the determination of the dry matter content by gravimetric loss, while the other was dried at 60°C for carbon and N determinations. On ASC samples, organic matter was determined by ignition in a muffle furnace at 550°C, then organic carbon was calculated according to ISPRA methods (2001). Total N was analyzed by Dumas method using the elemental analyzer Turbo N (Perkin-Elmer series II 240).
Fruit quality
The maturity stages of the fruits were visually evaluated according to the protocol of the Agricultural Marketing Service and Vegetable Division (USA, Fresh Products, 1997). Color was measured on two sides of the fruit using a colorimeter (CM-2600d, Minolta, Osaka, Japan) in the CIE L*, a*, b* mode. Hue angle and chromaticity were calculated as Hue° = arctan b*2/a*2 and Chroma = SQRT (a*2 + b*2), respectively. Firmness was determined on ten strawberry fruits for each replicate as the percentage of diameter deformation when a 5 N (kg m s−2) force was applied between two parallel plates using a Universal Testing Machine (INSTRON 3343 Norwood, MA, USA).
Strawberry juice was obtained by squeezing 5 g of fruits for each replicate. Juice drops were used for direct readings of total soluble solids percentage (TSS) with a digital refractometer (Atago N1, PR32-Palette, Tokyo, Japan), while 2 g of juice were used for pH and TA measurements using an automatic titrator (TitroMatic CRISON, Spain) with 0.1 mol L−1 NaOH solution up to pH 8.1. TA was reported as percentage of citric acid per 100 mL.
Total phenol content (TotPh) was determined on 5 g of fruit tissue extract according to the method reported by Singleton and Rossi (Reference Singleton and Rossi1965), slightly modified (Amodio et al., Reference Amodio, Derossi and Colelli2014). The content of total phenols was calculated on the basis of gallic acid calibration curve and expressed as mg gallic acid kg−1 of fruits fresh weight.
Vitamin C content (VitC) was assessed homogenising 5 g of fruits for 1 min with 5 mL of methanol/water (5:95) in the presence of citric acid (21 g L−1), Ethylenediaminetetraacetic acid (0.5 g L−1) and NaF (0.168 g L−1). The homogenate was filtered through cheesecloth and the pH adjusted to 2.2–2.4 by addition of 6 mol L−1 HCl. The homogenate was centrifuged at 10,000 rev−1 for 5 min and the supernatant was recovered, filtered through a C18 Sep-Pak cartridge (Waters, Milford, MA, USA) and then through a 0.2 µm cellulose acetate filter. L-ascorbic acid (AA) and L-dehydroascorbic acid (DHA) content was determined as described by Zapata and Dufour (Reference Zapata and Dufour1992), modified as in Gil et al. (Reference Gil, Ferreres and Tomas-Barberan1999). Samples (20 µL) were analyzed with an HPLC (Agilent Technologies 1200 Series; Agilent, Waldbronn, Germany) equipped with a DAD detector and a binary pump. Separation of DFQ and AA was achieved on a Zorbax Eclipse XDB- C18 column (150 mm × 4.6 mm; 5 µm particle size; Agilent Technologies, Santa Clara, CA, USA). The detector wavelengths were 348 nm for DHA and 251 nm for AA. AA and DHA contents were expressed as mg of L-ascorbic or L-dehydroascorbic acid per 100 g of fresh weight of strawberry fruits.
Soil sampling and analysis
Each year, four elementary soil samples were taken from each plot at different plant phenological phases (at transplanting time, 0 DAT; first flowering, 50 DAT; start of harvesting, 200 DAT and at the end of the crop cycle, 280 DAT). Samples were collected using an auger at 0–30 cm depth and mixed to form a composite sample for each plot.
Over the cropping cycle, total mineral nitrogen (SMN) at T1 (SMN-T1), T2 (SMN-T2), T3 (SMN-T3) and T4 (SMN-T4) was determined as the sum of nitric (NO3 −-N) and ammonium nitrogen (NH4 +-N). Fresh soil samples were sieved at 2 mm and extracted with 2 M KCl (1:10 w/v). NH4 +-N was determined according to Krom (Reference Krom1980), and NO3-N according to Henriksen and Selmer-Olsen (Reference Henriksen and Selmer-Olsen1970).
Every year, at the beginning of the experiment (T1) and at the end of the cropping cycle (T4), the soil samples were dried in oven at 105°C overnight to determine Total Organic Carbon (OC-T4) and total N (N-T4). Soil OC-T4 was measured with a LECO Carbon Analyzer. Soil N-T4 was determined by Kjeldahl method.
Nitrogen budget and organic carbon input
Nitrogen budget was evaluated following the criteria proposed by Watson et al. (Reference Watson, Bengtsson, Ebbesvik, Loes, Myrbeck, Salomon, Schroder and Stockdale2002) for the calculation of the surface input/output balance. Nitrogen budget was estimated accounting the inputs and outputs of N in each system, as follows:
 $${\rm N}\;{\rm budget} = {\rm N}\;{\rm input} - {\rm N}\;{\rm output}$$
where, N input = SMN-T1 + N-ASCs + N-Compost + N-Manure + N-organic fertilizer; N output = Fruit Nuptake + Residues Nuptake + SMN-T4.
Nitrogen input was calculated by adding initial soil available N (SMN-T1 converted in kg of N per hectare) and unit of N supplied by organic fertilizers, amendments and ASCs. Similarly, N output was calculated by adding the N up-taken by fruits and plant residues to the final soil available N (SMN-T4 converted in kg of N per hectare). The N budget resulted by output less input. According to Möller (Reference Möller2009), atmospheric N deposition, symbiotic N2 fixation and gaseous losses via denitrification (N2 and N2O) were not included in the N budget, due to the difficulties in assessing reliable amounts of inputs and losses. According to this calculation, the higher the budget the higher is the input that has not been removed from the systems (N surplus). The closer to zero is the budget, the more equilibrated is the system in the short term. Negative values of N budget indicate a depletion of soil N fertility (N deficit), not sustainable in the long run. For each year, Carbon content of ASCs, organic fertilizers and amendments were multiplied by the correspondent biomasses per hectare values in order to calculate the organic carbon input (OC-Input).
Statistical analysis
Univariate analysis of variance (ANOVA) on the whole dataset was performed considering Year (Y) as random factor and System (S) as fixed factor. Before analysis, the Levene Test was performed to verify the homogeneity of error variances. Mean comparison was carried out according to the Tukey Test, at P ≤ 0.05 probability level. The elaboration was carried out using STATISTICA (StatSoft, Inc. 2007, version 8.0). A principal components analysis (PCA) was performed to describe the whole variability of the recorded fruits quality data at harvesting time throughout a multivariate methodology. The CANOCO 5 software was used to elaborate an unconstrained PCA. A subset of supplementary variables was reported on the PCA biplot in order to summarize the correlation among organic fertility management strategies, N budget, yield and quality of organic strawberries in the experimental conditions. In particular, the main parameters discriminating the compared systems, OC-T4, SMN-T4 in kg of N per hectare, Ntot, C-input, N-budget and Yield were used to explain the experimental variation of the quality traits based on the different organic production systems.
Results
Yield evaluation
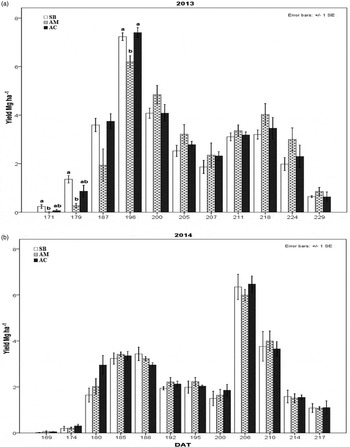
In both years, strawberries were harvested according to fruit ripening. In 2013, harvesting season lasted 58 days, while in 2014 only 48 days. No significant difference was observed in the yield in the Y × S interaction. On the other hand, higher yields were obtained in 2013 (30.3 Mg ha−1) compared with 2014 (28.9 Mg ha−1; P ≤ 0.05), while no differences were observed for system factor (data not shown). In order to evaluate the precocity of strawberry ripening in compared systems, the yields for each year at any harvesting time (in Mg ha−1) were compared (Figs 1a and 1b). In the first year, SB yields at the first harvesting times (171 DAT and 179 DAT) were significantly higher than AM, while AC was characterized by an intermediate level of production (Fig. 1a). At 196 DAT, all systems reached a peak of production, with AM showing the lowest value. On the other hand, during the last month of harvesting, AM systematically produced more than the other two systems, even if the difference was not statistically significant, recovering the production gap of the first harvesting times. In 2014, the yield differences among systems were never significant and the peak of production was reached at 206 DAT (Fig. 1b).
Yield at different harvesting times in 2013 (a) and in 2014 (b). DAT: Days after transplanting. Bars with different letters are significantly different according to Tukey test for P ≤ 0.05. SB, SUBSTITUTION; AM, AGROMAN; AC, AGROCOM.

Available soil mineral N and N budget
No significant differences for available SMN were recorded for S, Y and Y × S interaction. In both 2013 and 2014, available SMN was high from transplanting to harvest for the three compared systems (Figs 2a and 2b).
(a) (2013) (b) (2014). Soil Mineral Nitrogen at 0 DAT, 50 DAT, 200 DAT and 280 DAT (0 DAT, transplanting time; 50 DAT, first flowering; 200 DAT, start of harvesting; 280 DAT, end of the crop cycle). SB, SUBSTITUTION; AM, AGROMAN; AC, AGROCOM.

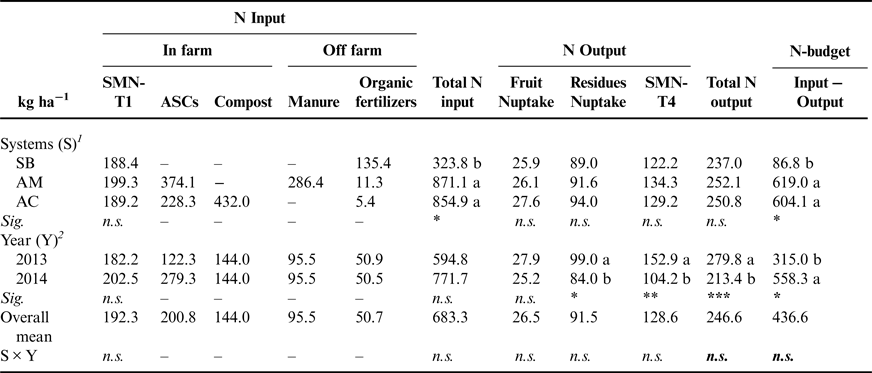
The ANOVA results for N budget are reported in Table 5. No significant Y × S interaction was found for the tested parameters, while significant differences, due to the S factor, were observed for the Total N input and N budget. In particular, the AM and AC had significantly higher total N input (up to 169%) than SB, despite no differences among systems were observed for SMN-T1. Accordingly, the SB system showed the lowest N surplus (N budget), due to the absence of differences in Total N output among treatments. As far as the Y factor is concerned, the first experimental year was characterized by higher strawberry Nuptake (in terms of residues) and SMN-T4, resulting in Total N output values higher in 2013 than in 2014. As a consequence, a significantly higher N surplus was observed in 2014 compared with the previous year (558.3 and 315.0 kg ha−1 of N, respectively).
Soil N surplus/deficit or N-budget (kg N ha−1) for the strawberry growing season of the whole experiment divided by systems and years.

1 The mean values of the 2 years are reported by systems.
2 The mean values among the three systems are reported by year.
The mean values followed by different letters are significantly different according to Tukey test for P ≤ 0.05.
SB, SUBSTITUTION; AM, AGROMAN; AC, AGROCOM.
Fruit quality
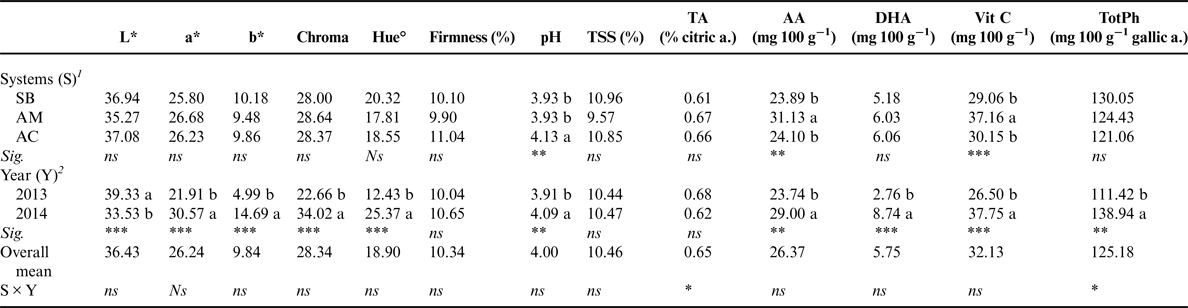
The effects of year (Y), system (S) and the Y × S interaction on strawberries quality attributes are reported in Table 6. As far as the Y factor is concerned, L*, a*, b*, Chroma, Hue°, pH, AA, DHA, VitC and TotPh showed significant differences. All parameters, except L*, showed higher values in 2014 than in 2013. Regarding the S factor, no significant differences were observed for almost all the parameters except pH, AA and VitC. In particular, pH was lower in SB (3.93) and AM (3.93) than in AC (4.13), whereas for AA and VitC, AM showed the significantly highest values. The Y × S interaction was significant only for TA and TotPh (data not shown). In AM system TA was significantly higher (P ≤ 0.05) in the first year (0.77% citric ac. 100 mL−1 of fruit juice) than in the second one (0.57% citric ac.), while TotPh was significantly lower in 2013 (95 mg gallic ac. 100 g−1 of fresh weight) than in 2014 (154 mg gallic ac. 100 g−1 of fresh weight).
Effect of production systems on quality attributes of organic strawberries at harvest for the whole experiment divided by systems and years.

1 The mean values of the 2 years are reported by systems.
2 The mean values among the three systems are reported by year.
The P-values of the ANOVA are represented by stars such as: *P < 0.05; **P < 0.01; ***P < 0.001.
The mean values followed by different letters are significantly different according to Tukey test for P ≤ 0.05.
SB, SUBSTITUTION; AM, AGROMAN; AC, AGROCOM.
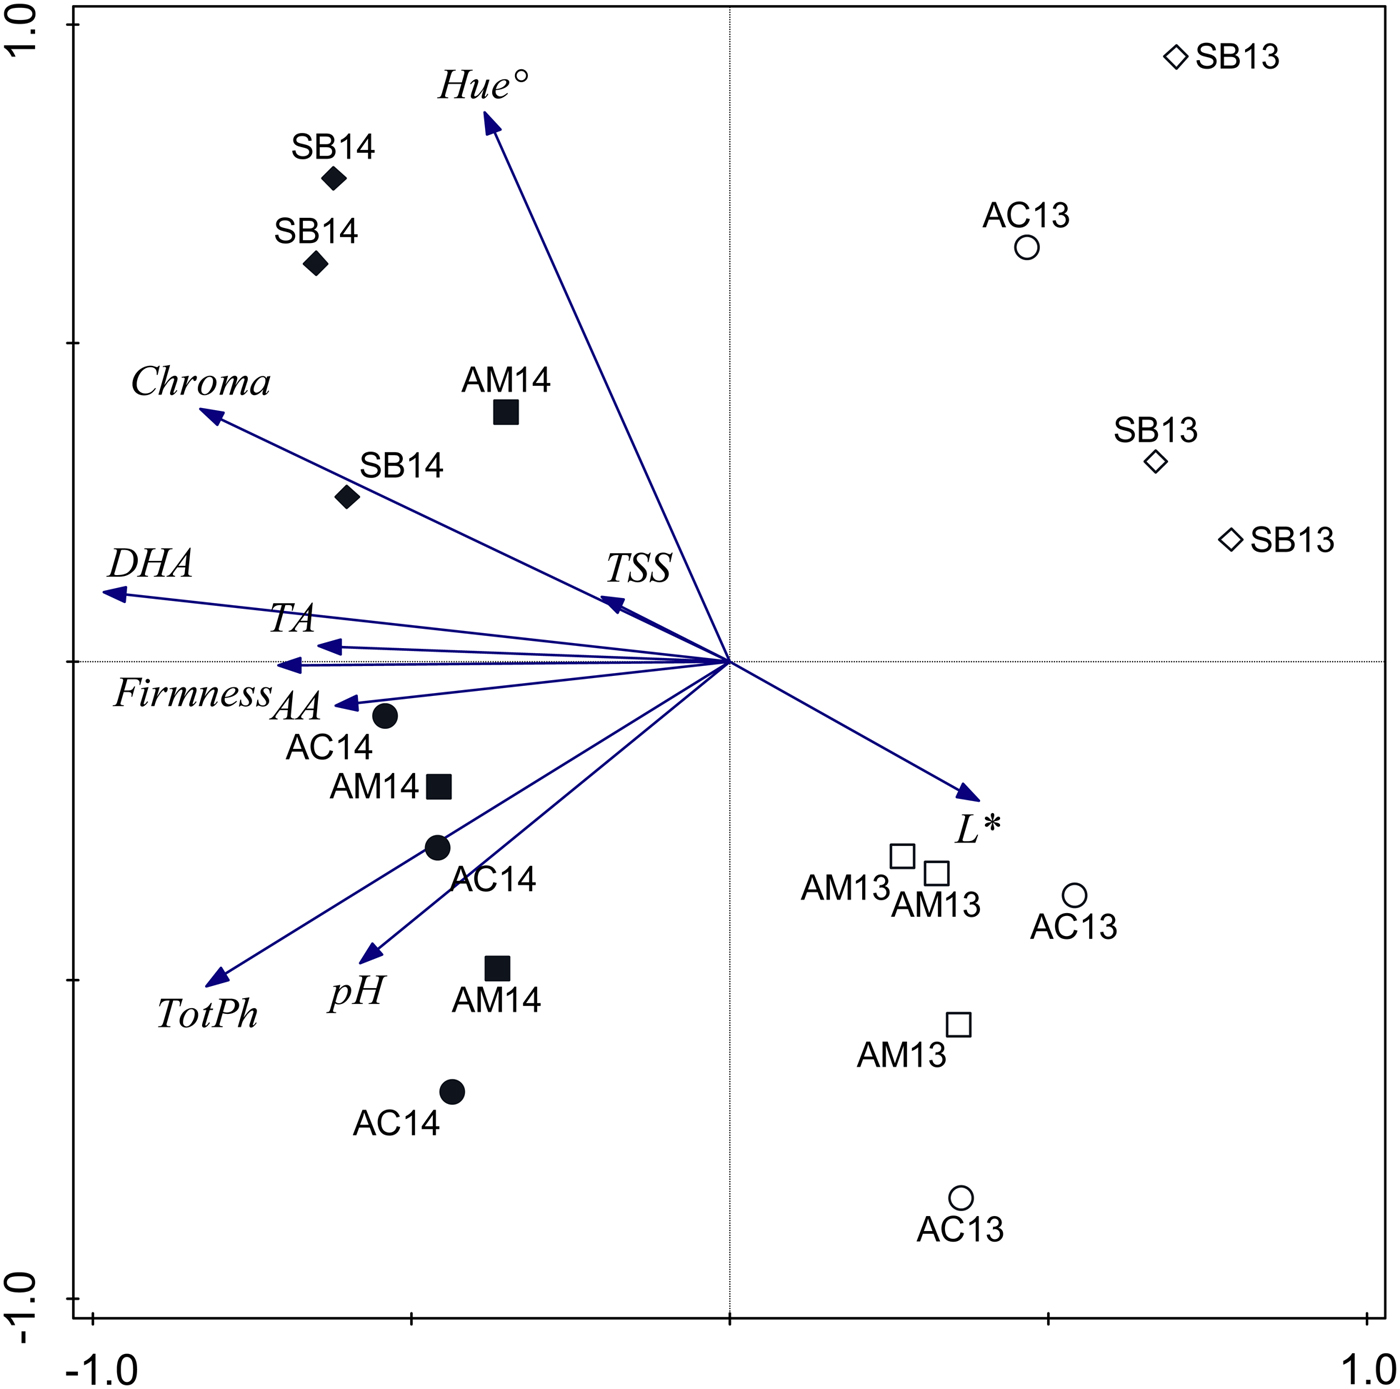
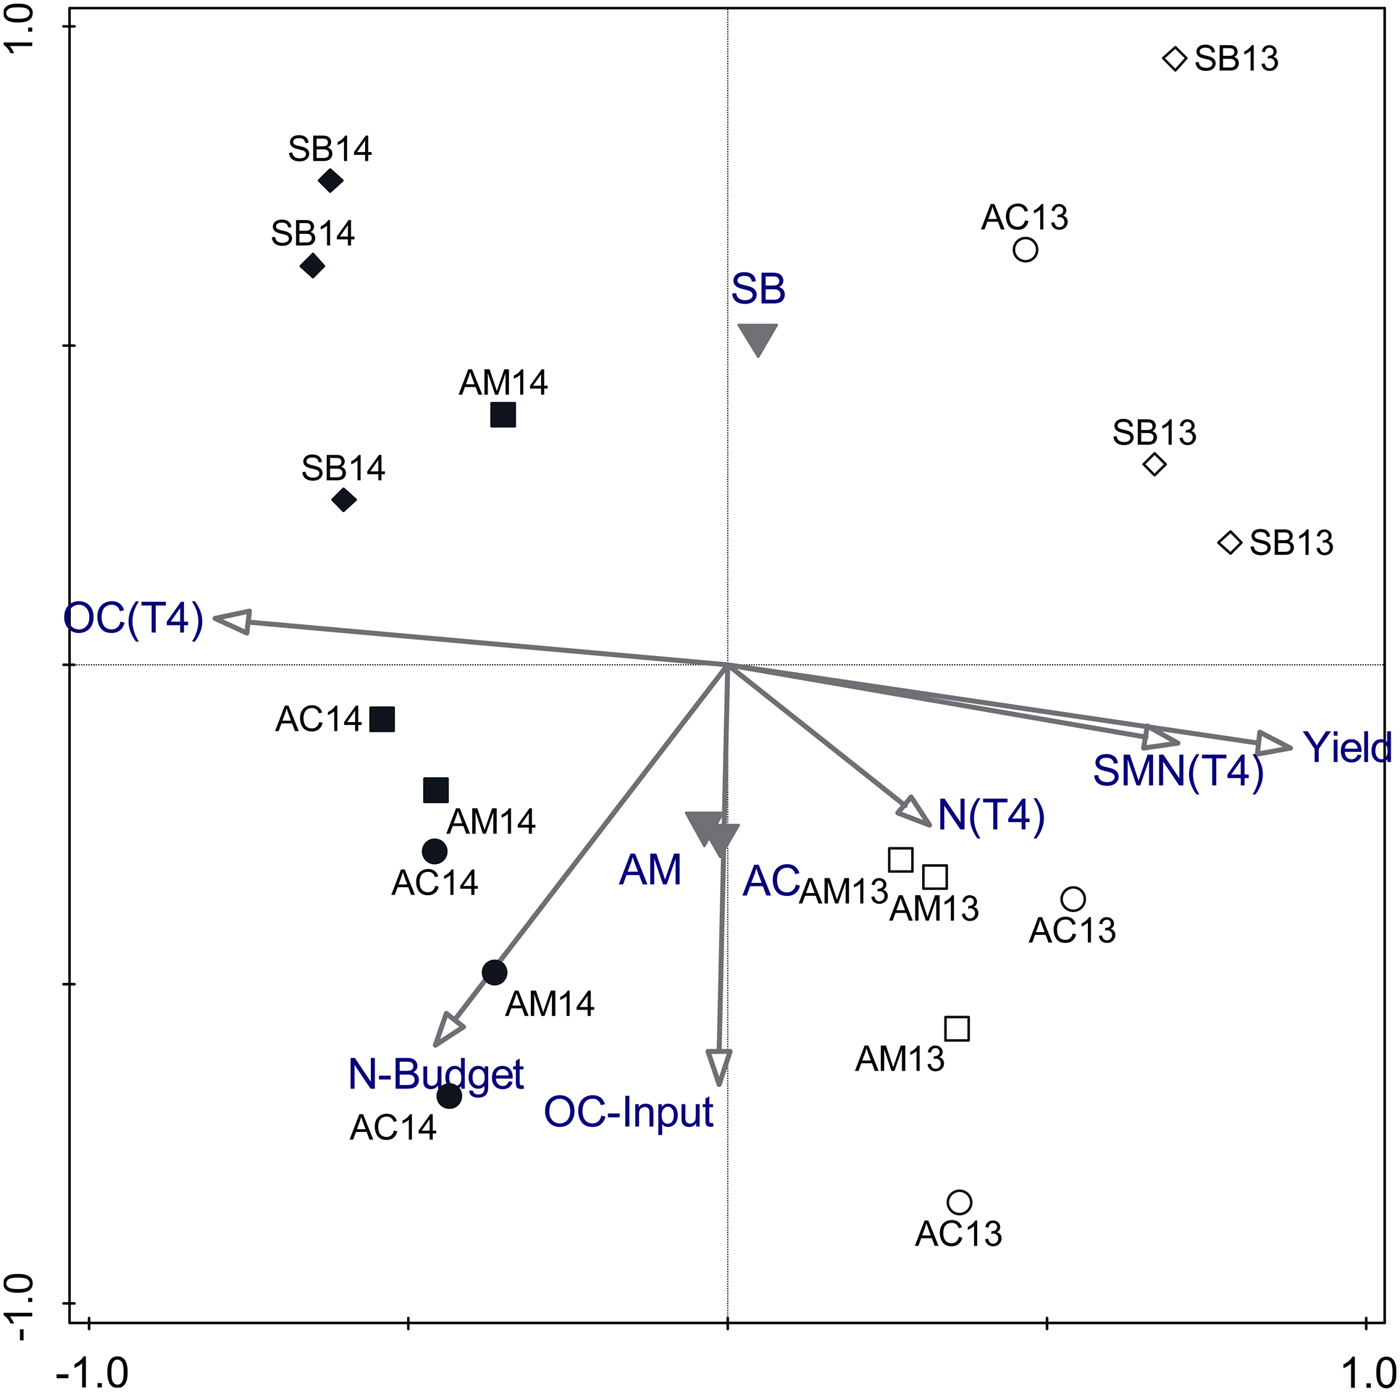
The PCA summarized the variation of the quality trait composition at harvest (Figs 3 and 4). Starting from the 22 tested quality parameters, the first two components of PCA (PC1: X-axis and PC2: Y-axis) explained about 83% of the global experiment variability (PC1: 67% and PC2: 16%). The distance among the observations in the scatter chart approximates the dissimilarity of their quality trait composition. The X-axis completely discriminates the 2 experimental years regardless of the organic system (Fig. 3). In particular, the plots representing 2013 (reported with ‘13’ label) scored in the right side of the biplot while the 2014 plots (reported with ‘14’ label) scored in the left side. Differences in 2014 samples on the horizontal direction are mainly attributed to Firmness, TA, AA and DHA (axes negative values) and to L* values (axes positive values). Looking to PC2, the conventionalized organic system SB scored in the upper quadrants of the biplot, while both the agro-ecological systems, AC and AM, scored in the bottom ones, with the only exception of one AC13 and one AM14 observations. PC2 resulted positively correlated with fruit Hue° and Chroma, and negatively correlated with pH and TotPh, representing AC and AM. No differences were observed between the two agro-ecological approaches for the analyzed parameters. This finding is clearly confirmed by the position of the system centroids (represented by the solid triangles in the Fig. 4).
Biplot of the unconstrained principal component analysis. PC1 (X-axes) explains 67% and PC2 (Y-axes) explains the 16% for a total of 83% of the overall variability of the experiment. Observation (experimental plots) score scaling is focused on quality trait scores (standardized). Each quality trait is represented by a single arrow that points in the direction of the steepest increase of the values for the corresponding quality parameter. Plot symbol is diamond for SB, circle for AC, square for AM; plot area is filled with a solid brush for 2012–13 trial and it is left empty for the 2013–14 trial. Plot label legend is: SB, SUBSTITUTION; AM, AGROMAN; AC, AGROCOM; 13 = 1st year-field II (2013); 14 = 2nd year field I (2014). Quality traits legend: L*, Hue° and Chroma are the fruit color attributes; TSS, total soluble solids in percentage; TA, titratable acidity; pH, fruit pH; Vit C, vitamic C; TotPh, total phenols of fruit; Firmness, % of fruit diameter deformation under pressure.

Plots score of the unconstrained principal component analysis with supplementary variables. Each supplementary variable is represented by a single arrow that points in the direction of the steepest increase of the values for the corresponding parameter. The centroids (average score of each system in the new components) are represented by solid triangles. Plots score scaling is focused on quality trait scores (standardized). Axes 1 explains 67% and axes 2 explains the 16% for a total of 83% of the overall variability of the experiment. Plot symbol is diamond for SB, circle for AC, square for AM; plot area is filled with a solid brush for 2013–14 trial and it is left empty for the 2013–14 trial. Plot label legend is: SB, SUBSTITUTION; AM, AGROMAN; AC, AGROCOM; 13 = 1st year-field II, 2012/13; 14 = 2nd year field I, 2013–14. Supplementary variables legend: at the end of strawberry production were analyzed: OC(T4): total organic carbon of the soil at T4 sampling time that is at the end of each strawberry cycle; N(T4): total Kjeldahl nitrogen of soil at the end of each strawberry cycle in gkg−1, SMN(T4): total mineral nitrogen of soil at the end of strawberry cycle in kg ha−1, during the whole production cycle were calculated: OC-input: Organic carbon input (from ASCs, organic amendments and fertilizers) in ton ha−1; N-budget: nitrogen budget; Yield: Strawberry cumulative yield in t ha−1 of dry matter.

Figure 4 shows the results of the PCA with agronomic parameters (OC-T4, OC-Input, Yield, N-T4, SMN-T4 and N budget), added as supplementary variables in order to represent the relations between the agronomic and the fruit quality parameters. It can be observed that Yield, OC-T4 and SMN-T4 correlate with the X-axis, explaining the difference between the 2 years, whereas OC-Input and N-Budget correlate with Y-axis, differentiating AC and AM from SB.
As it is possible to observe in Figure 3, the biplot of the multivariate analysis presented the eigenvectors of AA and Phenols (TotPh) in the left side of the chart showing an increasing trend during the years. This observation is consistent with the increase of OC in the soil as showed in Figure 4. Moreover, TotPh arrow is in the low part of the chart (Fig. 3) where agro-ecological systems plots are scattered.
Discussion
Differences in total yield and peak of production in the 2 experimental years can be explained by the different trend and fluctuation of day/night temperature under short photoperiods, which could have influenced total blossom bud differentiation and flowering time (Kronenberg et al., Reference Kronenberg, Wassenaar and van de Lindeloof1976; Tanino and Wang, Reference Tanino and Wang2008). Despite the low chilling requirement of the ‘Festival’ cultivar, the total yield might have been affected by the difference in the minimum winter temperatures between 90 and 150 DAT, which were on average higher in 2014 than in 2013 (5.5 and 2.5°C, respectively; data not shown). Moreover, in the same period, day/night fluctuation was higher in 2013—ranging between 2.5 and 37°C—than in 2014—ranging between 5.5 and 33.5°C. As far as the system of production is concerned, the three compared treatments did not differentiate significantly in terms of strawberry quantitative yield in both the experimental years. This result indicates that strawberry production was characterized by similar cumulative yields both in organic conventionalized (SB) and organic agro-ecological (AM, AC) systems, confirming the hypothesis that even more complex fertilization patterns can guarantee a level of production similar to more simplified systems. Each year, the SMN trends during the whole crop cycles, from T1 to T4, were coherent with the observed yields (Fig. 1). The higher SMN value of T1 in 2013 compared with 2014 was due to the different preceding crop in the two fields (fallow in 2013 and tomato in 2014). Despite this initial difference, the SMN during the whole cropping cycle and the SMN at the peak of production (around 50 mg N kg−1 soil; Figs 2a and 2b) were similar in the following sampling times (T2–T4) in both years. This goal was achieved despite the different origins and C/N ratios of the organic materials incorporated to soil (Table 4). As far as the strawberry quality is concerned, the results of the SMN are not consistent with the total soluble solid values. According to Wang and Millner (Reference Wang and Millner2009), the higher the SMN concentration, in comparison with the plant demand level, the lower the TSS of strawberry fruits. On the contrary, in our experiment the overall mean value of TSS (10.46%) resulted higher than the values reported in the literature (8.00%) for the same variety transplanted in the same period of the year (Rahman, Reference Rahman2014). Moreover, the more available the soil nutrients are for root uptake the higher the plant cells production is oriented toward the primary metabolism leading to big fruits, high protein content and low concentration of secondary metabolites (Gill and Tuteja, Reference Gill and Tuteja2010). In 2013, the higher yield was characterized by a lower fruit quality. In 2014, the lowest initial SMN availability could have determined accumulation of reactive oxygen compounds (ROS) as a consequence of plant stress response mechanisms, increasing the antioxidant compounds content (Roitsch, Reference Roitsch1999). Amongst the antioxidants, VitC and total phenols have been considered for the present study. In their work on sweet pepper, Gomez-Lopez and del Amor (Reference Gomez-Lopez and del Amor2013) have reported the highest concentration of VitC in systems treated with organic amendments (horse and sheep manures). In the present study the differences in strawberry quality between organic conventionalized and organic agro-ecological systems retrace the results of conventional/organic comparison studies reported in the literature. Despite the compared systems are all within the borders defined in the EU Regulatory framework for organic farming, the organic conventionalized system has presented strawberry with diverse characteristics compared with organic agro-ecological system produce. Similar differences are reported among conventional and organic system. Studies of organic-conventional comparison (Amodio et al., Reference Amodio, Colelli, Hasey and Kader2007; Brandt et al., Reference Brandt, Leifert, Sanderson and Seal2011; Jin et al., Reference Jin, Wang, Wang and Zheng2011; Oliveira et al., Reference Oliveira, Moura, Gomes-Filho, Marco, Urban and Miranda2013) reported VitC content significantly higher in the organic systems compared with the conventional ones. Few published studies compared phenols values between organically and conventionally grown strawberries, finding higher phenols content in organic strawberry fruits than in conventional ones (Asami et al., Reference Asami, Hong, Barrett and Mitchell2003; Reganold et al., Reference Reganold, Andrews, Reeve, Carpenter-Boggs, Schadt, Alldredge, Ross, Davies and Zhou2010). As far as the relationship between nutrient availability and quality parameters is concerned, Lee and Kader (Reference Lee and Kader2000) reported many studies that described a decrease in VitC content in fruits and vegetables supplied with high rates of mineral N. Similar considerations might concern the strawberry color attributes. Multivariate analysis has shown high values of Hue° in SB fruits. By assuming the same values of L*, higher values of Hue° correspond to a lower intensity of red color in the strawberry fruit (Atress et al., Reference Atress, El-Mogy, Aboul-Anean and Alsaniu2010; Jouki and Dadashpour, Reference Jouki and Dadashpour2012). In this respect, Charissa et al. (Reference Charissa, Kent, Gidley, Netzel, Zabaras, Herrington and Netzel2013) reported that strawberry Hue° is inversely correlated to the anthocyanin fruits contents and it might be a suitable screening tool.
The input-output balance highlights a higher N-surplus in the agro-ecologically managed organic systems compared with the conventionalized one. Since the budgets do not provide information about the fate of any N-surplus (Watson et al., Reference Watson, Bengtsson, Ebbesvik, Loes, Myrbeck, Salomon, Schroder and Stockdale2002), a more in depth direct and indirect evaluation of the different N forms in soil is needed. As a matter of fact, no significant differences were observed among systems in terms of SMN through the entire strawberry cropping cycle. In particular, as pointed out above, neither AM nor AC, which incorporate in soil high quantities of organic materials, seem to immobilize SMN compared with SB (Figs 2a and 2b). In the long run, the introduction of short cycle green manure in the rotation should reduce the risk of nutrient imbalances (mainly N/P and N/K), which is typical of intensive systems of production, as reported by Voogt et al. (Reference Voogt, de Visser, van Winkel, Cuijpers and van de Burgt2011). Nitrate leaching in the compared systems was measured and resulted negligible (data not reported), due to lack of rainfall (protected condition) and to accurate irrigation protocols. These results, consistent with Ciaccia et al. (Reference Ciaccia, Montemurro, Campanelli, Diacono, Fiore and Canali2015), evidence that most of the N-surplus was probably represented by organic N forms (whose sources were mainly ASCs, compost and manure). As a consequence, in our experiment the N-surplus might be the basis of N long-term fertility of the agro-ecological production systems, as it would be available for subsequent crops in rotation (Tittarelli et al., Reference Tittarelli, Campanelli, Farina, Napoli, Ciaccia, Testani, Leteo and Canali2014). On the other hand, SB showed a more equilibrated N-budget compared with the other two systems, denoting the capability of sustaining the yield of the current crop (similar strawberry yield compared with AC and AM systems; Figs 1a and 2b), but with no effect on N fertility in the long run. The results of the PCA based on the fruit quality parameters, have been further described with the help of supplementary agronomic variables (Fig. 4). These parameters (OC-input, N-budget, OC-T4, SMN-T4, yield) were calculated during the whole production cycle and analyzed at the end of the strawberry production. Results put in evidence that soil organic carbon clearly increases over time (from right to left). Considering the Y-axis, which discriminate the three compared systems, the input of carbon (OC-input) and the surplus of N at the end of harvest (N-budget) are positively correlated to the agro-ecological systems (AC and AM).
It is possible to conclude that the differences in inputs, in terms of quantity and quality of organic matter added to soil, have been effective in improving both the soil properties (organic carbon) and the organic strawberry fruit quality of AM and AC. As expected, the two agro-ecological treatments did not differentiate in the period of time analyzed. These results evidence that, in the short term, total amount of C input discriminates the treatments much more than the type of amendment applied to soil (compost or animal manure) and the mixture of ASC utilized.
Conclusions
An agro-ecological approach to organic strawberry production in Mediterranean greenhouse is challenging from different points of view: (i) quantity and quality of strawberry production, (ii) soil fertility management and more in general, (iii) system sustainability. The results obtained with our research, demonstrated that the higher level of complexity of agro-ecological approaches, in comparison with a ‘conventionalized’ organic one, does not reduce the yield expectations. Nutrients crop requirements were guaranteed by all treatments during the whole crop cycle of strawberry, characterized by a harvesting period of around 2 months. The two agro-ecological treatments determined a surplus of organic N in soil, potentially available for the next crops in rotation. The introduction of ASC in summer period reduces significantly the period of time in which soil is not covered by vegetation and, consequently, the negative side effects of nitrate leaching. The implementation of systems of production, which determined an increase of soil organic N pool, is the basis for long-term soil fertility management in Mediterranean organic greenhouse. From a production quality perspective, according to the multivariate investigation, AM and AC allowed obtaining strawberry fruits similar to SB, but with better characteristics in terms of color and phenolic content which, for their influence on organoleptic properties and antioxidant effects, potentially have a strong market appeal. Differences between the two compared agro-ecological treatments were not significant in the framework of a biennial experiment.
On the basis of the results obtained so far, a complete analysis of the agronomic and productive performances of the different treatments and of their economic sustainability for the entire rotation would be desirable to confirm the findings observed for strawberry and for a more accurate evaluation of the compared systems of production.
Acknowledgement
This study has been carried out in the framework of the activities of BIOSEMED project funded by the Italian Ministry of Agriculture. We would like to thank Mr Yazan Kullab for his help in monitoring crops on field.